. 2017 Oct 5;12(10):e0185249.
doi: 10.1371/journal.pone.0185249. eCollection 2017.

Liver segmentation from CT images using a sparse priori statistical shape model (SP-SSM)

Affiliations

Liver segmentation from CT images using a sparse priori statistical shape model (SP-SSM)

Xuehu Wang et al. PLoS One. .

Abstract

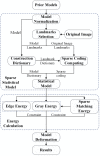
This study proposes a new liver segmentation method based on a sparse a priori statistical shape model (SP-SSM). First, mark points are selected in the liver a priori model and the original image. Then, the a priori shape and its mark points are used to obtain a dictionary for the liver boundary information. Second, the sparse coefficient is calculated based on the correspondence between mark points in the original image and those in the a priori model, and then the sparse statistical model is established by combining the sparse coefficients and the dictionary. Finally, the intensity energy and boundary energy models are built based on the intensity information and the specific boundary information of the original image. Then, the sparse matching constraint model is established based on the sparse coding theory. These models jointly drive the iterative deformation of the sparse statistical model to approximate and accurately extract the liver boundaries. This method can solve the problems of deformation model initialization and a priori method accuracy using the sparse dictionary. The SP-SSM can achieve a mean overlap error of 4.8% and a mean volume difference of 1.8%, whereas the average symmetric surface distance and the root mean square symmetric surface distance can reach 0.8 mm and 1.4 mm, respectively.


Conflict of interest statement

Competing Interests: The authors have declared that no competing interests exist.

Figures

Fig 1
Fig 1. Flowchart of the proposed algorithm.
Fig 2
Fig 2. Illustration of how to build a sparse statistical shape model.
Fig 3
Fig 3. Illustration of mark point selection.
(A) Illustrates the position in relation to other tissues; and (B) represents different points of the liver.
Fig 4
Fig 4. Sketch map for dictionary building.
Fig 5
Fig 5. Sketch map for feature selection.
Fig 6
Fig 6. Sketch map for energy function calculation.
Fig 7
Fig 7. Sketch map for the selection of testing sets in the model.
(A) Two-dimensional display image of the image block; and (B) three-dimensional display image.
Fig 8
Fig 8. Process of building the sparse statistical shape model.
(A)-(F) Six groups of a priori models; (G) overlapping result after registering the six groups of data into the same coordinate space; (H)-(J) sparse statistical shape model expressed on the cross section, vertical plane, and coronal plane of the original image; and (K) three-dimensional image of the sparse statistical shape model on the original image.
Fig 9
Fig 9. Sparse statistical shape model on the original image.
The first to five rows show the five groups of original CT data; the first to fourth columns show the display results of the same group of data on the cross section, vertical plane, coronal plane, and three-dimensional space; the green line indicates the real liver boundaries of the original image; and the blue line indicates the sparse statistical shape model built based on the proposed algorithm.
Fig 10
Fig 10. Deformation process of the sparse statistical shape model under energy constraints.
(a)-(i) Results of the 1st, 3rd, 5th, 7th, 9th, 11th, 13th, 15th, and 17th iterative computations of the model.
Fig 11
Fig 11. Deformation process of the sparse statistical shape model on the two-dimensional section.
The first to fifth rows show the five groups of data, and the first to third columns show the cross section, vertical plane, and coronal plane during the deformation process.
Fig 12
Fig 12. Deformation results.
The first to fifth rows show the five groups of CT data. (A1)-(A4), (B1)-(B4), (C1)-(C4), (D1)-(D4) and (E1-E4) show the deformation results of the five groups of data on the cross section, vertical plane, coronal plane and three-dimensional space. (A5), (B5), (C5) and (D5) show the overlapping images of the deformation results of the five groups of data with the real liver boundaries. The green line indicates the real liver boundaries of the original image, and the blue line indicates the segmentation result based on the proposed algorithm.
Fig 13
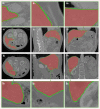
Fig 13. Segmentation results.
(A) and (B) show the two groups of CT data; (A1), (A2) and (A3) express the same groups of data on the cross section, vertical plane, and coronal plane, respectively; and (a1), (a2) and (a3) show the partially enlarged images corresponding to the green areas in (A1), (A2) and (A3), respectively. The red area in every image indicates the real liver boundaries, and the green line indicates the liver segmentation results based on the proposed algorithm.

References

    1. Salman AlShaikhli SD, Yang MY, Rosenhahn B. Brain tumor classification and segmentation using sparse coding and dictionary learning. Biomedical Engineering-biomedizinische Technik. 2016;61(4):413 doi: 10.1515/bmt-2015-0071 - DOI - PubMed
    1. Kato T, Hino H, Murata N. Multi-frame image super resolution based on sparse coding. Neural Networks the Official Journal of the International Neural Network Society. 2015;66(C):64 doi: 10.1016/j.neunet.2015.02.009 - DOI - PubMed
    1. Afzali M, Ghaffari A, Fatemizadeh E, Soltanian-Zadeh H. Medical image registration using sparse coding of image patches. Computers in Biology & Medicine. 2016;73(C):56–70. - PubMed
    1. Khormuji MK, Bazrafkan M. A novel sparse coding algorithm for classification of tumors based on gene expression data. Medical & Biological Engineering & Computing. 2016;54(6):869. - PubMed
    1. Ptucha R, Savakis AE. LGE-KSVD: robust sparse representation classification. IEEE Transactions on Image Processing A Publication of the IEEE Signal Processing Society. 2014;23(4):1737–50. doi: 10.1109/TIP.2014.2303648 - DOI - PubMed