. 2017 Nov 1;34(11):2982-2995.
doi: 10.1093/molbev/msx195.

Quantifying Transmission Heterogeneity Using Both Pathogen Phylogenies and Incidence Time Series

Affiliations

Quantifying Transmission Heterogeneity Using Both Pathogen Phylogenies and Incidence Time Series

Lucy M Li et al. Mol Biol Evol. .

Abstract

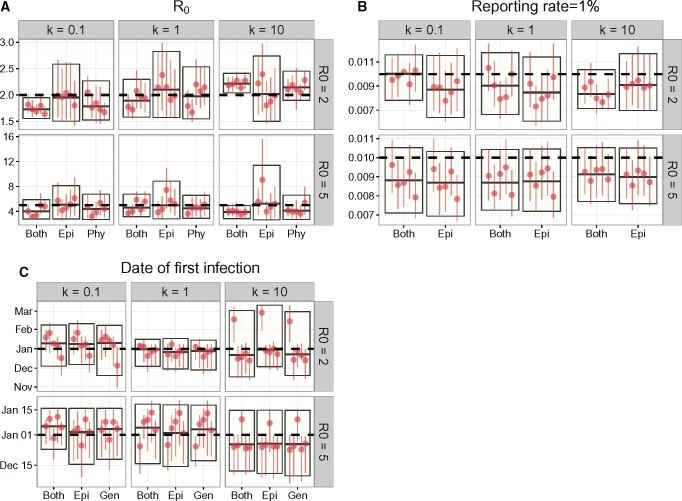
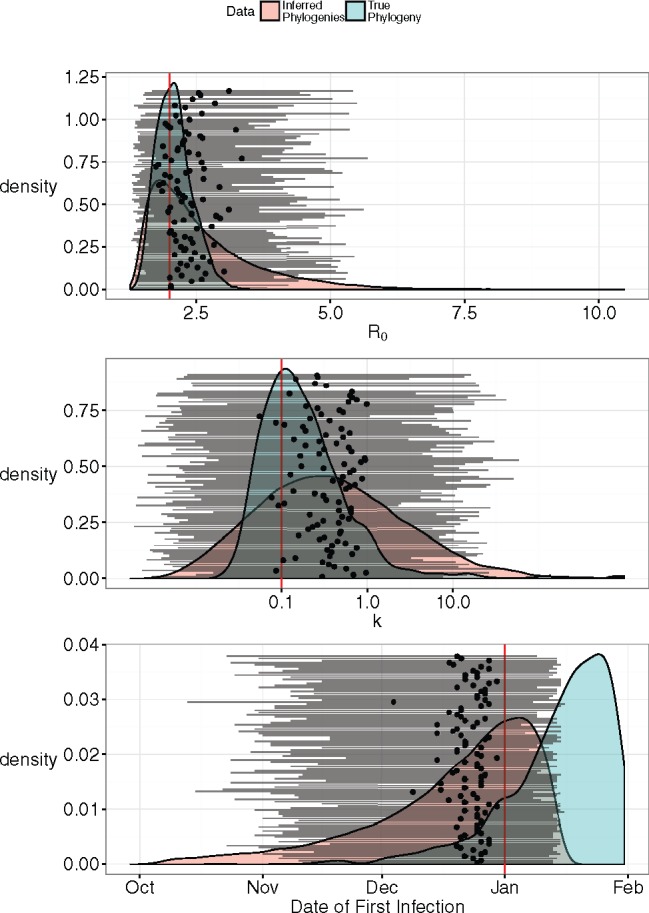
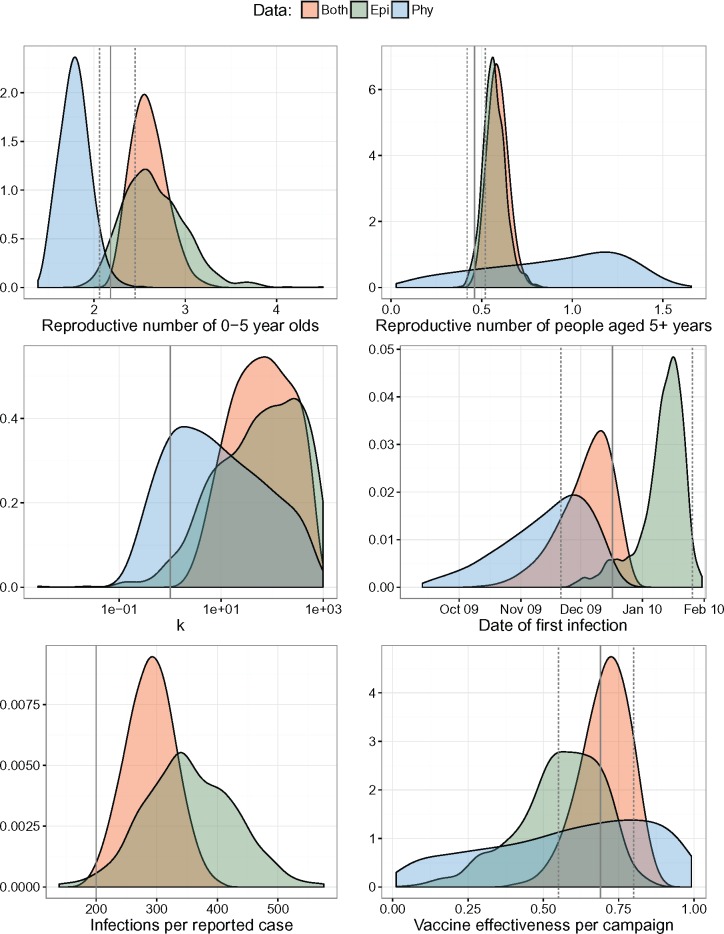
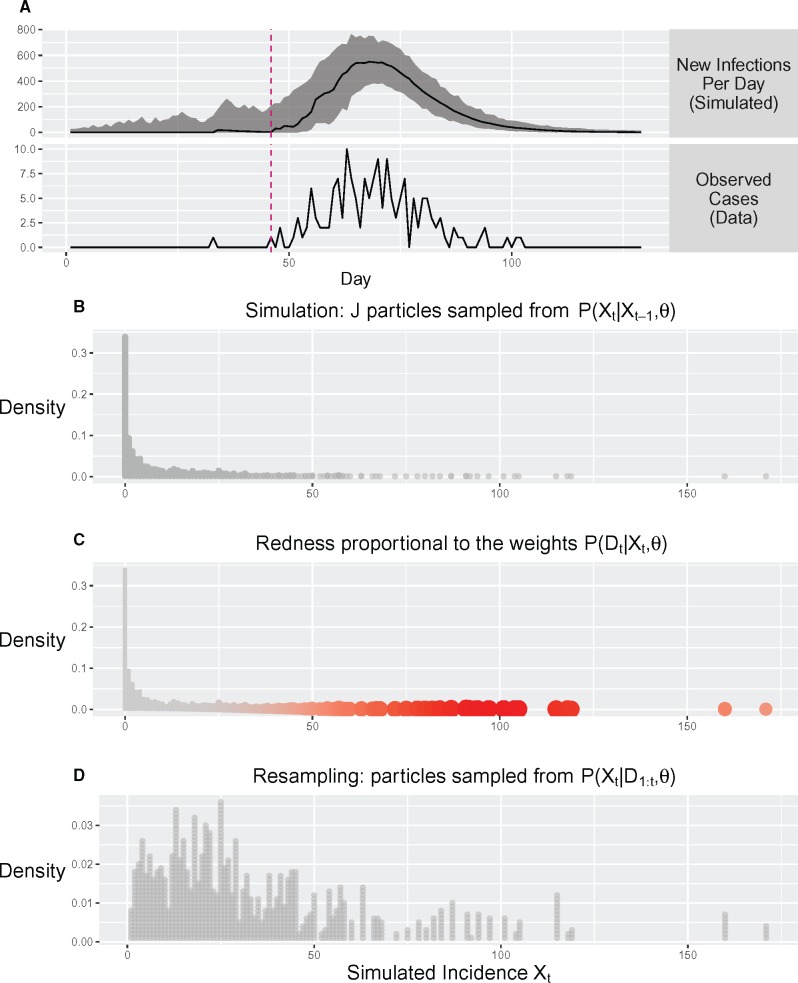
Heterogeneity in individual-level transmissibility can be quantified by the dispersion parameter k of the offspring distribution. Quantifying heterogeneity is important as it affects other parameter estimates, it modulates the degree of unpredictability of an epidemic, and it needs to be accounted for in models of infection control. Aggregated data such as incidence time series are often not sufficiently informative to estimate k. Incorporating phylogenetic analysis can help to estimate k concurrently with other epidemiological parameters. We have developed an inference framework that uses particle Markov Chain Monte Carlo to estimate k and other epidemiological parameters using both incidence time series and the pathogen phylogeny. Using the framework to fit a modified compartmental transmission model that includes the parameter k to simulated data, we found that more accurate and less biased estimates of the reproductive number were obtained by combining epidemiological and phylogenetic analyses. However, k was most accurately estimated using pathogen phylogeny alone. Accurately estimating k was necessary for unbiased estimates of the reproductive number, but it did not affect the accuracy of reporting probability and epidemic start date estimates. We further demonstrated that inference was possible in the presence of phylogenetic uncertainty by sampling from the posterior distribution of phylogenies. Finally, we used the inference framework to estimate transmission parameters from epidemiological and genetic data collected during a poliovirus outbreak. Despite the large degree of phylogenetic uncertainty, we demonstrated that incorporating phylogenetic data in parameter inference improved the accuracy and precision of estimates.

Keywords: infectious disease; parameter inference; phylodynamics; polio.


Figures

<sc>Fig</sc>. 1.
Fig. 1.
Estimates of k from simulated data. The horizontal lines denote the true value of k for that set of parameters, that is, the value used to generate the simulated data. The boxes with a horizontal line in the middle indicate the median and 95% HPD interval of parameter estimates pooled from all simulations for that parameter set. The vertical lines with a single dot denote the median and 95% HPD interval of each individual simulation. Blue lines are from simulations in which 10% of individuals were sampled. Red lines are from simulations in which 1% of individuals were sampled.
<sc>Fig</sc>. 2.
Fig. 2.
Parameter estimates when reporting rate was 1 in 100 and k was fixed to 1. The horizontal dashed lines denote the true parameter value for that set of parameters that is, the parameter value used to simulate the data. The boxes indicate the median and 95% HPD interval of parameter estimates pooled from replicate simulations. The vertical lines with a single dot denote the median and 95% HPD interval of each individual simulation. Simulations where the MCMC chain did not converge were left out of the plot. Estimates of the reporting rate did not include inference from phylogenetic data, as the reporting rate refers to the probability that an infection appears in the incidence time series.
<sc>Fig</sc>. 3.
Fig. 3.
Inference using 100 trees sampled from simulated sequences, compared with the estimates obtained using the true phylogeny. Horizontal lines with a black dot in the middle represent the median and 95% HPD intervals of parameter values estimated using each of the 100 trees. The red vertical lines are the true parameter values. The red distributions are the posterior distributions integrated over the 100 phylogenies, and the blue distributions are the posterior distributions obtained using the true phylogeny.
<sc>Fig</sc>. 4.
Fig. 4.
Posterior densities of epidemiological parameters for the 2010 wild type 1 poliovirus outbreak in Tajikistan. The solid and dashed vertical lines are the maximum likelihood estimates and 95% confidence intervals estimated in Blake et al (2014) using epidemiological data only. The solid vertical lines not accompanied by dashed lines correspond to parameter values that were fixed and not estimated.
<sc>Fig</sc>. 5.
Fig. 5.
Illustration of likelihood estimation using particle filtering (PF). (A) The median and range of simulated epidemic trajectories during PF. (B–D) show the steps that occur during one iteration of PF. (B) J epidemics (particles) are simulated. The frequency distribution of the simulated Xt is proportional to the probability density P(Xt|Xt-1,θ). (C) The weight of each simulated epidemic (particle) is calculated according to the likelihood P(Dt|Xt,θ). (D) Particles are resampled with replacement according to multinomial distribution where probabilities are the normalized particle weights. Further details of the PF implementation are given as pseudocode and discussed in more detail in the “Materials and Methods” section.

References

    1. Andrieu C, Doucet A, Holenstein R.. 2010. Particle Markov chain Monte Carlo methods. J R Stat Soc B. 72:269–342.
    1. Angez M, Shaukat S, Alam MM, Sharif S, Khurshid A, Zaidi SSZ.. 2012. Genetic relationships and epidemiological links between wild type 1 poliovirus isolates in Pakistan and Afghanistan. Virol J. 91:51. - PMC - PubMed
    1. Blake IM, Martin R, Goel A, Khetsuriani N, Everts J, Wolff C, Wassilak S, Aylward RB, Grassly NC.. 2014. The role of older children and adults in wild poliovirus transmission. Proc Natl Acad Sci U S A. 111:10604–10609. - PMC - PubMed
    1. Bouckaert R, Heled J, Kühnert D, Vaughan T, Wu C-H, Xie D, Suchard MA, Rambaut A, Drummond AJ.. 2014. BEAST 2: a software platform for Bayesian evolutionary analysis. PLoS Comput Biol. 10:e1003537.. - PMC - PubMed
    1. Burns CC, Shaw J, Jorba J, Bukbuk D, Adu F, Gumede N, Pate MA, Abanida EA, Gasasira A, Iber J, et al. 2013. Multiple independent emergences of type 2 vaccine-derived polioviruses during a large outbreak in northern Nigeria. J Virol. 87:4907–4922. - PMC - PubMed