. 2017 Sep 1;31(17):1784-1794.
doi: 10.1101/gad.305078.117.

Dense Bicoid hubs accentuate binding along the morphogen gradient

Affiliations

Dense Bicoid hubs accentuate binding along the morphogen gradient

Mustafa Mir et al. Genes Dev. .

Abstract

Morphogen gradients direct the spatial patterning of developing embryos; however, the mechanisms by which these gradients are interpreted remain elusive. Here we used lattice light-sheet microscopy to perform in vivo single-molecule imaging in early Drosophila melanogaster embryos of the transcription factor Bicoid that forms a gradient and initiates patterning along the anteroposterior axis. In contrast to canonical models, we observed that Bicoid binds to DNA with a rapid off rate throughout the embryo such that its average occupancy at target loci is on-rate-dependent. We further observed Bicoid forming transient "hubs" of locally high density that facilitate binding as factor levels drop, including in the posterior, where we observed Bicoid binding despite vanishingly low protein levels. We propose that localized modulation of transcription factor on rates via clustering provides a general mechanism to facilitate binding to low-affinity targets and that this may be a prevalent feature of other developmental transcription factors.

Keywords: Bicoid, Zelda; Drosophila; morphogen; single-molecule fluorescence; transcription factor dynamics.


Figures

Figure 1.
Figure 1.
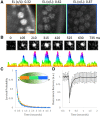
Single-molecule kinetics of BCD in living Drosophila embryos. (A) Raw images of BCD-eGFP molecules in a living Drosophila embryo acquired with a 100-msec exposure time. Bar, 5 µm. Positions along the A–P axis are shown as a fraction of the embryonic length [EL (x/L)]. (B) Example of a single-molecule-binding event. The top row shows raw images from a 1.2 × 1.2-µm area, and the bottom row shows corresponding surface plot representations to illustrate the signal to noise. (C) Uncorrected survival probability curves for BCD binding (markers) in the anterior (34 nuclei), middle (70 nuclei), and posterior (83 nuclei) segments of the embryo and corresponding fits to a two-exponent model (solid lines) show no significant differences. (D) Fluorescence recovery after photobleaching (FRAP) curve for BCD shows a recovery time on the order of hundreds of milliseconds, and error bars show standard deviation over 21 nuclei.
Figure 2.
Figure 2.
Local modulation of BCD concentration. (A) Normalized probability distributions of measured displacements in the anterior (30 nuclei), middle (67 nuclei), and posterior (66 nuclei) positions of the embryos; pie charts show the estimated mobile and bound fractions from fits to a two-population distribution, with the bound population percentage labeled with the standard error of the fit parameter. (B) Examples of the spatial distribution of all detections in nuclei along the A–P axis. Bar, 2.5 µm. (C) Distribution of the number of detections in all nuclei. (D) Distributions of the number of detections within all clusters.
Figure 3.
Figure 3.
ZLD mediated BCD binding in the posterior embryo. (A) Posterior third (blue) and whole embryo (black) BCD and whole embryo ZLD (gray). ChIP-seq signal-normalized reads at the hunchback, eve, and hairy gene loci. Red bars show known enhancers as annotated in the RedFly database; for eve and hairy, they are numbered according to the stripes that they are thought to regulate. (B) Heat map representation of normalized BCD ChIP-seq reads (first two panels) and ZLD ChIP-seq reads (third panel) in a 500-base-pair window centered on BCD peaks called in the whole-embryo data and sorted according to increasing signal of the whole-embryo data; a total of 2145 peaks is shown, and colors indicate enrichment over the background (blue), with all plots displayed on the same scale. (C) Examples of the spatial distribution of all detected bound molecules in nuclei along the A–P axis in ZLD embryos. Bar, 2.5 µm. A loss of clustering is apparent compared with the distributions shown in Figure 2B.
Figure 4.
Figure 4.
Model of ZLD-dependent modulation of the BCD on rate at specific loci in the posterior embryo. At high concentrations in the anterior of the embryo, all target sites are highly occupied. At low concentrations, loci with ZLD occupancy have an increased time-averaged occupancy through the formation of spatiotemporal hubs that enrich local concentrations and increase the on rate.

References

    1. Blythe SA, Wieschaus EF. 2016. Establishment and maintenance of heritable chromatin structure during early Drosophila embryogenesis. Elife 5: e20148. - PMC - PubMed
    1. Bradley RK, Li XY, Trapnell C, Davidson S, Pachter L, Chu HC, Tonkin LA, Biggin MD, Eisen MB. 2010. Binding site turnover produces pervasive quantitative changes in transcription factor binding between closely related Drosophila species. PLoS Biol 8: e1000343. - PMC - PubMed
    1. Burz DS, Rivera-Pomar R, Jackle H, Hanes SD. 1998. Cooperative DNA-binding by Bicoid provides a mechanism for threshold-dependent gene activation in the Drosophila embryo. EMBO J 17: 5998–6009. - PMC - PubMed
    1. Chen H, Xu Z, Mei C, Yu D, Small S. 2012. A system of repressor gradients spatially organizes the boundaries of Bicoid-dependent target genes. Cell 149: 618–629. - PMC - PubMed
    1. Chen BC, Legant WR, Wang K, Shao L, Milkie DE, Davidson MW, Janetopoulos C, Wu XFS, Hammer JA, Liu Z, et al. 2014a. Lattice light-sheet microscopy: imaging molecules to embryos at high spatiotemporal resolution. Science 346: 439. - PMC - PubMed

MeSH terms