. 2018 Jan 1;124(1):40-51.
doi: 10.1152/japplphysiol.00762.2017. Epub 2017 Oct 5.

MyoVision: software for automated high-content analysis of skeletal muscle immunohistochemistry

Affiliations

MyoVision: software for automated high-content analysis of skeletal muscle immunohistochemistry

Yuan Wen et al. J Appl Physiol (1985). .

Abstract

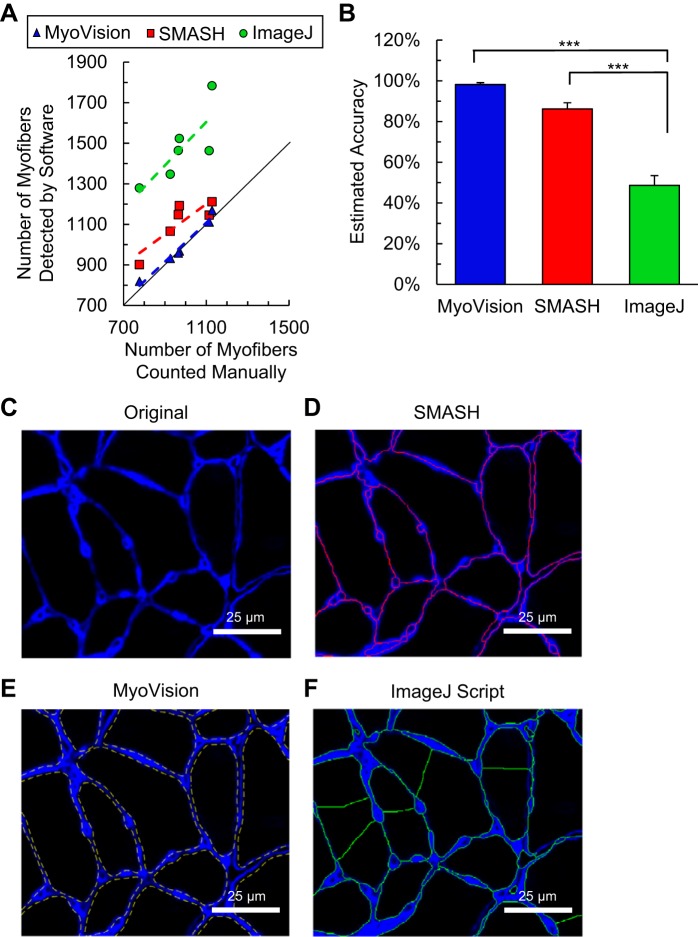
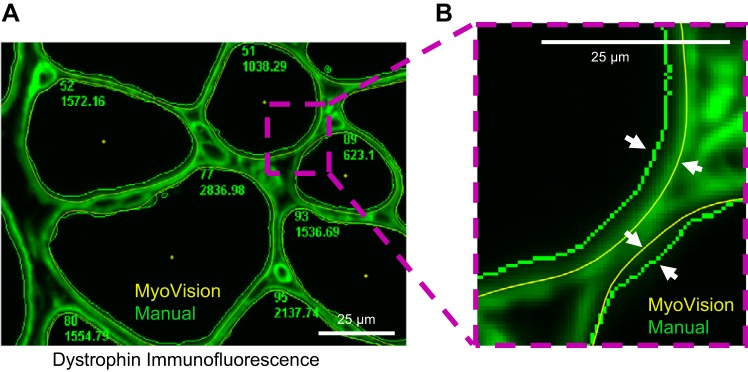
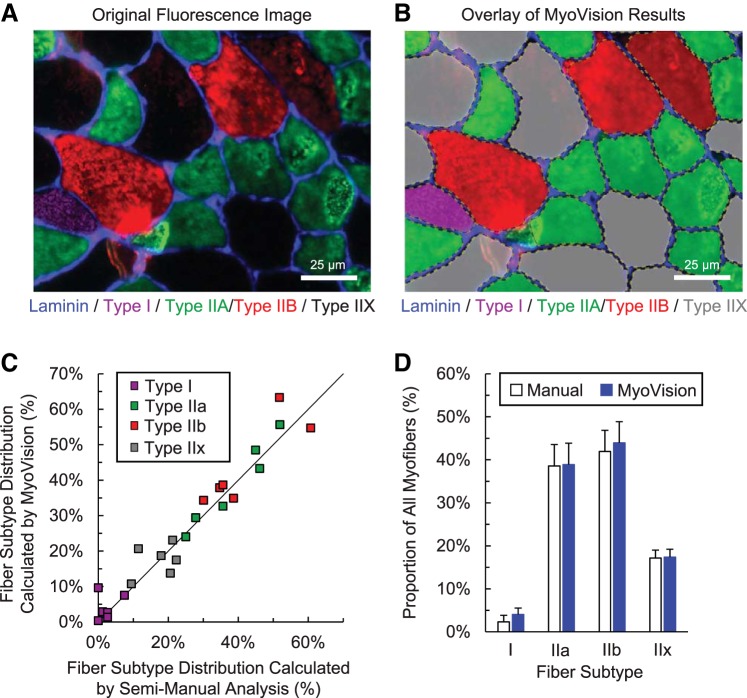
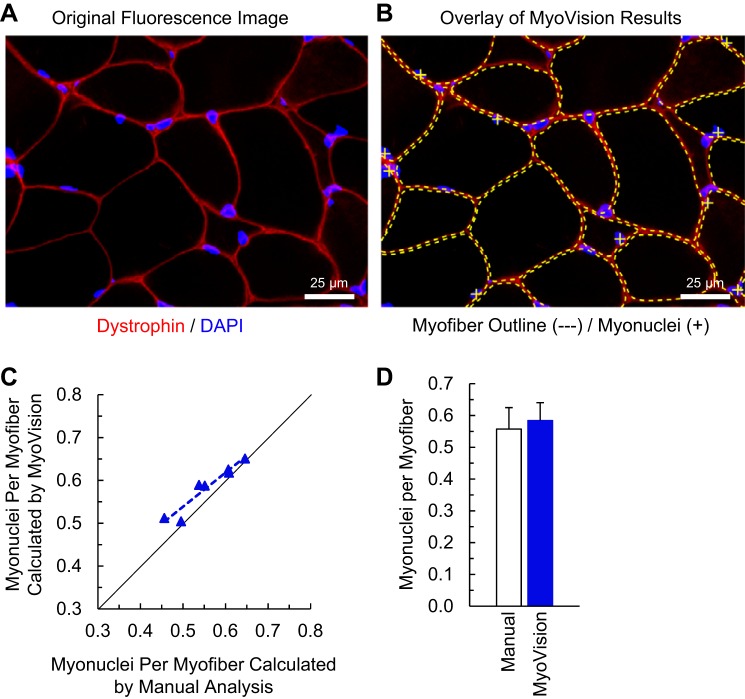
Analysis of skeletal muscle cross sections is an important experimental technique in muscle biology. Many aspects of immunohistochemistry and fluorescence microscopy can now be automated, but most image quantification techniques still require extensive human input, slowing progress and introducing the possibility of user bias. MyoVision is a new software package that was developed to overcome these limitations. The software improves upon previously reported automatic techniques and analyzes images without requiring significant human input and correction. When compared with data derived by manual quantification, MyoVision achieves an accuracy of ≥94% for basic measurements such as fiber number, fiber type distribution, fiber cross-sectional area, and myonuclear number. Scientists can download the software free from www.MyoVision.org and use it to automate the analysis of their own experimental data. This will improve the efficiency and consistency of the analysis of muscle cross sections and help to reduce the burden of routine image quantification in muscle biology. NEW & NOTEWORTHY Scientists currently analyze images of immunofluorescently labeled skeletal muscle using time-consuming techniques that require sustained human supervision. As well as being inefficient, these techniques can increase variability in studies that quantify morphological adaptations of skeletal muscle at the cellular level. MyoVision is new software that overcomes these limitations by performing high-content analysis of muscle cross sections with minimal manual input. It is open source and freely available.

Keywords: automation software; cell morphology; high-content microscopy; image analysis; skeletal muscle.


Figures

Fig. 1.
Fig. 1.
MyoVision fiber outline. A: dystrophin-labeled immunofluorescence intensity image of a mouse plantaris muscle cross section, false colored in green. B: same image as in A with MyoVision cell outline dotted in yellow. Scale bar = 25 μm.
Fig. 2.
Fig. 2.
MyoVision workflow. Major steps in the MyoVision cell detection and outlining algorithm. For detailed descriptions, please see the appendix. Steps 1 and 2: filtering to prepare for initial segmentation. Steps 3 and 4: convert the image to foreground and background and then perform morphological operations. Steps 5 and 6: calculate shape descriptors for each seed region and identify potentially connected seeds. Step 7: distance-based watershed transformation to separate the potentially connected fibers. Step 8: combine separated fibers with single fibers and generate parametric splines to prepare for contour evolution. Scale bar = 25 μm.
Fig. 3.
Fig. 3.
Empirically determined thresholds for shape descriptors. A: representative images of seed regions (red), dystrophin overlay (green), and their respective manual classifications. Shape descriptors are calculated for a total of 6,781 seed regions (520 connected, 3,939 single cells, and 2,322 interstitial spaces). B–F: shape descriptors and their respective frequency distributions (black dotted line represents the threshold selected for the MyoVision algorithm).
Fig. 4.
Fig. 4.
Fiber detection and counting. A: comparison of MyoVision (blue), SMASH (red), and ImageJ plug-in (green) with manual fiber counting for six mouse plantaris muscles. MyoVision counts lie directly on the line of identity (black). Markers above the line of identity represent over-segmentation. B: estimated accuracy of each method is expressed as percent difference from manual counts (*** denotes P < 0.001). C–F: representative images of the segmentation for each algorithm compared with the original laminin-labeled (blue) image. Significant oversegmentation (a single fiber is broken up into multiple fibers) can be readily observed for the ImageJ plug-in. Scale bar = 25 μm.
Fig. 5.
Fig. 5.
MyoVision versus semimanual outlines. A: MyoVision (yellow) and manual (green) cell outlines for the same dystrophin-labeled image. B: zoomed-in view of the region from A boxed in purple dotted line. White arrows highlight the difference between the MyoVision and the manual outlines. MyoVision outlines are closer to the dystrophin staining, therefore producing fiber CAS measurements that are consistently larger than the manual measurements (Fig. 6A). Scale bar = 25 μm.
Fig. 6.
Fig. 6.
Average fiber cross-sectional area (CSA). A: comparison of MyoVision (blue) and SMASH (red) cell size measurements with manual measurements for 16 mouse plantaris cross sections with and without mechanical overload. The line of identity is shown in black. MyoVision measurements are bigger than semimanual measurements for every sample. Dashed line denotes linear regression line. B: estimated accuracy for MyoVision and SMASH measurements of fiber CSA (***P < 0.001). C: relative increase in fiber CSA (hypertrophy) over the mechanical overload time course. SMASH demonstrates significant underestimation of fiber CSA as growth increases (* and ** denote P < 0.05 and 0.01, respectively).
Fig. 7.
Fig. 7.
Fiber-type classification. A: plantaris cross section image immunofluorescently stained for three different myosin heavy-chain subtypes and labeled for laminin. B: MyoVision outline and classification of fiber types in A. C: comparison of MyoVision fiber type distribution results with manual counts for six murine plantaris muscles. The line of identity is shown in black. D: comparison of average fiber type distribution for all mice shows no significant difference between MyoVision and manual analyses. Scale bar = 25 μm.
Fig. 8.
Fig. 8.
Myonuclear number. A: plantaris cross-section image immunofluorescently labeled with DAPI for nuclei and colabeled for dystrophin. B: MyoVision outlines (dotted yellow lines) and classification of the myonuclei (yellow plus signs) in A. C: comparison of MyoVision myonuclear counting results with human counts for six mouse plantaris muscles. The line of identity is shown in black. D: comparison of average myonuclei per fiber for all mice shows no significant difference between MyoVision and human analysis. Scale bar = 25 μm.

References

    1. Ansved T, Larsson L. Effects of denervation on enzyme-histochemical and morphometrical properties of the rat soleus muscle in relation to age. Acta Physiol Scand 139: 297–304, 1990. doi:10.1111/j.1748-1716.1990.tb08927.x. - DOI - PubMed
    1. Bagley JR, Murach KA, Trappe SW. Microgravity-induced fiber type shift in human skeletal muscle. Gravit Space Res 26: 34–40, 2012.
    1. Bergmeister KD, Gröger M, Aman M, Willensdorfer A, Manzano-Szalai K, Salminger S, Aszmann OC. Automated muscle fiber type population analysis with ImageJ of whole rat muscles using rapid myosin heavy chain immunohistochemistry. Muscle Nerve 54: 292–299, 2016. doi:10.1002/mus.25033. - DOI - PubMed
    1. Brox T, Kim Y-J, Weickert J, Feiden W. Fully-automated analysis of muscle fiber images with combined region and edge-based active contours. In: Bildverarbeitung für die Medizin 2006: Algorithmen Systeme Anwendungen Proceedings des Workshops vom 19 – 21 März 2006 in Hamburg, edited by Handels H, Ehrhardt J, Horsch A, Meinzer H-P, Tolxdorff T. Berlin: Springer, 2006, p. 86–90. doi:10.1007/3-540-32137-3_18. - DOI
    1. Bruusgaard JC, Egner IM, Larsen TK, Dupre-Aucouturier S, Desplanches D, Gundersen K. No change in myonuclear number during muscle unloading and reloading. J Appl Physiol (1985) 113: 290–296, 2012. doi:10.1152/japplphysiol.00436.2012. - DOI - PubMed

Publication types

LinkOut - more resources