. 2017 Oct;29(10):2465-2477.
doi: 10.1105/tpc.16.00865. Epub 2017 Oct 5.

CAMTA-Mediated Regulation of Salicylic Acid Immunity Pathway Genes in Arabidopsis Exposed to Low Temperature and Pathogen Infection

Affiliations

CAMTA-Mediated Regulation of Salicylic Acid Immunity Pathway Genes in Arabidopsis Exposed to Low Temperature and Pathogen Infection

Yong Sig Kim et al. Plant Cell. 2017 Oct.

Abstract

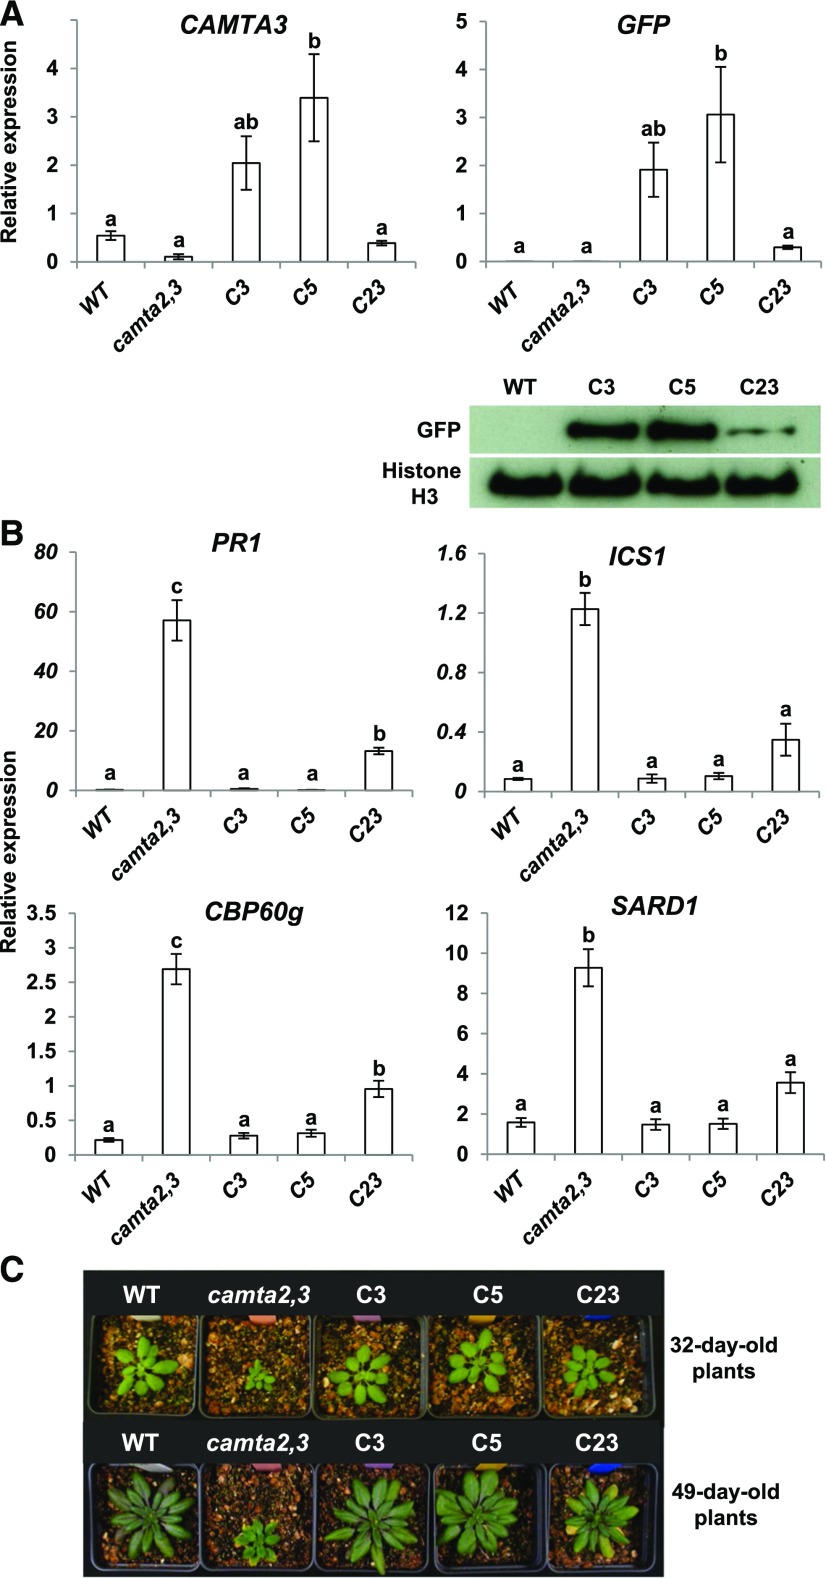
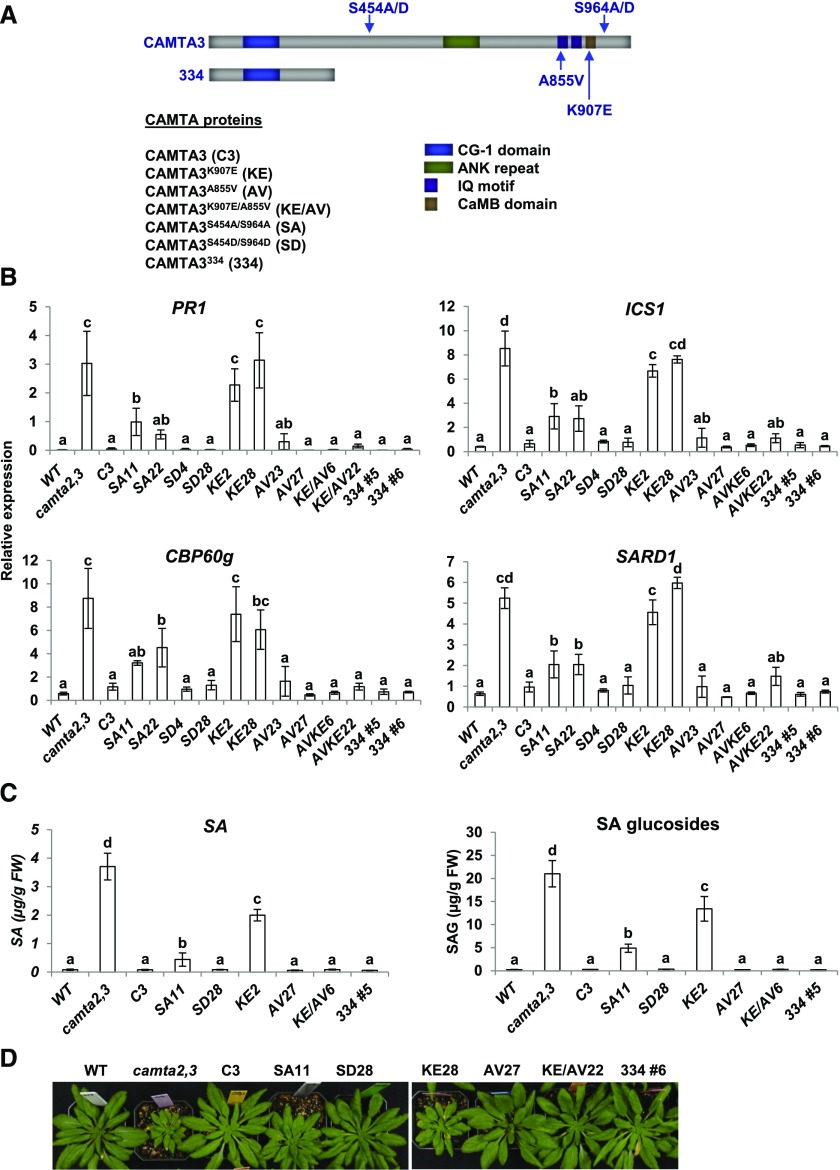
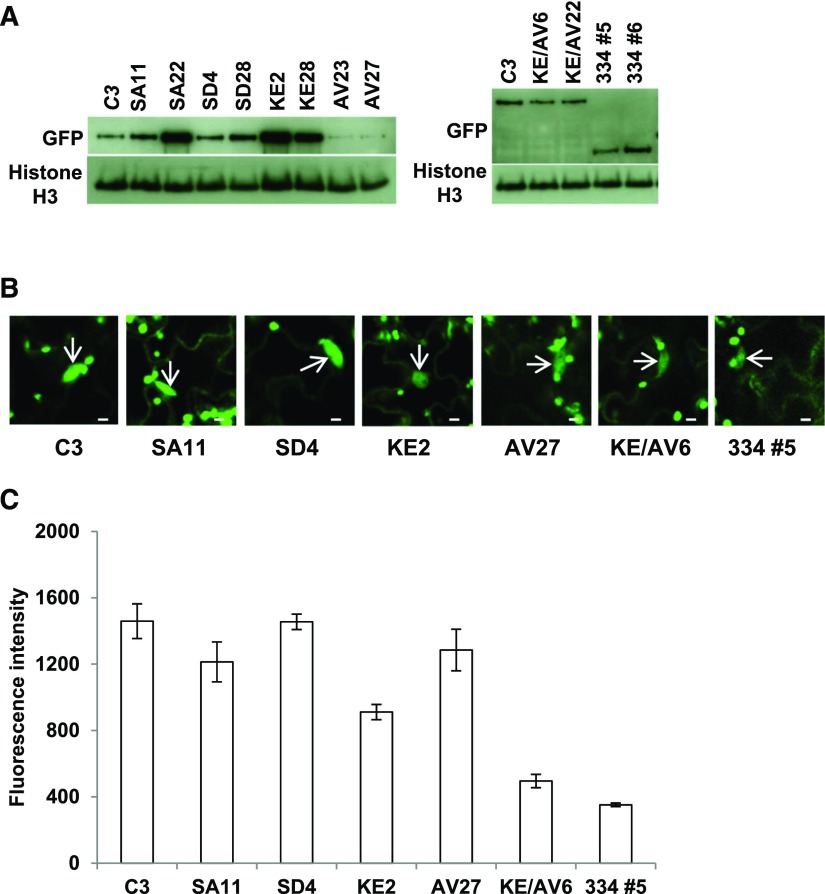
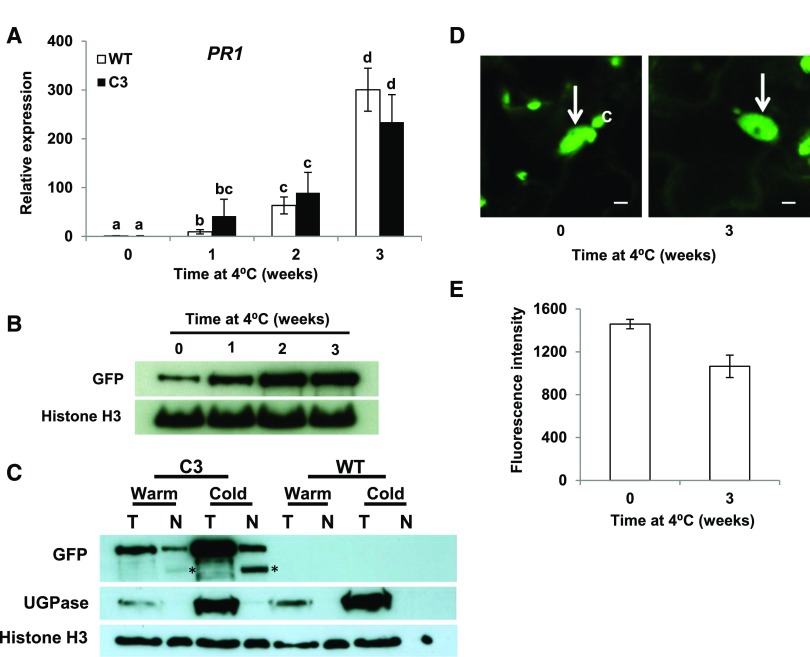
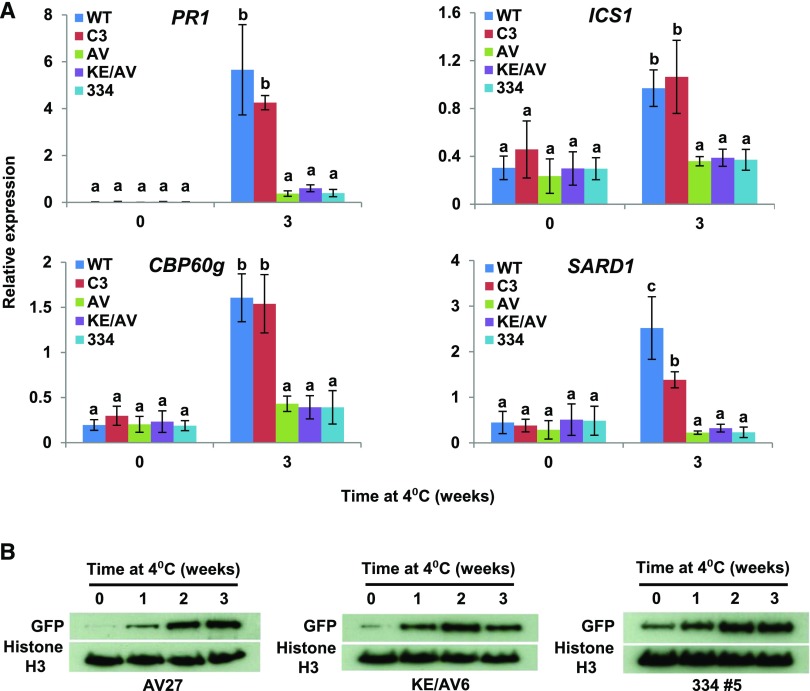
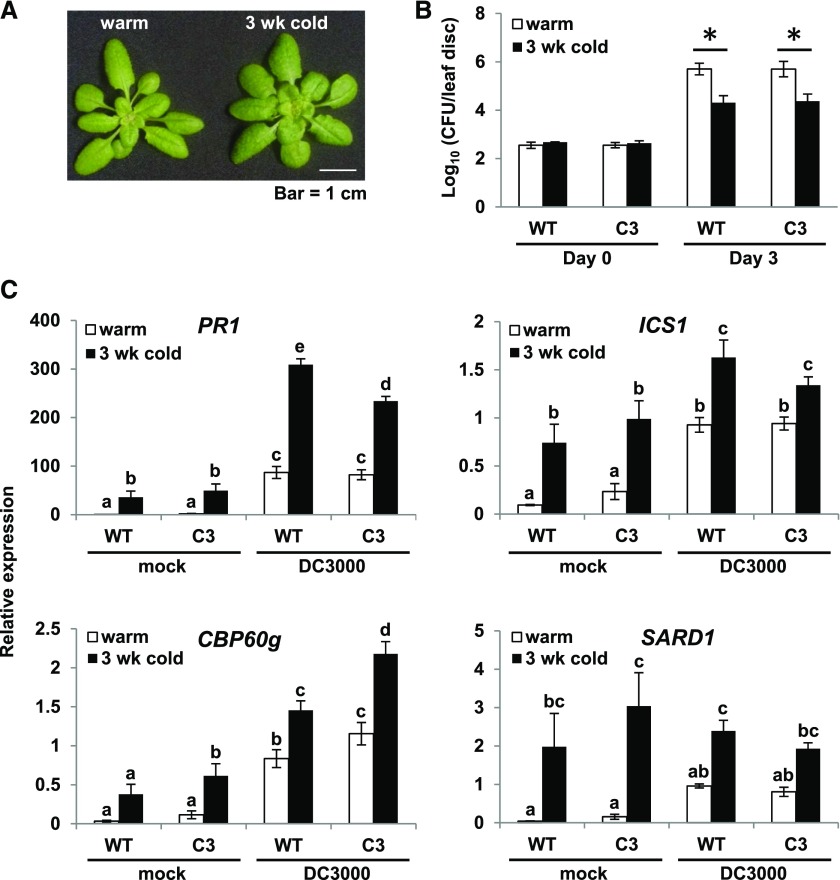
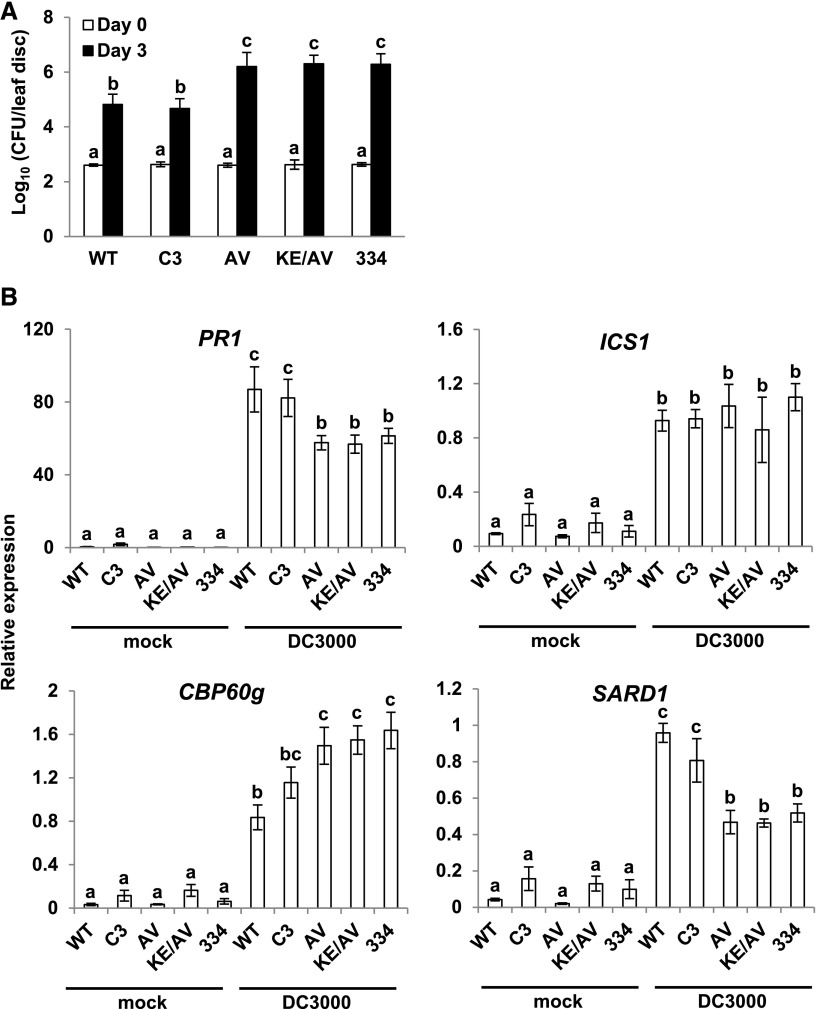
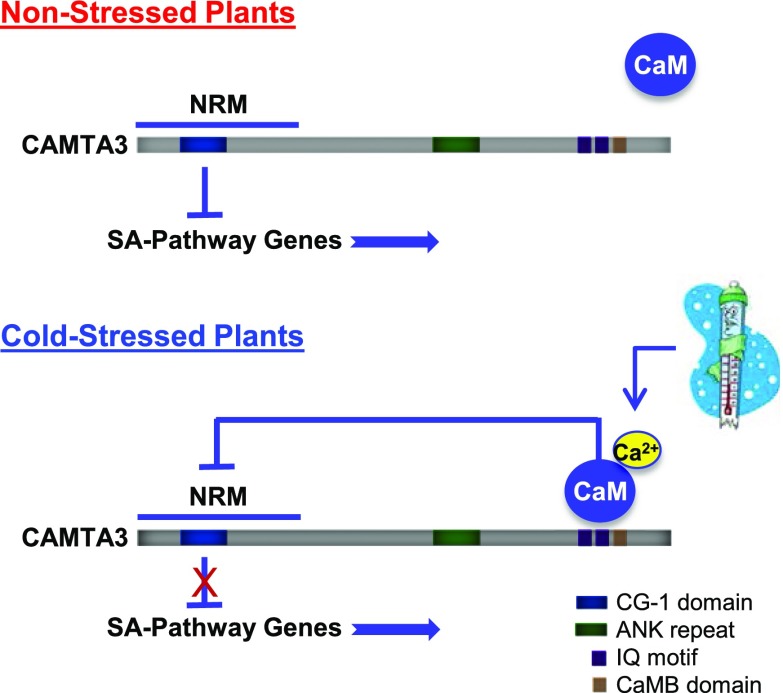
Arabidopsis thaliana calmodulin binding transcription activator (CAMTA) factors repress the expression of genes involved in salicylic acid (SA) biosynthesis and SA-mediated immunity in healthy plants grown at warm temperature (22°C). This repression is overcome in plants exposed to low temperature (4°C) for more than a week and in plants infected by biotrophic and hemibiotrophic pathogens. Here, we present evidence that CAMTA3-mediated repression of SA pathway genes in nonstressed plants involves the action of an N-terminal repression module (NRM) that acts independently of calmodulin (CaM) binding to the IQ and CaM binding (CaMB) domains, a finding that is contrary to current thinking that CAMTA3 repression activity requires binding of CaM to the CaMB domain. Induction of SA pathway genes in response to low temperature did not occur in plants expressing only the CAMTA3-NRM region of the protein. Mutational analysis provided evidence that the repression activity of the NRM was suppressed by action of the IQ and CaMB domains responding to signals generated in response to low temperature. Plants expressing the CAMTA3-NRM region were also impaired in defense against the bacterial hemibiotrophic pathogen Pseudomonas syringae pv tomato DC3000. Our results indicate that the regulation of CAMTA3 repression activity by low temperature and pathogen infection involves related mechanisms, but with distinct differences.


Figures

Figure 1.
Figure 1.
CAMTA3-GFP Represses Expression of SA Pathway Genes in camta2 camta3 Plants. (A) The CAMTA3p:CAMTA3-GFP construct was transformed into camta2 camta3 mutant plants and three transgenic lines—C3, C5, and C23—were characterized. Plants were grown for 20 d at 22°C under a 12-h photoperiod and relative transcript levels were determined by RT-qPCR. In the immunoblot analysis, anti-GFP antibody was used to detect the CAMTA3-GFP protein and antihistone H3 antibody was used to detect histone H3, which served as the loading control. Genes used for normalization for RT-qPCR are indicated in Methods, and data were subjected to ANOVA as detailed in Methods. Error bars indicate se (n = 3 biological replicates). Bars marked with different letters are significantly different (LSD, P < 0.05) (B) Transcript levels of PR1, ICS1, CBP60g, and SARD1 were determined in the transgenic lines C3, C5, and C23 grown under the same conditions as in (A). Data were subjected to ANOVA as detailed in Methods. Error bars indicate se (n = 3 biological replicates). Bars marked with different letters are significantly different (LSD, P < 0.05) (C) Photographs of wild-type, camta2 camta3, and transgenic plants after growth for 32 and 49 d at 22°C under a 12-h photoperiod.
Figure 2.
Figure 2.
Repression of SA Pathway Genes, SA Biosynthesis, and Small Stature Phenotype of camta2 camta3 Plants Expressing CAMTA3 Protein Variants. (A) Diagram of CAMTA3 protein variants. (B) Transcript levels of SA pathway genes in transgenic lines expressing CAMTA3 variant proteins in camta2 camta3 plants. Plants were grown at 22°C for 21 d under a 12-h photoperiod and harvested at the end of the light period (ZT12). Transcript levels were determined by RT-qPCR. Genes used for normalization are indicated in Methods. Data were subjected to ANOVA as detailed in Methods. Error bars indicate se (n = 3 biological replicates). Bars marked with different letters are significantly different (LSD, P < 0.05) (C) Levels of SA and SA glucosides in transgenic lines expressing CAMTA3 variants in camta2 camta3 plants. Plants were grown for 28 d at 22°C under a 12-h photoperiod and harvested 3 to 4 h after the start of the light period. Two biological replicates were tested and the values for one experiment are shown. Data were square root transformed to reduce heteroscedasticity and analyzed by ANOVA. Error bars indicate sd (n = 4 technical replicates). Bars marked with different letters are significantly different (LSD, P < 0.05). Values shown in the figure are untransformed for clarity. (D) Photographs of wild-type and camta2 camta3 plants expressing the CAMTA3 variants. Plants were grown for 42 d under a 12-h photoperiod at 22°C.
Figure 3.
Figure 3.
CAMTA3 Variant Proteins Are Present in the Nucleus. (A) Protein levels for CAMTA3 protein variants. Plants were grown under a 12-h photoperiod at 22°C for 21 d, and protein levels for the CAMTA3 variant proteins were determined by immunoblot analysis using anti-GFP antibody. Histone H3 served as the loading control. (B) Confocal optical sections of leaves from camta2 camta3 plants expressing variant CAMTA3 proteins. Plants were grown in soil at 22°C under a 12-h photoperiod for 21 d. The arrows indicate nuclei. Bars = 5 µm. (C) Quantification of GFP fluorescence in individual nuclei from separate cells. The fluorescence intensity was measured in the nuclei using a fixed region of interest (ROI) as described in Methods. Error bars indicate se; n = 20 to 73 nuclei per sample.
Figure 4.
Figure 4.
Induction of PR1 in Plants Exposed to Low Temperature Does Not Involve Degradation of CAMTA3 or Exclusion of CAMTA3 from the Nucleus. (A) Expression of PR1 in plants exposed to low temperature. wild-type and C3 transgenic plants were grown at 22°C under a 12-h photoperiod and transferred to 4°C for the indicated times. Relative transcript levels of PR1 were determined by RT-qPCR. Data were subjected to ANOVA as detailed in Methods. Error bars indicate se (n = 3 biological replicates). Bars marked with different letters are significantly different (LSD, P < 0.05). (B) CAMTA3-GFP levels in the C3 transgenic line. Protein levels were determined by immunoblot analysis using anti-GFP antibody. Histone H3 served as the loading control. Plants were grown as in (A). (C) CAMTA3-GFP levels in total (T) and nuclear (N) protein preparations in C3 and wild-type plants grown at warm (warm) temperature or grown at warm temperature and cold-treated (cold) for 3 weeks at 4°C. Approximately equal amounts of nuclear protein were run in each lane, indicated by amounts of histone H3. UGPase antibody was used to detect the cytoplasmic protein maker, UDP-glucose pyrophosphorylase. The bands marked with an asterisk are degradation product of CAMTA3-GFP (see text). (D) Confocal optical sections from leaves of the C3 transgenic line showing CAMTA3-GFP present in the nucleus (arrow). Chloroplasts (C) also appear green due to chlorophyll autofluorescence. Plants were grown as in (A). Bars = 5 µm. (E) Quantification of CAMTA3-GFP fluorescence intensity of nuclei. Fluorescence intensity of individual nuclei from separate cells was measured using a fixed ROI as described in Methods. Error bars indicate se: n = 36 (0 weeks) and 51 (3 weeks) nuclei.
Figure 5.
Figure 5.
CAMTA3334, CAMTA3A855V, and CAMTA3K907E/A855V Repress Expression of SA Pathway Genes in camta2 camta3 Plants Exposed to Low Temperature for a Prolonged Period. (A) Expression of SA pathway genes in camta2 camta3 plants expressing CAMTA3 variant proteins. Plants were grown at 22°C under a 12-h photoperiod followed by exposure to 4°C for the indicated times. Transcript levels were determined by RT-qPCR. Genes used for normalization are indicated in the Methods. Data were subjected to ANOVA as detailed in Methods. Error bars indicate se (n = 3 biological replicates). Bars marked with different letters are significantly different (LSD, P < 0.05). Transgenic lines used were AV27, KE/AV6, and 334 #5. (B) Protein levels of CAMTA3A855V, CAMTA3K907E/A855V, and CAMTA3334 in camta2 camta3 plants exposed to low temperature (4°C) for the indicated times. Protein levels were detected by immunoblot analysis using anti-GFP antibody. Histone H3 was used as a loading control.
Figure 6.
Figure 6.
Prolonged Exposure to Low Temperature Results in an Increase in Immunity against Pst DC3000. (A) Photograph of wild-type plants grown at either 22°C for 4 weeks (warm) or grown at 22°C for 4 weeks followed by 3 weeks at 4°C (3 wk cold). (B) Wild-type and C3 transgenic plants that had been grown at 22°C for 4 weeks (warm) or grown at 22°C for 4 weeks followed by 3 weeks at 4°C (3 wk cold) were inoculated with Pst DC3000 (OD600 = 0.0001). Bacterial growth was measured at 0 and 3 d postinoculation as described in Methods. Three biological replicates were performed; the figure shows a representative experiment. Error bars indicate sd (n = 4 [day 0] and n = 8 [day 3] technical replicates). An asterisk indicates a difference between warm and cold-treated plants (P < 0.05, Student’s t test). (C) Wild-type and C3 transgenic plants that had been grown at 22°C for 4 weeks (warm) or at 22°C for 4 weeks followed by 3 weeks at 4°C (3 wk cold) were inoculated with Pst DC3000 (DC3000) (OD600 = 0. 001) or treated with 10 mM MgCl2 (mock). Leaf tissue was collected at 24 h postinoculation. Transcript levels were determined by RT-qPCR as detailed in Methods. Data were subjected to ANOVA as described in Methods. Error bars indicate se (n = 3 biological replicates). Bars marked with different letters are significantly different (LSD, P < 0.05). Transgenic lines AV27, KE/AV6, and 334 #5 were used in the experiments.
Figure 7.
Figure 7.
Plants Expressing CAMTA3334, CAMTA3A855V, or CAMTA3K907E/A855V Are Impaired in Immunity against Pst DC3000. (A) Plants that had been grown at 22°C for 4 weeks were inoculated with Pst DC3000 (OD600 = 0.0001) and bacterial growth was measured at 0 and 3 d postinoculation as described in Methods. Transgenic lines AV27, KE/AV6, and 334 #5 were used in the experiments. Three biological replicates were performed yielding similar results; the results from a representative experiment are shown. Error bars indicate sd (n = 4 [day 0] and n = 8 [day 3] technical replicates). Statistical significance of pathogen growth among the different genotypes was determined using one-way ANOVA and Tukey HSD test when statistical significance was found. Means with the same letter were not significantly different, LSD P < 0.01. (B) Wild-type and camta2 camta3 mutant plants expressing the indicated CAMTA3 variants that had been grown at 22°C for 4 weeks were inoculated with Pst DC3000 (DC3000) (OD600 = 0. 001). Leaf tissue was collected at 24 h postinoculation. Transcript levels of the indicated genes were determined by RT-qPCR. Data were subjected to ANOVA as described in Methods. Error bars indicate se (n = 3 biological replicates). Bars marked with different letters are significantly different (LSD, P < 0.05). Transgenic lines AV27, KE/AV6, and 334 #5 were used in the experiments.
Figure 8.
Figure 8.
Model for CAMTA3 Regulation of SA Pathway Genes in Nonstressed and Cold-Stressed Plants. In nonstressed plants, CAMTA3 binds to the promoters of certain SA pathway genes and represses their transcription through action of the NRM region of the protein. When plants are exposed to low temperature for more than a week, a calcium signature is generated that promotes binding of CaM to the IQ and/or CaMB domain. The binding of CaM causes a change in protein conformation or charge that blocks the repression activity of the NRM through intraprotein interactions. The loss of NRM repression activity allows the target genes to be transcribed resulting in activation of the SA pathway. See Discussion for details.

References

    1. Bouché N., Scharlat A., Snedden W., Bouchez D., Fromm H. (2002). A novel family of calmodulin-binding transcription activators in multicellular organisms. J. Biol. Chem. 277: 21851–21861. - PubMed
    1. Choi M.S., et al. (2005). Isolation of a calmodulin-binding transcription factor from rice (Oryza sativa L.). J. Biol. Chem. 280: 40820–40831. - PubMed
    1. Clough S.J., Bent A.F. (1998). Floral dip: a simplified method for Agrobacterium-mediated transformation of Arabidopsis thaliana. Plant J. 16: 735–743. - PubMed
    1. de Jonge J., Hofius D., Hennig L. (2017). Salicylic acid interferes with GFP fluorescence in vivo. J. Exp. Bot. 68: 1689–1696. - PMC - PubMed
    1. Dempsey D.A., Vlot A.C., Wildermuth M.C., Klessig D.F. (2011). Salicylic acid biosynthesis and metabolism. Arabidopsis Book 9: e0156. - PMC - PubMed

MeSH terms

LinkOut - more resources