. 2017 Nov 6;214(11):3239-3261.
doi: 10.1084/jem.20162123. Epub 2017 Oct 5.

Role of HIV-specific CD8+ T cells in pediatric HIV cure strategies after widespread early viral escape

Affiliations

Role of HIV-specific CD8+ T cells in pediatric HIV cure strategies after widespread early viral escape

Ellen M Leitman et al. J Exp Med. .

Abstract

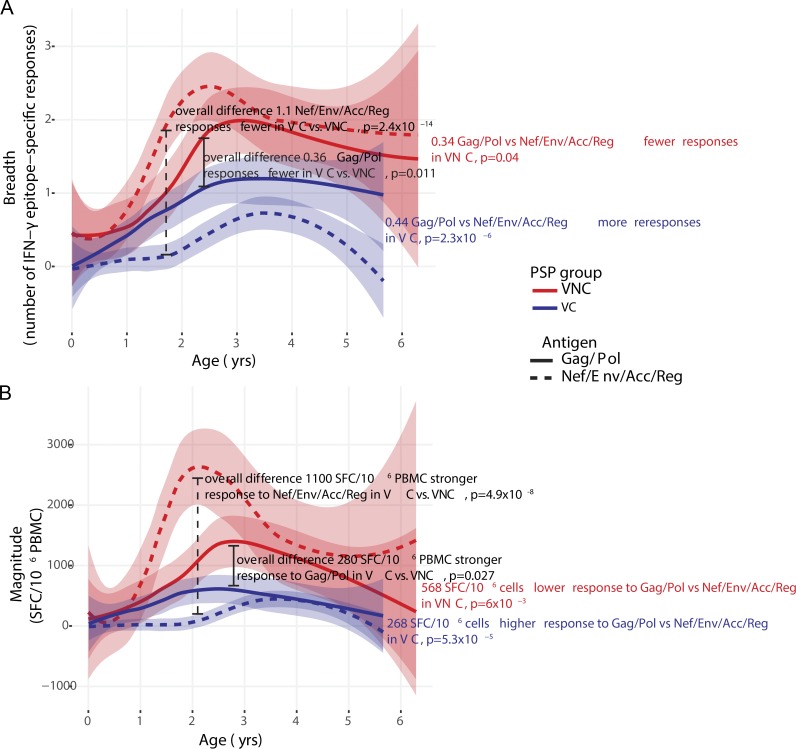
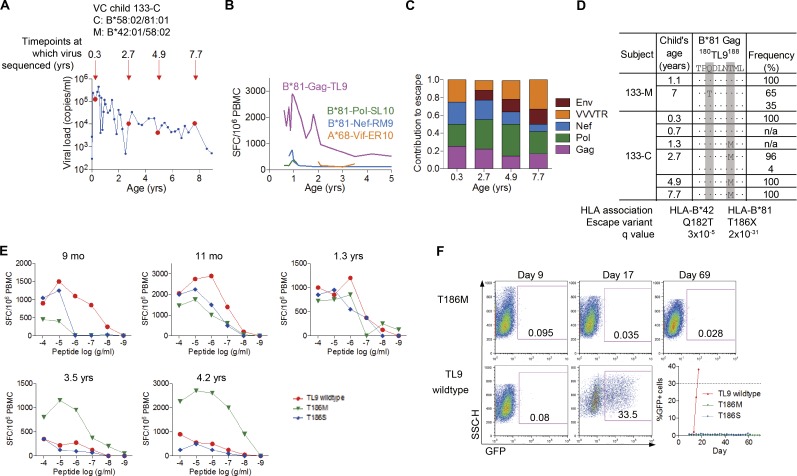
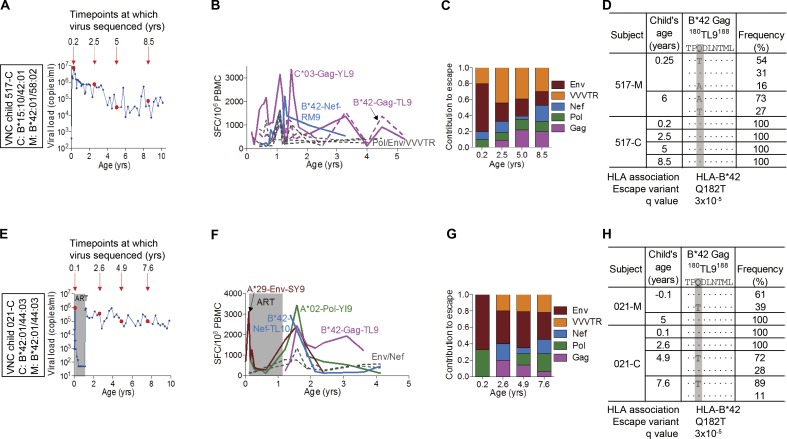
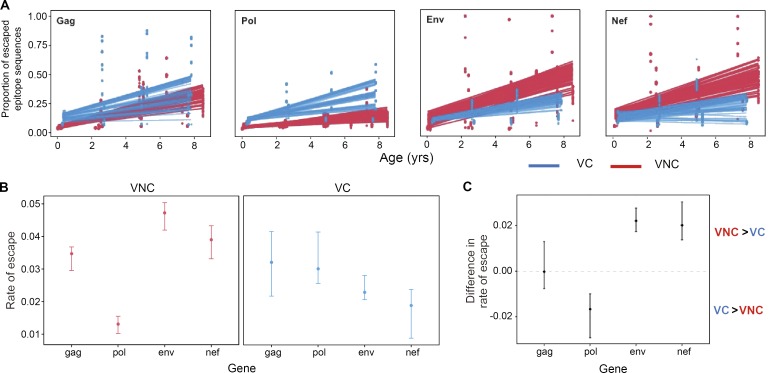
Recent studies have suggested greater HIV cure potential among infected children than adults. A major obstacle to HIV eradication in adults is that the viral reservoir is largely comprised of HIV-specific cytotoxic T lymphocyte (CTL) escape variants. We here evaluate the potential for CTL in HIV-infected slow-progressor children to play an effective role in "shock-and-kill" cure strategies. Two distinct subgroups of children were identified on the basis of viral load. Unexpectedly, in both groups, as in adults, HIV-specific CTL drove the selection of escape variants across a range of epitopes within the first weeks of infection. However, in HIV-infected children, but not adults, de novo autologous variant-specific CTL responses were generated, enabling the pediatric immune system to "corner" the virus. Thus, even when escape variants are selected in early infection, the capacity in children to generate variant-specific anti-HIV CTL responses maintains the potential for CTL to contribute to effective shock-and-kill cure strategies in pediatric HIV infection.


Figures

Figure 1.
Figure 1.
Slow-progressor children categorized according to viremia into VC and VNC groups. (A) Viral loads for the 11 PSPs in the first decade of life for all time points off ART. (B and C) Absolute CD4 counts and CD4% for the 11 PSPs for all time points off ART. Each individual is shown in a unique symbol and linking line, colored according to VC (blue) or VNC (red) grouping. An estimate of best fit (LOWESS lines) is shown for each PSP group in a thick solid line and the corresponding 95% confidence interval is denoted by the blue or red shaded area. Likelihood-ratio test p-values are from linear mixed-effects modeling comparing PSP groups and take into account all time points.
Figure 2.
Figure 2.
Breadth and magnitude of HIV-specific IFN-γ ELISPOT responses among PSPs grouped according to antigen. (A) Breadth. (B) Magnitude. The magnitude of differences between five VC and six VNC children is shown in black text, and estimates of annual change shown in blue and red text, respectively. RTVVV, Rev/Tat/Vif/Vpu/Vpr/Tat/Rev. An estimate of best fit (LOWESS lines) is shown for each PSP group in a thick solid line, and the corresponding 95% confidence interval is denoted by the blue or red shaded area. P-values were determined by linear mixed-effects modeling that take into account all time points. Each ELISPOT measurement is the sum of two to three technical replicates, depending on cell availability.
Figure 3.
Figure 3.
Gag/Pol versus Nef/Env/Accessory-Regulatory protein-specific IFN-γ ELISPOT responses in VC compared with VNC children. (A) Breadth. (B) Magnitude. Magnitude of differences between five VC and six VNC children is as shown on each panel, in black text. Magnitude of differences between Gag/Pol and Nef/Env/Acc/Reg targeted responses is shown in red (VNC) or blue (VC) bold text. An estimate of best fit (LOWESS lines) is shown for each PSP group and antigen group in a thick solid line (Gag/Pol) or thick dotted line (Nef/Env/Acc/Reg). Corresponding 95% confidence intervals for best fit lines are denoted by the blue or red shaded areas. For each of the 11 individuals the sum of the breadth, or magnitude of responses to the combination of antigens (Gag/Pol or Nef/Env/Acc/Reg) was calculated at each time point, and p-values were determined by linear mixed-effects modeling that take into account all time points. SFC, spot-forming cell.
Figure 4.
Figure 4.
Escape in the immunodominant Gag-TL9 epitope develops in the first months of life in the VC child 133-C. (A) Virological profile of the child 133-C with deep-sequenced time points indicated by large circles and child’s age (years) indicated above the arrows. (B) ELISPOT CD8+ T cell responses in the VC child 133-C. (C) Contribution of different HIV proteins to HLA-associated escape across HIV proteome. VVVTR, Vif/Vpr/Vpu/Tat/Rev in 133-C. (D) Development of escape in Gag-TL9 epitope in the child 133-C. Q-values as per Carlson et al. (2012) and Carlson et al. (2014). (E) CD8+ T cell response to the Gag-TL9 wild-type epitope and its variants at five different time points in the child133-C. Responses were determined by IFN-γ ELISPOT assay. Assays repeated in triplicate. (F) Growth of viruses encoding TL9 wild-type and mutants T186M and T186S. Dotted line in the plot with viral growth curves indicates the threshold of 30% cells being infected at which time virus should be harvested. Each virus grown in triplicate; confirmed in two independent experiments. SFC, spot-forming cell.
Figure 5.
Figure 5.
Selection pressure in Gag-TL9 epitope in the VNC children 517-C and 021-C. (A and E) Virological profiles of the children 517-C (A) and 021-C (E) with deep-sequenced time points indicated by large circles and child’s age (years) indicated above the arrows. (B and F) ELISPOT CD8+ T cell responses of the children 517-C (B) and 021-C (F). Assays repeated in triplicate. (C and G) Contribution of different HIV proteins to HLA-associated escape across HIV proteome in the children 517-C (C) and 021-C (G). VVVTR, Vif/Vpr/Vpu/Tat/Rev. (D and H) Sequences of the Gag-TL9 epitope in the first decade of life in 517-C (D) and 021-C (H). Q-values as per Carlson et al. (2012) and Carlson et al. (2014).
Figure 6.
Figure 6.
Preferential recognition of autologous TL9 variants by HIV-infected children compared with adults. (A) Development of preferential recognition of autologous TL9-Q182G variant by pediatric subject K-004-C between age 8.2 yr, at which time autologous virus encoded a mix of Q182P/Q182G variants, and 12.8 yr, at which time autologous virus encoded only the Q182G variant, by population sequencing of virus. HLA type and autologous sequence of the mother K-004-M are unknown. ELISPOT assays repeated in triplicate. (B) Development of preferential recognition of autologous TL9-Q182G variant by pediatric subject K-044-C between age 4.5 yr, at which time autologous virus encoded a mix of Q182P/Q182T variants, and 8.7 yr, at which time autologous virus encoded only the Q182G variant, by population sequencing of virus. The mother (K-044-M) was HLA-B*42:01/81:01 negative and autologous virus when sequenced at child’s age 4.5 yr encoded wild-type TL9, suggesting that wild-type TL9 was transmitted to the child. ELISPOT assays repeated in triplicate. (C) The magnitude of the IFN-g ELISPOT response to wild-type TL9 is lower than to the autologous variant among children (n = 11; mean 531 vs. 1,010 spot-forming cells per million PBMCs; P = 0.02, paired t test; P = 0.002, Wilcoxon signed-rank test). Among adults, the IFN-γ ELISPOT response to wild-type TL9 tended to be higher than to the autologous TL9 variant, although this did not reach statistical significance (n = 16; median 1,597 vs, 882 spot-forming cells per million PBMCs; P = 0.25, paired t test; P = 0.40, Wilcoxon signed-rank test). (D) Frequency of subjects showing preferential recognition of autologous variant is significantly higher in pediatric subjects than adult subjects (10/11 = 91%; vs. 5/16 = 31%; P = 0.0047, Fisher’s exact test). SFC, spot-forming cell.
Figure 7.
Figure 7.
Differential patterns of CD8+ T cell–mediated escape in VC versus VNC children. (A) Mean proportion of escaped variants over time in CD8+ T cell-restricted epitopes in gag, pol, env, and nef for the VNC and VC children. The points represent the proportion of escaped variants at a particular CD8+ T cell–restricted epitope from 50 bootstrapped replicates of the patients’ sequence data. The lines show the bootstrap distribution of regression lines of the mean rate of escape variants accumulated over time for each gene in VNC and VC children. (B) Rate of escape across genes in VNC and VC children: the error bars depict the interquartile range of the mean rate of escaped variants accumulated in the CD8+ T cell-restricted epitopes over time for VNC and VC children. The points represent the median, whereas the top and bottom edges represent the upper and lower quartiles. This was estimated from the slopes of the linear regression model based for each bootstrap replicate (n = 50). In VNC children, the rate of escape in env and nef is significantly greater than in pol and to lesser extent than in gag. Conversely, the opposite pattern is observed in VC children, where the rate of escape is significantly greater in gag and pol than in env and nef. (C) Difference in the rate of escaped variants accumulating in the different gene regions over time in VNC and VC children. This was estimated by calculating the difference in the slopes of the linear regression for VNC and VC children for each bootstrap replicate (n = 50). The interquartile range of this statistic is plotted to indicate that VNC children have greater accumulation of escaped variants in env and nef and lower accumulation of escaped variants in pol than VC children. There is statistically no difference in the rate of escape in gag-specific restricted CD8+ T cell epitopes. (A–C) Linear regression model.

References

    1. Addo M.M., Yu X.G., Rathod A., Cohen D., Eldridge R.L., Strick D., Johnston M.N., Corcoran C., Wurcel A.G., Fitzpatrick C.A., et al. . 2003. Comprehensive epitope analysis of human immunodeficiency virus type 1 (HIV-1)-specific T-cell responses directed against the entire expressed HIV-1 genome demonstrate broadly directed responses, but no correlation to viral load. J. Virol. 77:2081–2092. 10.1128/JVI.77.3.2081-2092.2003 - DOI - PMC - PubMed
    1. Adland E., Paioni P., Thobakgale C., Laker L., Mori L., Muenchhoff M., Csala A., Clapson M., Flynn J., Novelli V., et al. . 2015. Discordant Impact of HLA on Viral Replicative Capacity and Disease Progression in Pediatric and Adult HIV Infection. PLoS Pathog. 11:e1004954 10.1371/journal.ppat.1004954 - DOI - PMC - PubMed
    1. Allen T.M., and Altfeld M.. 2008. Crippling HIV one mutation at a time. J. Exp. Med. 205:1003–1007. 10.1084/jem.20080569 - DOI - PMC - PubMed
    1. Allen T.M., Yu X.G., Kalife E.T., Reyor L.L., Lichterfeld M., John M., Cheng M., Allgaier R.L., Mui S., Frahm N., et al. . 2005. De novo generation of escape variant-specific CD8+ T-cell responses following cytotoxic T-lymphocyte escape in chronic human immunodeficiency virus type 1 infection. J. Virol. 79:12952–12960. 10.1128/JVI.79.20.12952-12960.2005 - DOI - PMC - PubMed
    1. Almeida J.R., Price D.A., Papagno L., Arkoub Z.A., Sauce D., Bornstein E., Asher T.E., Samri A., Schnuriger A., Theodorou I., et al. . 2007. Superior control of HIV-1 replication by CD8+ T cells is reflected by their avidity, polyfunctionality, and clonal turnover. J. Exp. Med. 204:2473–2485. 10.1084/jem.20070784 - DOI - PMC - PubMed

MeSH terms

Substances

Associated data