. 2017 Oct 5;7(1):12702.
doi: 10.1038/s41598-017-12973-5.

The GBAP1 pseudogene acts as a ceRNA for the glucocerebrosidase gene GBA by sponging miR-22-3p

Affiliations

The GBAP1 pseudogene acts as a ceRNA for the glucocerebrosidase gene GBA by sponging miR-22-3p

Letizia Straniero et al. Sci Rep. .

Abstract

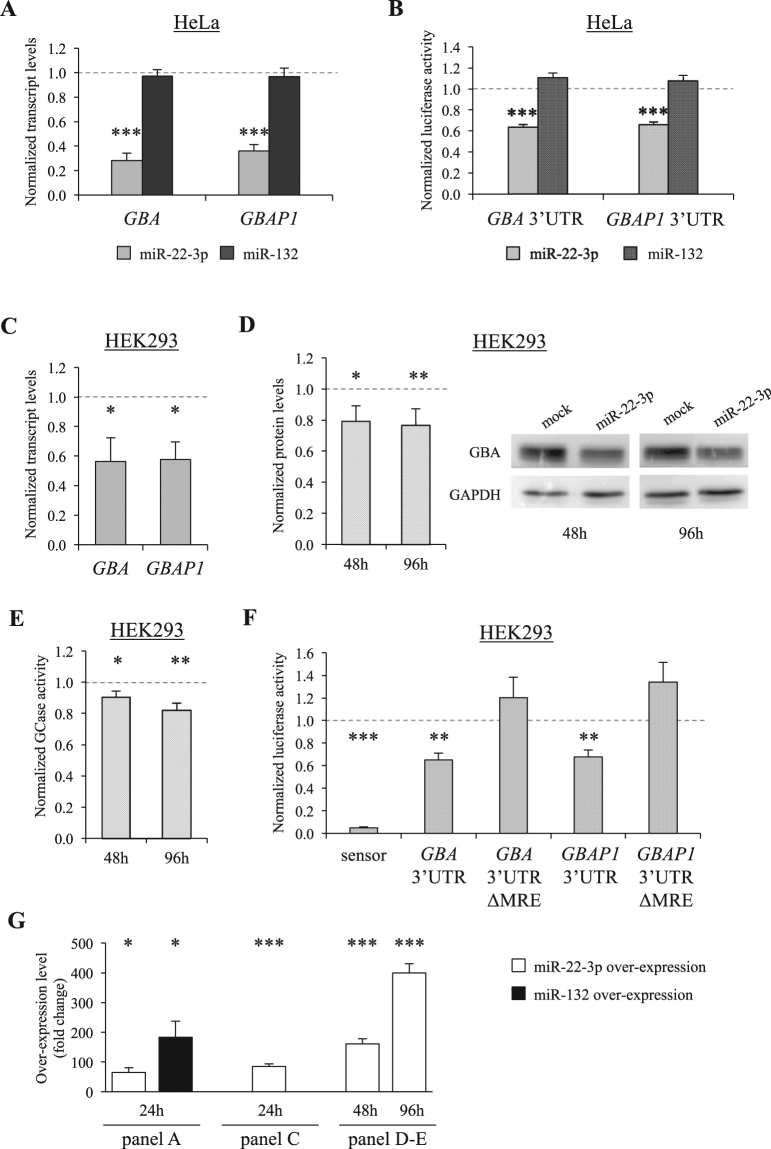
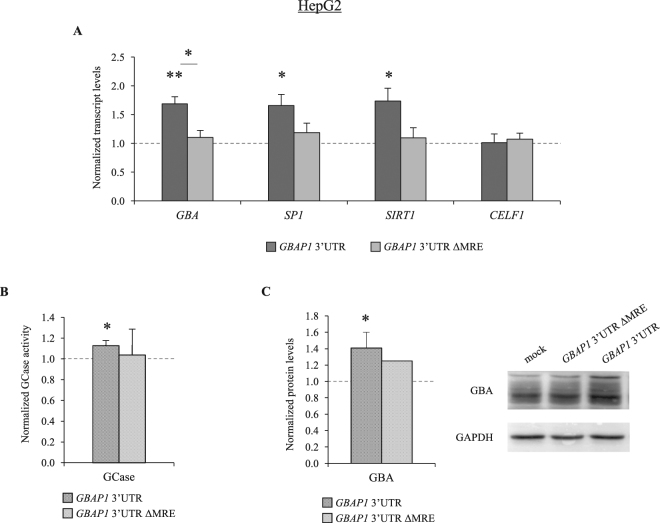
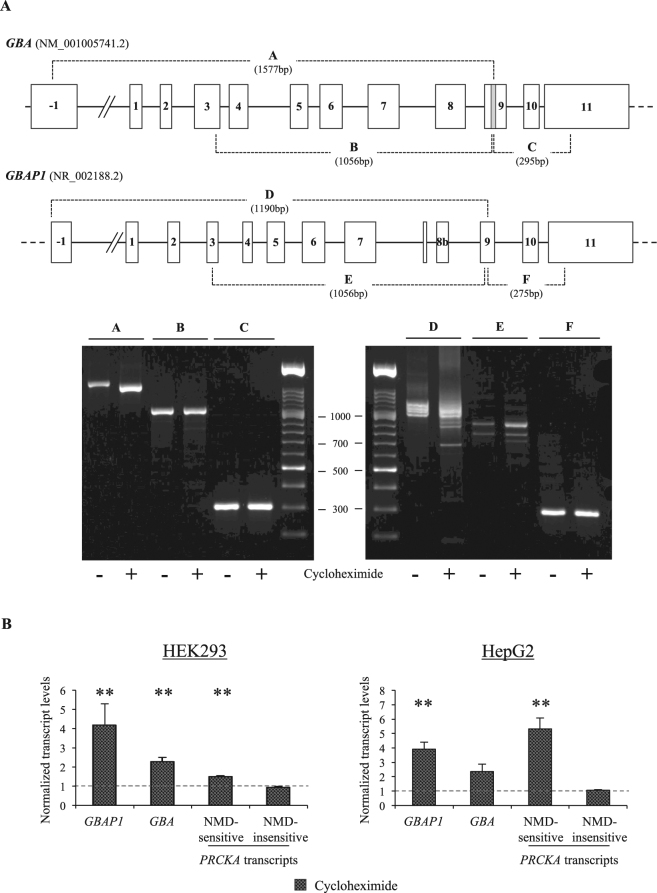
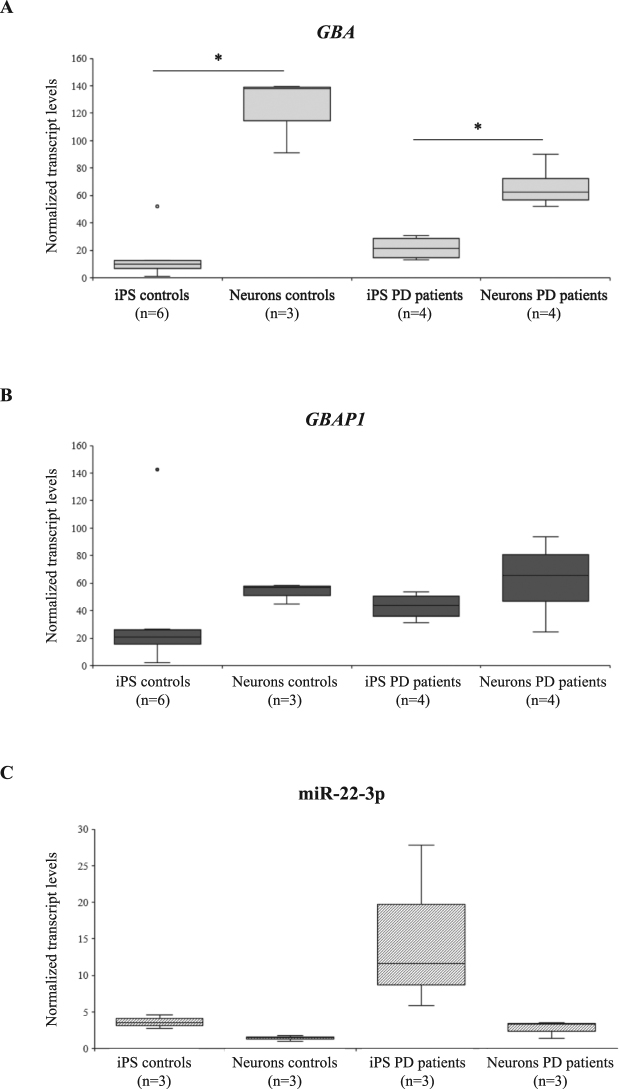
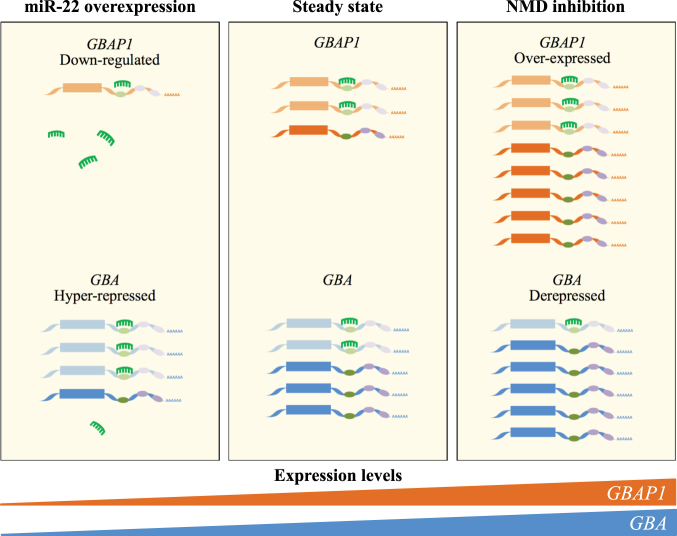
Mutations in the GBA gene, encoding lysosomal glucocerebrosidase, represent the major predisposing factor for Parkinson's disease (PD), and modulation of the glucocerebrosidase activity is an emerging PD therapy. However, little is known about mechanisms regulating GBA expression. We explored the existence of a regulatory network involving GBA, its expressed pseudogene GBAP1, and microRNAs. The high level of sequence identity between GBA and GBAP1 makes the pseudogene a promising competing-endogenous RNA (ceRNA), functioning as a microRNA sponge. After selecting microRNAs potentially targeting both transcripts, we demonstrated that miR-22-3p binds to and down-regulates GBA and GBAP1, and decreases their endogenous mRNA levels up to 70%. Moreover, over-expression of GBAP1 3'-untranslated region was able to sequester miR-22-3p, thus increasing GBA mRNA and glucocerebrosidase levels. The characterization of GBAP1 splicing identified multiple out-of-frame isoforms down-regulated by the nonsense-mediated mRNA decay, suggesting that GBAP1 levels and, accordingly, its ceRNA effect, are significantly modulated by this degradation process. Using skin-derived induced pluripotent stem cells of PD patients with GBA mutations and controls, we observed a significant GBA up-regulation during dopaminergic differentiation, paralleled by down-regulation of miR-22-3p. Our results describe the first microRNA controlling GBA and suggest that the GBAP1 non-coding RNA functions as a GBA ceRNA.


Conflict of interest statement

The authors declare that they have no competing interests.

Figures

Figure 1
Figure 1
MiR-22-3p targets GBA and GBAP1. (A) Endogenous expression levels of GBA and GBAP1 after pre-miR-22-3p or pre-miR-132 over-expression in HeLa cells. Cells were collected 24 hours after transfection and total RNA extracted. Expression levels, measured by real-time RT-PCRs, are shown as normalized rescaled values, setting as 1 the value measured in cell transfected with an empty vector (psiUX, mock). (B) Luciferase reporter assays of GBA or the GBAP1 3′UTR after pre-miR-22-3p or pre-miR-132 over-expression in HeLa cells. 48 hours after transfection, cells were collected and protein lysates prepared for reporter assays. Renilla luciferase activity was normalized against the firefly luciferase activity, setting as 1 the value measured in cells cotransfected with an empty vector (psiCHECK2, no miRNA overexpression). (CE) Effect of pre-miR-22-3p over-expression in HEK293 cells. Panel C shows the effect on the endogenous GBA and GBAP1 transcripts, measured by real-time RT-PCR 24 hours after transfection. Panel D shows the reduction of GBA protein, as assessed by Western blot analysis, 48 or 96 hours after transfection. A representative blot (right) and the densitometric analysis of three independent experiments (left) are shown. Panel E reports the effect on the endogenous GBA-specific GCase activity. In all cases, the value measured in cells cotransfected with an empty vector (psiUX, no miRNA over-expression) was set as 1. (F) Luciferase reporter assays of GBA or GBAP1 3′UTRs, with or without the putative miRNA recognition element (ΔMRE), after miR-22-3p over-expression in HEK293 cells. Cells were collected 48 hours after transfection and lysates prepared for reporter assays. Renilla luciferase activity was normalized against the firefly luciferase activity, setting as 1 the value measured in cells cotransfected with an empty vector (psiCHECK2, no miRNA over-expression). The mir-22-3p sensor served as positive control. (G) MiR-22-3p/miR-132 fold increase reached in each over-expression experiment (detailed below histograms). Error bars represent means +SEM of 3 independent biological replicates, each performed at least in triplicate. In all panels, the reference value, set as 1, is indicated by a dotted line. Significance levels of t-tests are shown. *P < 0.05; **P < 0.01; ***P < 0.005.
Figure 2
Figure 2
GBAP1 acts as a ceRNA titrating miR-22-3p and up-regulating GBA. (A) Effect of GBAP1 3′UTR (with or without the miR-22-3p recognition element, ΔMRE) over-expression on the endogenous transcript levels of indicated miR-22-3p targets in HepG2 cells. 24 hours after transfections, cells were collected for extracting total RNA for measurements by semi-quantitative real-time RT-PCRs of: i) GBA; ii) SP1 (Sp1 Transcription Factor; known miR-22-3p target, positive control); iii) SIRT1 (Sirtuin 1; known miR-22-3p target, positive control); and iv) CELF1 (CUGBP, Elav-Like Family Member 1; negative control). The value measured in cells transfected with an empty vector (psiCHECK2, mock) was set as 1. (B) Effect of GBAP1 3′UTR (wild type or ΔMRE) over-expression on GCase activity, measured 96 hours after transfections. (C) Effect of GBAP1 3′UTR (wild type or ΔMRE) over-expression on GBA protein level, measured by Western blot 96 hours after transfections. A representative blot (right) and the densitometric analysis (left) are shown. Error bars represent: means +SEM of 3 (A) or 4 (B) independent biological replicates, each performed at least in triplicate; means +SD of 3 independent biological replicates (C, GBAP1 3′UTR). In all panels, the reference value, set as 1, is indicated by a dotted line. Significance levels of t-tests are shown. *P < 0.05; **P < 0.01.
Figure 3
Figure 3
GBAP1 codes for multiple alternatively-spliced isoforms and is modulated by NMD. (A) Analysis of GBA and GBAP1 splicing patterns. In the upper part of the panel, a schematic representation of GBA (reference sequence: NM_001005741.2) and GBAP1 (reference sequence: NR_002188.2) genes is reported. Exons are indicated by boxes, introns by lines. The 55-bp-long sequence characterizing GBA exon 9 is specified by a grey rectangle. The scheme is approximately to scale. The overlapping fragments amplified by RT-PCRs to analyze the GBA and GBAP1 splicing patterns are indicated by dashed lines and a letter. In the lower part of the panel, the electrophoretic analysis (agarose gels 2%) of RT-PCR amplicons is shown. RT-PCRs were performed on RNA extracted from HepG2 cells treated (+) or untreated (−) with the NMD inhibitor cycloheximide. On the top of each gel, letters indicate the relevant RT-PCR amplicons. (B) Demonstration of the NMD-mediated degradation of GBAP1 transcripts. The two panel shows expression levels of GBAP1 and GBA isoforms in HEK293 and HepG2 cells, untreated or treated for 8 hours with cycloheximide. Expression levels of endogenous GBAP1/GBA isoforms were measured by semi-quantitative real-time RT-PCRs. Results are presented as normalized rescaled values, setting as 1 the value of the untreated samples (dotted line). The expression level of the Connexin 43 or 32 transcripts, known to be insensitive to NMD, were used in the normalization step. RT-PCRs performed on out-of-frame and in-frame PRKCA isoforms, known to be respectively sensitive and insensitive to the NMD blockage, represent the positive and negative control. Error bars represent means +SEM of 3 independent biological replicates, each performed at least in triplicate. Significance levels of t-tests are shown. *P < 0.05; **P < 0.01.
Figure 4
Figure 4
GBA, GBP1, and miR-22-3p are expressed in iPS cells and iPSC-derived neurons of PD patients and controls. GBA (A), GBAP1 (B), and miR-22-3p (C) expression levels were measured by semi-quantitative real-time RT-PCRs in up to six iPS and iPSC-derived neuronal cells of cases and controls. Boxplots show expression levels according to the disease status; boxes define the interquartile range; the thick line refers to the median. Results are presented as normalized rescaled values. Significance level for differences between groups was calculated by a Wilcoxon-Mann-Whitney test, and showed only if significant. *P < 0.05.
Figure 5
Figure 5
Schematic representation of the effect of modulating the GBA/GBAP1/miR-22-3p RNA-based network on endogenous GBAP1 and GBA levels. Schematic representation of the ceRNA network involving GBA (blue transcripts) and GBAP1 (orange transcripts), harboring the same MRE sites (green and violet ovals). The green MRE sites bind to miR-22-3p (in green), whereas violet ones bind to other not-specified miRNAs. The experimental modulation of the proposed ceRNA network impacts on both coregulated transcripts. In particular, over-expression of miR-22-3p (left part of the figure) determines the down-regulation of both GBA and GBAP1 transcripts. Conversely, over-expression of GBAP1 (e.g., by inhibiting the NMD pathway, as experimentally verified in the present study; right part of the figure) will increase the cellular concentrations of miR-22-3p MREs, thus resulting in the de-repression of GBA. In the scheme, transcripts destined to degradation are colored in lighter shades.

Similar articles

Cited by

References

    1. Aureli M, et al. Cell surface associated glycohydrolases in normal and Gaucher disease fibroblasts. J. Inherit. Metab. Dis. 2012;35:1081–1091. doi: 10.1007/s10545-012-9478-x. - DOI - PubMed
    1. De Fost M, Aerts JM, Hollak CE. Gaucher disease: from fundamental research to effective therapeutic interventions. Neth. J. Med. 2003;61:3–8. - PubMed
    1. Sidransky E. Gaucher disease: insights from a rare Mendelian disorder. Discov. Med. 2012;14:273–281. - PMC - PubMed
    1. Pankratz N, et al. Meta-analysis of Parkinson's disease: identification of a novel locus, RIT2. Ann. Neurol. 2012;71:370–384. doi: 10.1002/ana.22687. - DOI - PMC - PubMed
    1. Nalls MA, et al. Large-scale meta-analysis of genome-wide association data identifies six new risk loci for Parkinson's disease. Nat. Genet. 2014;46:989–993. doi: 10.1038/ng.3043. - DOI - PMC - PubMed

Publication types