. 2017 Sep 21:11:60.
doi: 10.3389/fninf.2017.00060. eCollection 2017.

Sleep: An Open-Source Python Software for Visualization, Analysis, and Staging of Sleep Data

Affiliations

Sleep: An Open-Source Python Software for Visualization, Analysis, and Staging of Sleep Data

Etienne Combrisson et al. Front Neuroinform. .

Abstract

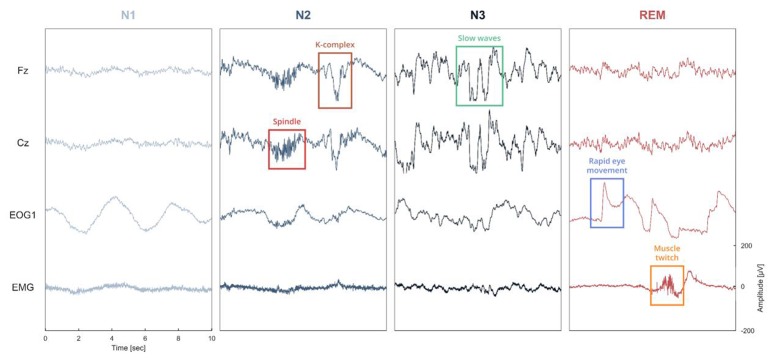
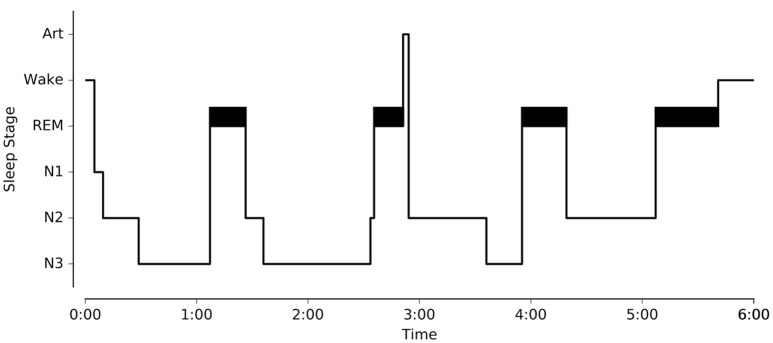
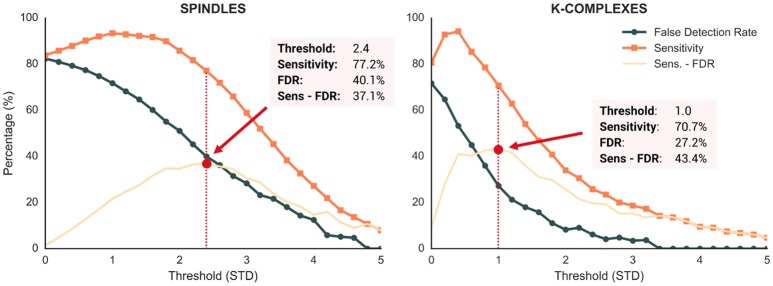
We introduce Sleep, a new Python open-source graphical user interface (GUI) dedicated to visualization, scoring and analyses of sleep data. Among its most prominent features are: (1) Dynamic display of polysomnographic data, spectrogram, hypnogram and topographic maps with several customizable parameters, (2) Implementation of several automatic detection of sleep features such as spindles, K-complexes, slow waves, and rapid eye movements (REM), (3) Implementation of practical signal processing tools such as re-referencing or filtering, and (4) Display of main descriptive statistics including publication-ready tables and figures. The software package supports loading and reading raw EEG data from standard file formats such as European Data Format, in addition to a range of commercial data formats. Most importantly, Sleep is built on top of the VisPy library, which provides GPU-based fast and high-level visualization. As a result, it is capable of efficiently handling and displaying large sleep datasets. Sleep is freely available (http://visbrain.org/sleep) and comes with sample datasets and an extensive documentation. Novel functionalities will continue to be added and open-science community efforts are expected to enhance the capacities of this module.

Keywords: automatic detection; electroencephalography; graphical user interface; graphoelements; hypnogram; opengl; polysomnography; scoring.


Figures

Figure 1
Figure 1
Illustration of the different sleep features observed in a polysomnographic recording of one individual. To see examples of automatic detection actually performed by our software, see Figure 4. Spindles and K-complexes are landmarks of N2 sleep. Slow waves are present during N3 sleep (sometimes referred to as slow wave sleep). Rapid eye movements, observed in the EOG channel, and muscle twitches, observed on the EMG channel, are two essential features of rapid eye movement (REM) sleep.
Figure 2
Figure 2
Method description for the automatic sleep spindles detection. First, the original signal is convoluted with a Morlet wavelet centered in the spindles frequency band [12–14 Hz]. From the resulting complex decomposition, we only keep the amplitude and find time indices where the amplitude exceeds the threshold (purple in 1). Then, we compute the normalized power in the sigma band and detect again time indices where the power exceeds a threshold (green in 2). The normalized sigma power is obtained by first computing absolute power in four frequency bands (delta = [0.5–4 Hz], theta = [4–8 Hz], alpha = [8–12 Hz], sigma = [12–16 Hz]) and then dividing each of them by the sum of these powers. As a result, for each time point the sum of powers in the four frequency bands equals 1. The time location of the initial detected spindles (gray line in 3) is the result of the intersection of exceeding both the amplitude index (purple line) and the power index (green line). Finally, time gaps are filled only for neighboring detected events (<500 ms) and a final duration criteria is applied in order to suppress events with a duration inferior to 500 ms or superior to 2,000 ms (these thresholds can be set within Sleep interface, 4).
Figure 3
Figure 3
Sleep main interface. Each element of the graphical user interface can either be displayed or hidden, (A) Settings panel containing all Sleep controls and parameters. The current displayed tab can be used to toggle channel visibility and to adjust individual amplitudes, (B) 30 s time window of electrophysiological data. Here, only 5 channels are currently displayed (Cz, Fz, Pz, EOG1, EMG1), (C) The spectrogram displays the time-frequency representation of a specific channel for the entire recording, and can be useful to identify global changes in the spectral properties of the signal often associated with changes in sleep stages. Any channel can be picked and further time-frequency controls are available in the settings panel, (D) Hypnogram with one specific color per stage. The stage order can be changed from the default Artefact, Wake, REM, N1, N2, N3, (E) Time axis with visual indicator, (F) Navigation bar with time settings: window length and step size, unit (seconds/minutes/hours), (G) Topographic data representation.
Figure 4
Figure 4
Example of bandpass filtering. Using the Tools panel (left), the EEG signals have been bandpass-filtered in the spindles frequency band (12–14 Hz, Butterworth filter). Using the “Enable” checkbox of the panel, this filtering operation can be disabled at any moment to retrieve the original EEG signals. Finally, by left-clicking on a specific time point in a channel or selecting the Magnify tools (bottom), users can enlarge events. This was used in this example to enlarge a sleep spindle observed on channel Pz.
Figure 5
Figure 5
Example of publication-ready hypnogram figure exported using Sleep GUI.
Figure 6
Figure 6
GUI integration of the automatic event detection. The top row illustrate examples of typical graphoelements detected with Sleep including spindles, K-complexes, rapid eye movements, slow-waves, muscle twitches, and peaks. The window below illustrate how detections of such events are visually integrated into the interface. First, each detected event are highlighted into the channel time-series. Then, all the detected events are displayed on top of the hypnogram (identified using different symbols and colors per detection type) and reported into a table embedded into the settings panel. A mouse click on a line centers the corresponding event on the screen. This table can be exported into a *.csv or a *.txt file.
Figure 7
Figure 7
Performance metrics of the Sleep spindle and K-complex detection methods evaluated at 25 different thresholds (range = 0–5, step = 0.2). Dark orange and blue lines depict the sensitivity and false detection rate (FDR), respectively. Light orange lines show the difference between sensitivity and FDR. Red dotted lines depict the threshold values that maximized this difference.

References

    1. Berthomier C., Drouot X., Herman-Stoïca M., Berthomier P., Prado J., Bokar-Thire D., et al. . (2007). Automatic analysis of single-channel sleep EEG: validation in healthy individuals. Sleep 30, 1587–1595. 10.1093/sleep/30.11.1587 - DOI - PMC - PubMed
    1. Billinger M., Brunner C., Müller-Putz G. R. (2014). SCoT: a Python Toolbox for EEG Source Connectivity. Available online at: https://pdfs.semanticscholar.org/b196/7f587fbea9ecf4cb6be3f757a8136fc60c... - PMC - PubMed
    1. Campagnola L., Klein A., Larson E., Rossant C., Rougier N. P. (2015). VisPy: harnessing the GPU for fast, high-level visualization, in Proceedings of the 14th Python in Science Conference. Available online at: https://hal.inria.fr/hal-01208191/ (Accessed May 23, 2017).
    1. Combrisson E., Jerbi K. (2015). Exceeding chance level by chance: the caveat of theoretical chance levels in brain signal classification and statistical assessment of decoding accuracy. J. Neurosci. Methods 250, 126–136. 10.1016/j.jneumeth.2015.01.010 - DOI - PubMed
    1. Combrisson E., Perrone-Bertolotti M., Soto J. L., Alamian G., Kahane P., Lachaux J.-P., et al. . (2017). From intentions to actions: neural oscillations encode motor processes through phase, amplitude and phase-amplitude coupling. Neuroimage 147, 473–487. 10.1016/j.neuroimage.2016.11.042 - DOI - PubMed