. 2017 Sep 21:7:408.
doi: 10.3389/fcimb.2017.00408. eCollection 2017.

Increased Plasmodium falciparum Parasitemia in Non-splenectomized Saimiri sciureus Monkeys Treated with Clodronate Liposomes

Affiliations

Increased Plasmodium falciparum Parasitemia in Non-splenectomized Saimiri sciureus Monkeys Treated with Clodronate Liposomes

Janaiara A Cunha et al. Front Cell Infect Microbiol. .

Abstract

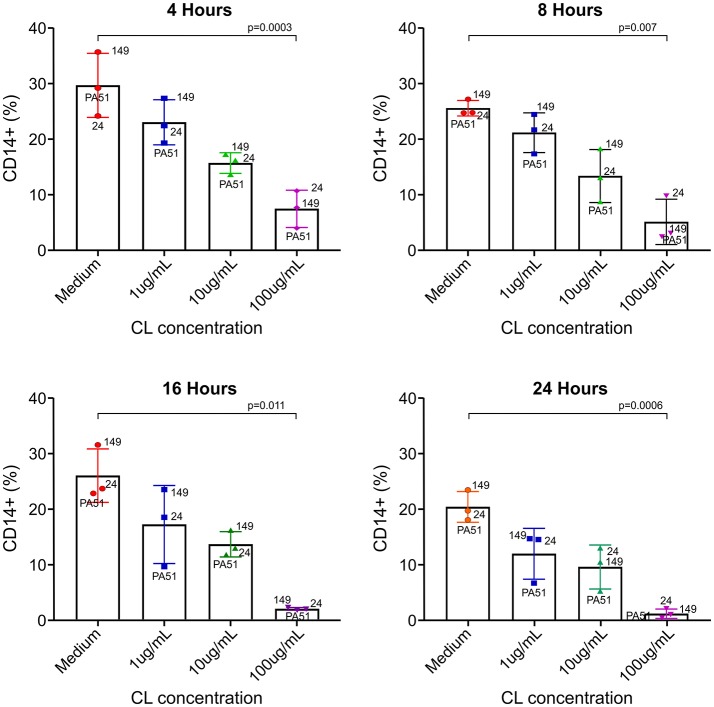
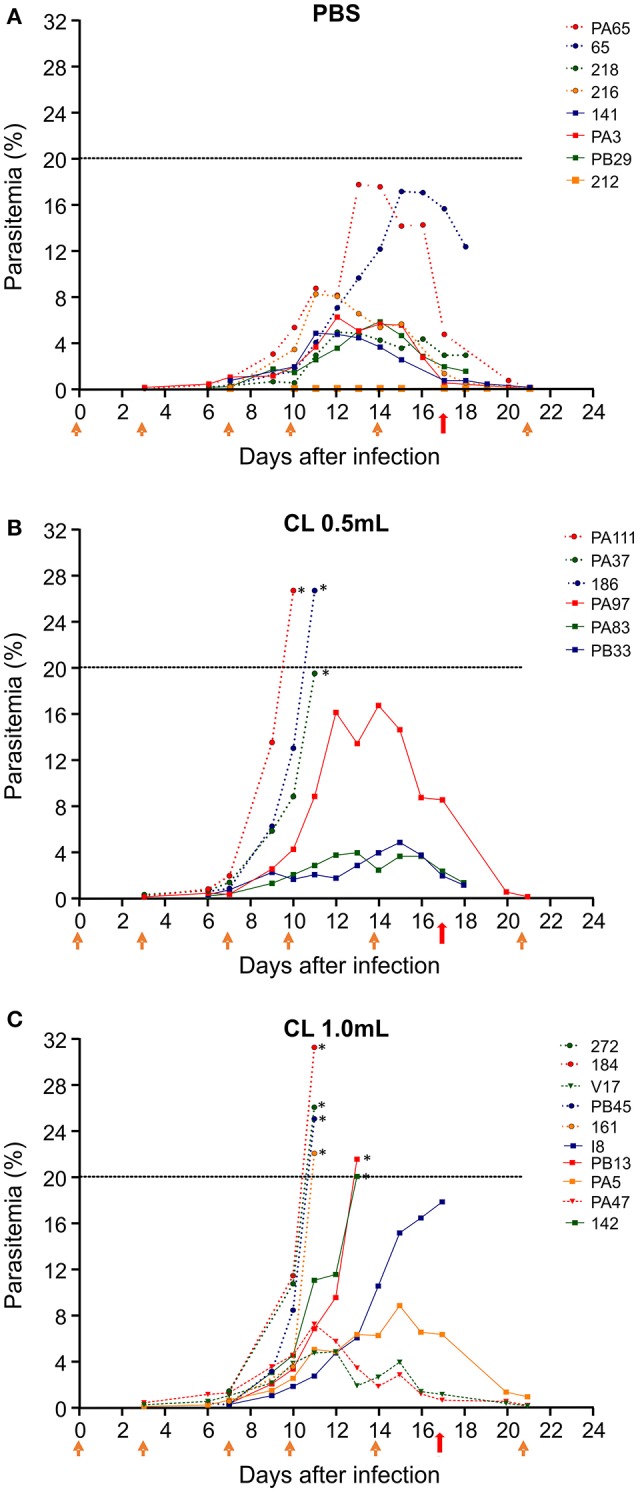
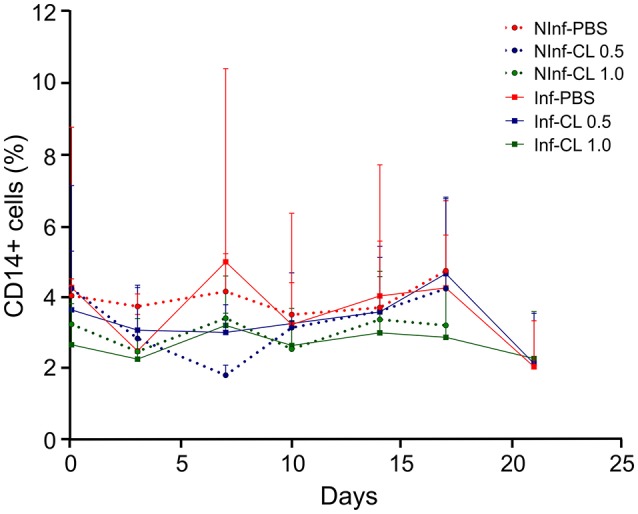
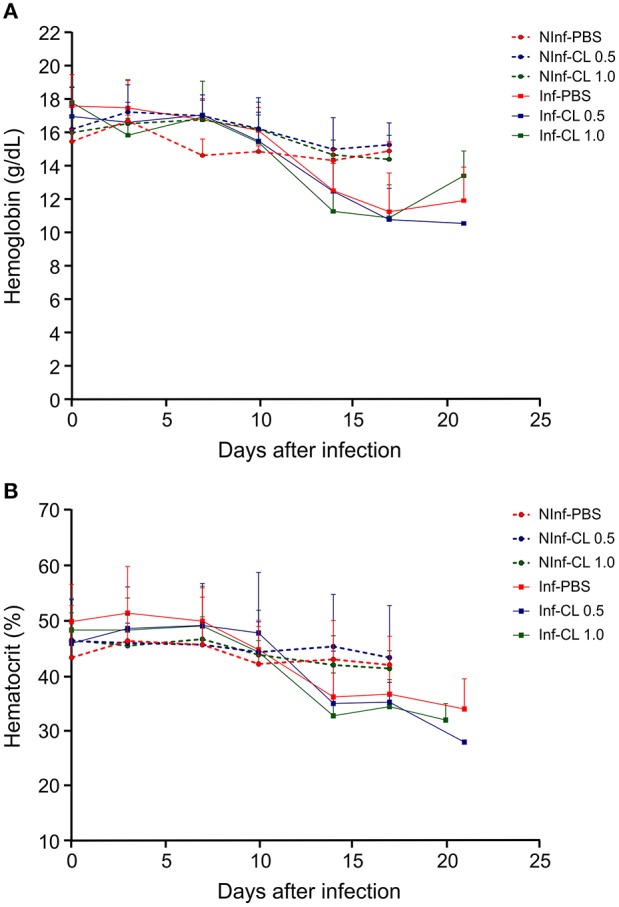
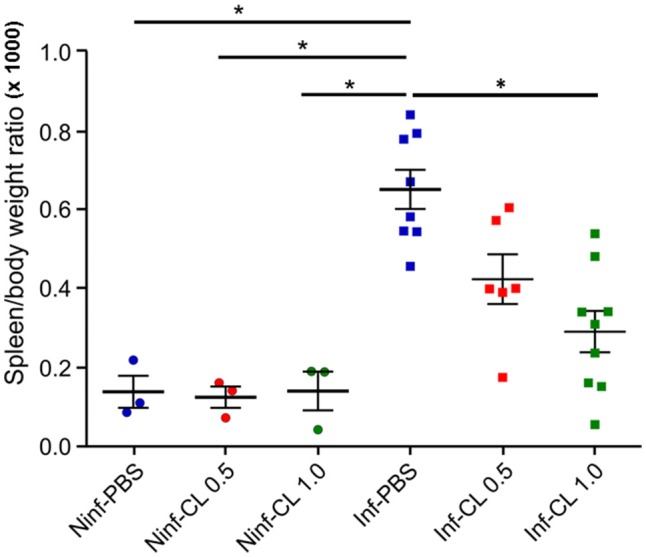
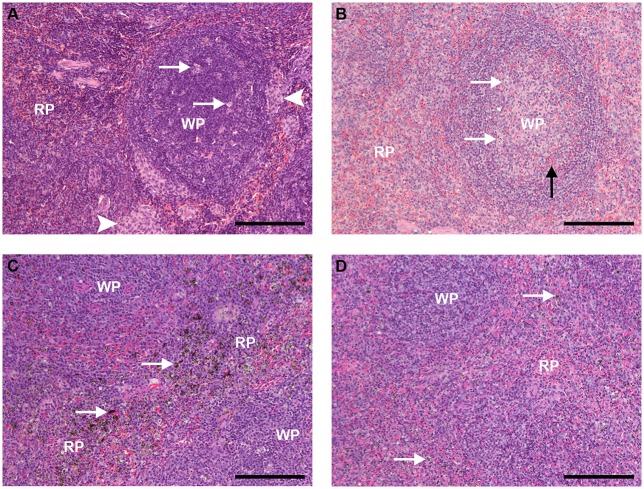
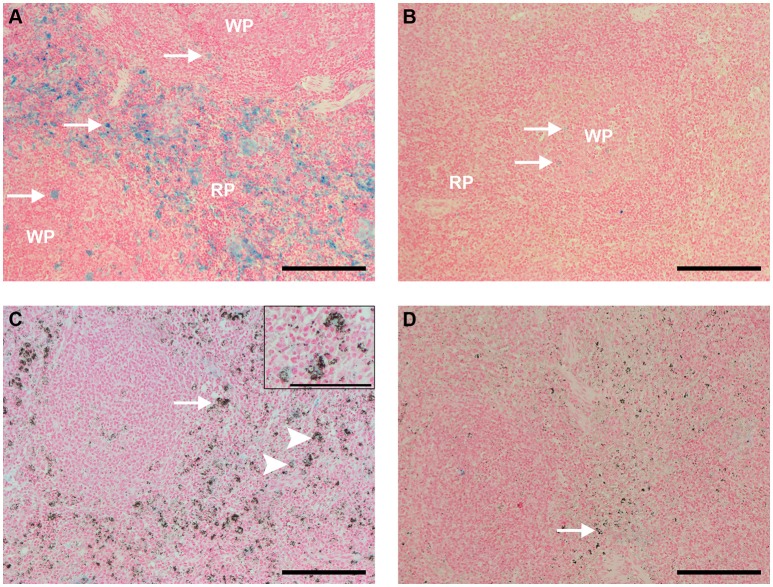
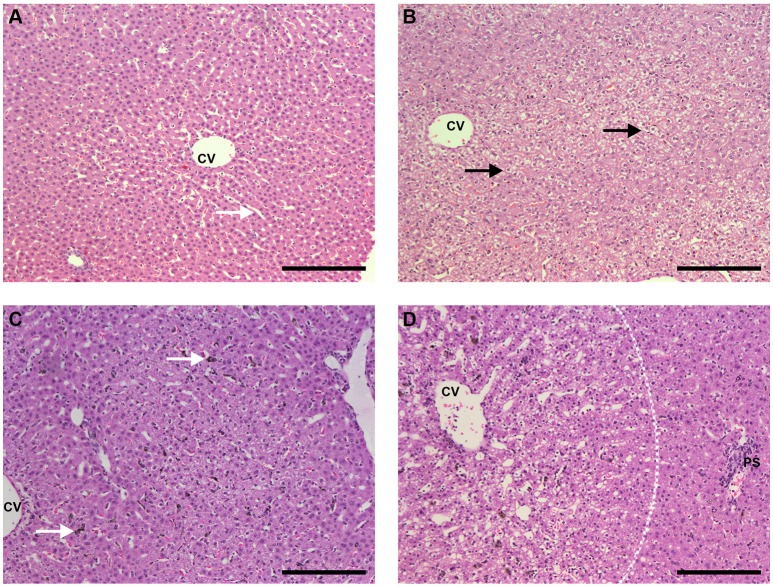
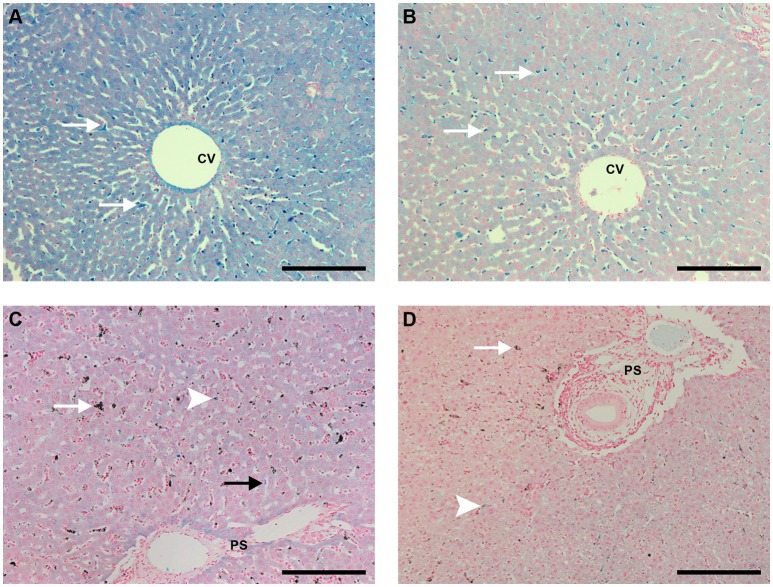
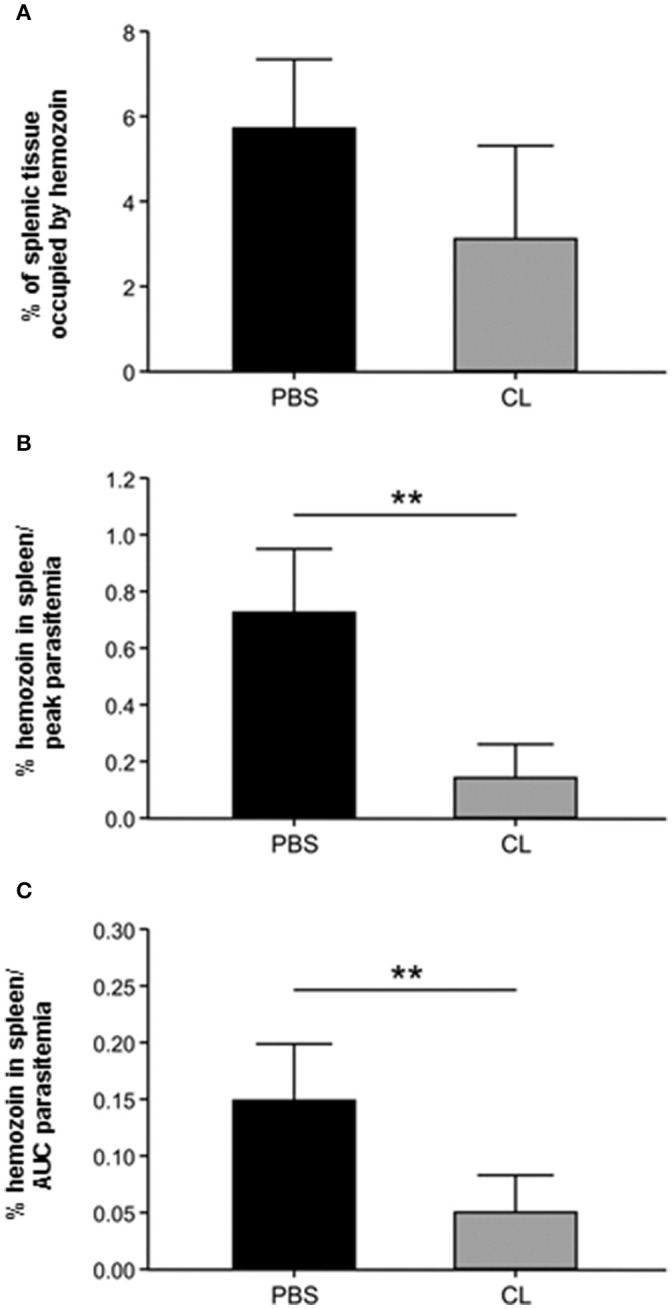
A major constraint in the study of Plasmodium falciparum malaria, including vaccine development, lies on the parasite's strict human host specificity and therefore the shortage of animal experimental models able to harbor human plasmodia. The best experimental models are neo-tropical primates of the genus Saimiri and Aotus, but they require splenectomy to reduce innate defenses for achieving high and consistent parasitemias, an important limitation. Clodronate-liposomes (CL) have been successfully used to deplete monocytes/macrophages in several experimental models. We investigated whether a reduction in the numbers of phagocytic cells by CL would improve the development of P. falciparum parasitemia in non-splenectomized Saimiri sciureus monkeys. Depletion of S. sciureus splenocytes after in vitro incubation with CL was quantified using anti-CD14 antibodies and flow cytometry. Non-infected and P. falciparum-infected S. sciureus were injected intravenously twice a week with either CL at either 0.5 or 1 mL (5 mg/mL) or phosphate buffered saline (PBS). Animals were monitored during infection and treated with mefloquine. After treatment and euthanasia, spleen and liver were collected for histological analysis. In vitro CL depleted S. sciureus splenic monocyte/macrophage population in a dose- and time-dependent manner. In vivo, half of P. falciparum-infected S. sciureus treated with CL 0.5 mL, and two-thirds of those treated with CL 1 mL developed high parasitemias requiring mefloquine treatment, whereas all control animals were able to self-control parasitemia without the need for antimalarial treatment. CL-treated infected S. sciureus showed a marked decrease in the degree of splenomegaly despite higher parasitemias, compared to PBS-treated animals. Histological evidence of partial monocyte/macrophage depletion, decreased hemozoin phagocytosis and decreased iron recycling was observed in both the spleen and liver of CL-treated infected S. sciureus. CL is capable of promoting higher parasitemia in P. falciparum-infected S. sciureus, associated with evidence of partial macrophage depletion in the spleen and liver. Macrophage depletion by CL is therefore a practical and viable alternative to surgical splenectomy in this experimental model.

Keywords: Plasmodium falciparum; Saimiri sciureus; clodronate liposomes; liver; macrophages; malaria; spleen.


Figures

Figure 1
Figure 1
Effect of CL on S. sciureus splenocyte viability in vitro. CL induced dose-dependent cytotoxicity in monocytes/macrophages. 24, 149, and PA51 refer to S. sciureus identification. Medium vs. 100 μg/ml: 4 h (p = 0.0003), 8 h (p = 0.007), 16 h (p = 0.011), and 24 h (p = 0.0006). %: percentage of CD14+ cells in total number of splenocytes.
Figure 2
Figure 2
Course of parasitemia after infection of S. sciureus with 106 pRBC/mL by FUP strain of P. falciparum. Parasitemia is shown for animals that received PBS (controls) (A); clodronate liposomes (CL) 0.5 mL (B); or CL 1.0 mL (C). Data are from three separate experiments, with 6–9 animals per group. Orange arrows indicate the timepoints when PBS or CL was given to the animals. Red arrows indicate treatment with mefloquine. Dashed line represents the limit of parasitemia established for treatment (20%) with mefloquine. *Animals that received treatment with mefloquine before day 17 for reaching 20% parasitemia.
Figure 3
Figure 3
Changes in blood monocyte counts during P. falciparum infection and CL administration. Monocyte quantification was performed by flow cytometry using anti-CD14-APC antibodies. Solid lines represent the mean and standard deviation. %: percentage of CD14+ cells in total number of peripheral blood monocuclear cells (PBMC). NInf, non-infected control groups; Inf, P. falciparum-infected groups.
Figure 4
Figure 4
Hemoglobin concentration in the blood (A) and hematocrit (B) of S. sciureus. NInf, non-infected control groups; Inf, P. falciparum-infected groups. Solid lines represent the mean and standard deviation.
Figure 5
Figure 5
Effect of P. falciparum infection and/or CL administration on spleen/body weight ratios. Solid lines represent the mean and standard deviation. *P < 0.05.
Figure 6
Figure 6
Spleen sections HE staining (bar: 200 μm). (A) Spleen of an uninfected, control animal that received PBS (code PA11). (A) B-cell follicle (WP, white pulp) is shown, with a few apoptotic centers (arrows); clusters of monocyte/macrophages, typical of Saimiri spleens, are present (arrowheads). The red pulp (RP) shows typical architecture, densily populated with small-nuclei, dark-stained cells, and red blood cells (red stain) flowing through. (B) Spleen of an uninfected Saimiri inoculated with CL 1 mL (code V3). In general, the splenic structure was preserved, but cell density was apparently smaller as compared to animals that received PBS, with predominance of cells with light-stained nuclei; penetration of red blood cells inside B-cell follicle was observed (black arrow); apoptotic centers (arrows), which are dependent on macrophages, and clusters of monocyte/macrophages were decreased (clusters of monocytes absent in this image). (C) Spleen of a P. falciparum-infected Saimiri that received PBS (code 141: treated at day 17, with 0.69% parasitemia, killed 5 days later). Emphasis is given to the distribution of hemozoin (seen as dark, granulated stain - arrows), which could be found throughout the red pulp (RP); loss of well-defined limits between the RP and the white pulp (WP) was observed. (D) Spleen of a P. falciparum-infected Saimiri that received CL 1 mL (code 272: treated at day 11, with 22 % parasitemia, killed 5 days later). The amount of hemozoin (arrows) was substantially decreased compared to infected animals that received PBS, and seen as small black dots. As in (C), loss of well-defined limits between the red pulp (RP) and the white pulp (WP) was observed.
Figure 7
Figure 7
Spleen sections Perls staining (bar: 200 μm, except in C, bar: 100 μm). (A) Spleen of an uninfected, control animal that received PBS (code PA11). Large amounts of ferric iron-containing macrophages (blue staining) were observed throughout the red pulp (RP), and also sparsed in follicles (arrows). (B) Spleen of an uninfected Saimiri inoculated with CL 1 mL (code PB75). Blue staining, representing ferric iron-containing macrophages, nearly disappeared from the red pulp (RP), and was faint in follicles (arrows). (C) Spleen of a P. falciparum-infected Saimiri that received PBS (code 216: treated at day 17, with 1,3% parasitemia, killed 5 days later). Blue staining, representing ferric iron-containing macrophages, was much fainter in the spleen of infected, compared to uninfected, S. sciureus; on the other hand, macrophages were laden with hemozoin (arrow); only few macrophages showed colocalization of iron staining and hemozoin (arrowheads and magnified insert on top right). (D) Spleen of a P. falciparum-infected Saimiri that received CL 1 mL (code 272: treated at day 11, with 22% parasitemia, killed 5 days later). Presence of iron staining was nearly absent, and presence of hemozoin (arrow) was much decreased in relation to (C).
Figure 8
Figure 8
Liver sections HE staining (bar: 200 μm). (A) Liver of an uninfected, control animal that received PBS (code PA67), showing typical architecture, healthy hepatocytes and clean synusoids (arrows); CV, centrilobular vein. (B) Liver of an uninfected Saimiri inoculated with CL 1 mL (code PB75). The general aspect of most sections was rather normal (similar to the pattern of A), but eventually areas of hepatocyte vacuolization, as depicted, were observed; CV, centrilobular vein. (C) Liver of a P. falciparum-infected Saimiri that received PBS (code 141: treated at day 17, with 0.69 % parasitemia, killed 5 days later). Kupffer cells laden with hemozoin (arrow); CV, centrilobular vein. (D) Liver of a P. falciparum-infected Saimiri that received CL 1 mL (code 161: treated at day 11, with 22% parasitemia, killed 5 days later). Intense hepatocyte vacuolization was observed, evidenced particularly in the left half of the image, closer to the centrilobular vein (CV) and away from the portal space (PS) (more vacuolized area and more preserved area separated by a dashed line).
Figure 9
Figure 9
Liver sections Perls staining (bar: 200 μm). (A) Liver of an uninfected, control animal that received PBS (code PA11), showing blue staining throughout the hepatocytes, with stronger staining in Kupffer cells (arrows); CV: centrilobular vein (B) Liver of an uninfected Saimiri inoculated with CL 1 mL (code V3). The blue stainingwas lighter, especially in hepatocytes, with Kupffer cells still showing more pronounced staining (arrows). CV, centrilobular vein. (C) Liver of a P. falciparum-infected Saimiri that received PBS (code 216: treated at day 17, with 1,3% parasitemia, killed 5 days later). Iron staining was lighter than (A) in both hepatocytes and Kupffer cells, but still visible; Kupffer cells were laden with hemozoin (arrow); in only sporadic cases colocalization of hemozoin and iron staining was observed in Kupffer cells (arrowhead). PS: portal space. (D) Liver of a P. falciparum-infected Saimiri that received CL 1 mL (code 161: treated at day 11, with 22% parasitemia, killed 5 days later). Both iron staining (arrowhead) and hemozoin (arrow) were decreased in relation to (C). PS: portal space.
Figure 10
Figure 10
Estimation of the effect of CL treatment on splenic macrophage population through hemozoin quantification. (A) Percentage of the splenic tissue occupied by hemozoin in PBS-treated and CL-treated infected animals. (B,C) Amount of splenic hemozoin adjusted by parasitemia in PBS-treated and CL-treated infected animals. The percentage of splenic tissue occupied by hemozoin (as in A) was divided by the peak parasitemia (B) or by the area under the curve (AUC) of parasitemia (C) of each animal. **P < 0.01.

References

    1. Abbas A. K., Lichtman A. H., Pillai S. (2008). Imunologia Celular e Molecular, 6th Edn. Rio de Janeiro: Elsevier.
    1. Achtman A. H., Khan M., MacLennan I. C., Langhorne J. (2003). Plasmodium chabaudi chabaudi infection in mice induces strong B cell responses and striking but temporary changes in splenic cell distribution. J. Immunol. 171, 317–324. 10.4049/jimmunol.171.1.317 - DOI - PubMed
    1. Alves F. A., Pelajo-Machado M., Totino P. R., Souza M. T., Gonçalves E. C., Schneider M. P., et al. (2015). Splenic architecture disruption and parasite-induced splenocyte activation and anergy in Plasmodium falciparum-infected Saimiri sciureus monkeys. Malar. J. 14:128. 10.1186/s12936-015-0641-3 - DOI - PMC - PubMed
    1. Alves F. A., Souza M. T., Gonçalves E. C., Schneider M. P., Marinho A. M., Muniz J. A., et al. (2010). DNA sequencing of 13 cytokine gene fragments of Aotus infulatus and Saimiri sciureus, two non-human primate models for malaria. Cytokine 52, 151–155. 10.1016/j.cyto.2010.09.004 - DOI - PubMed
    1. Arnold L., Tyagi R. K., Mejia P., Swetman C., Gleeson J., Perignon J. L., et al. (2011). Further improvements of the P. falciparum humanized mouse model. PLoS ONE 6:e18045. 10.1371/journal.pone.0018045 - DOI - PMC - PubMed

Publication types