. 2017;60(3):1143-1160.
doi: 10.3233/JAD-170634.

Co-Localization of Glia Maturation Factor with NLRP3 Inflammasome and Autophagosome Markers in Human Alzheimer's Disease Brain

Affiliations

Co-Localization of Glia Maturation Factor with NLRP3 Inflammasome and Autophagosome Markers in Human Alzheimer's Disease Brain

Mohammad Ejaz Ahmed et al. J Alzheimers Dis. 2017.

Abstract

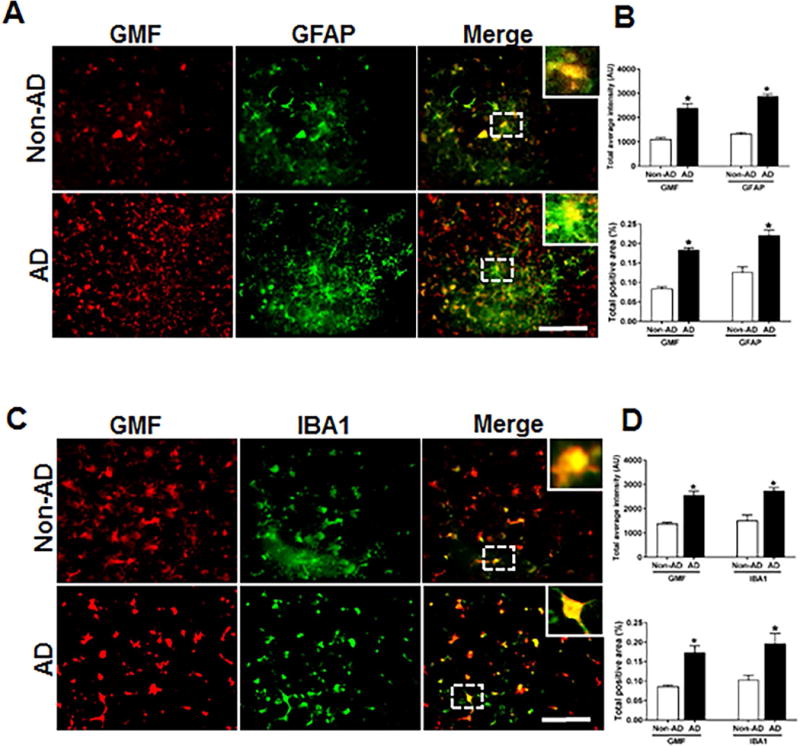
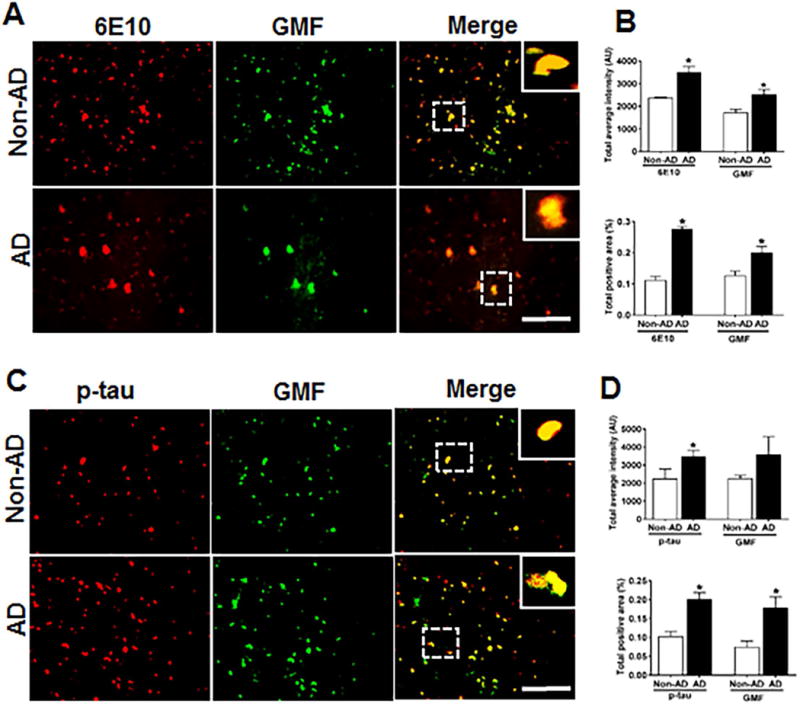
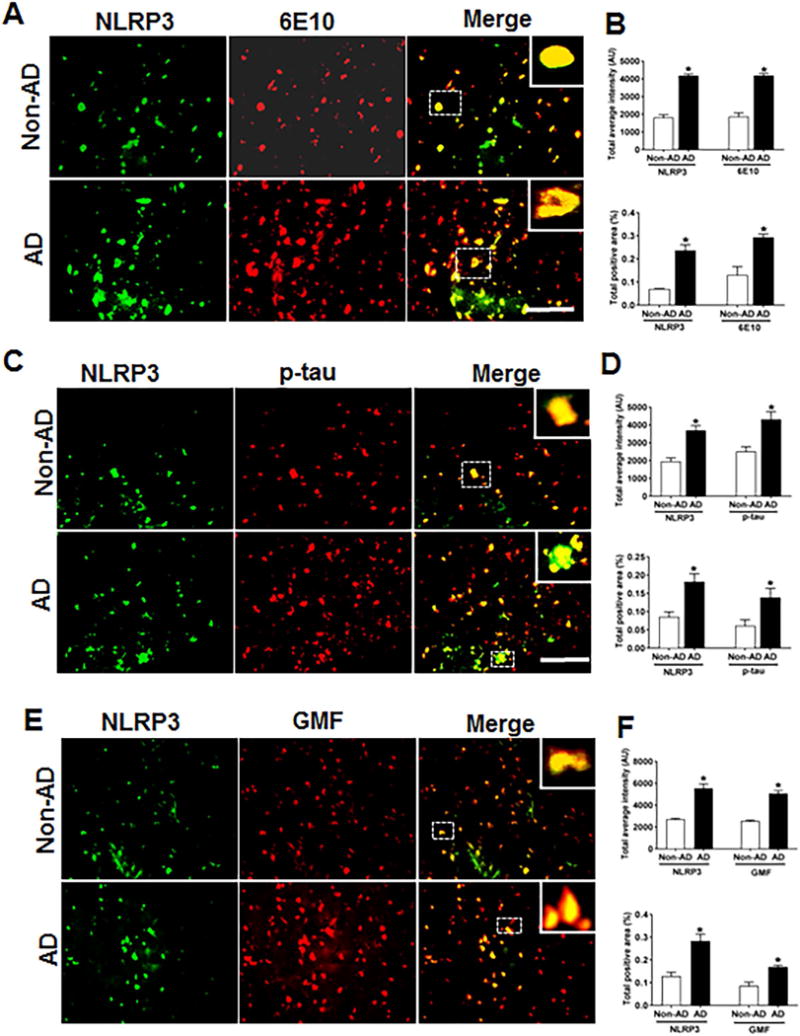
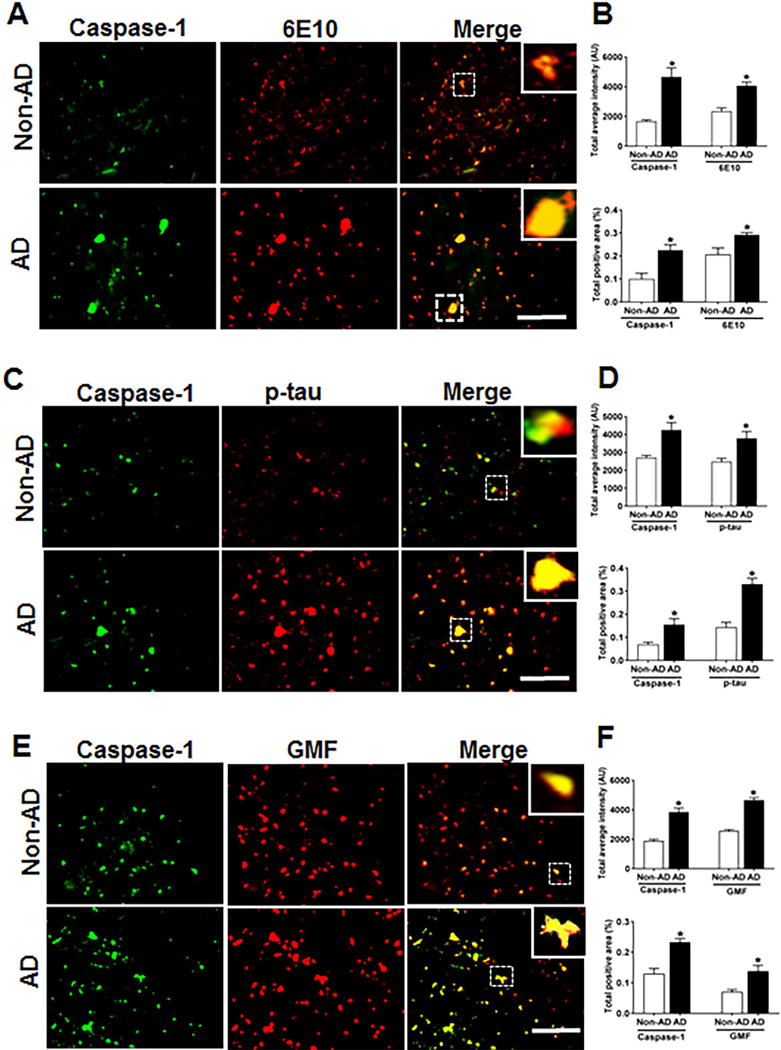
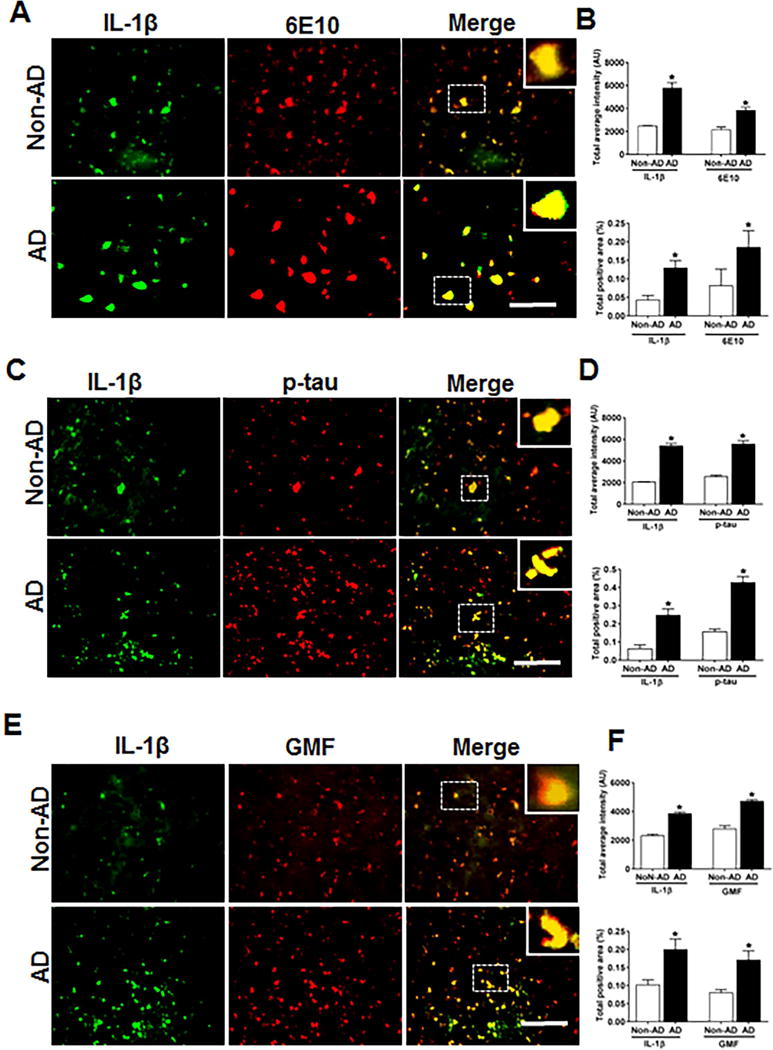
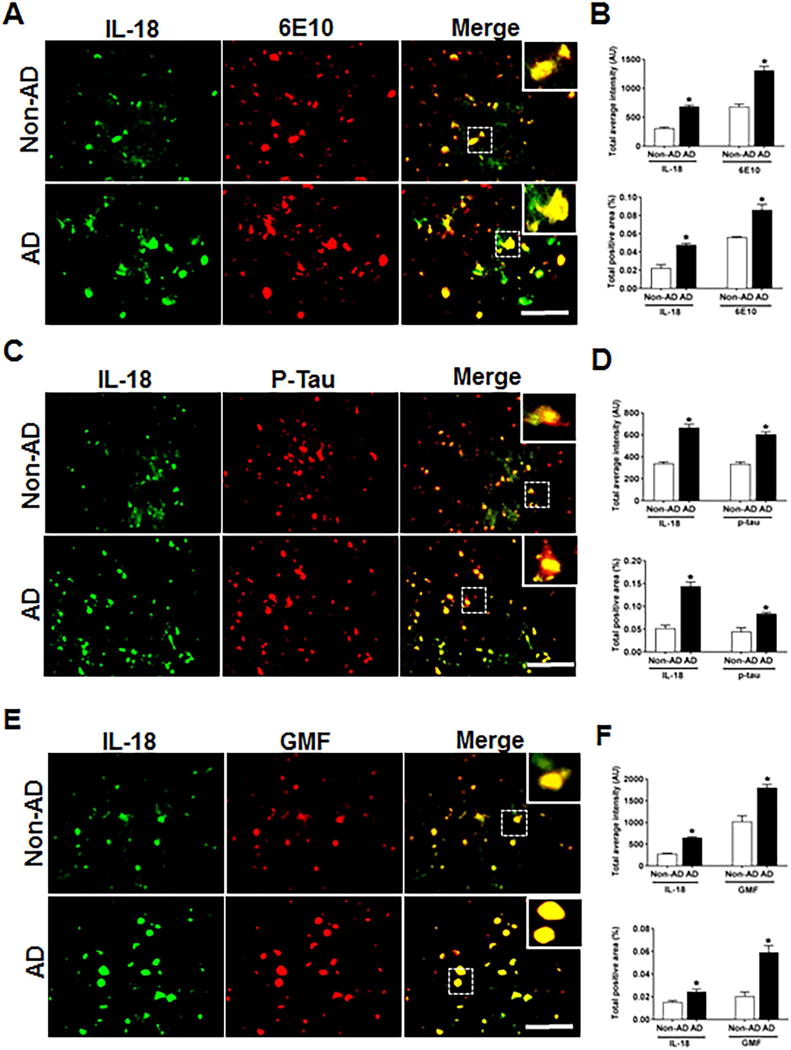
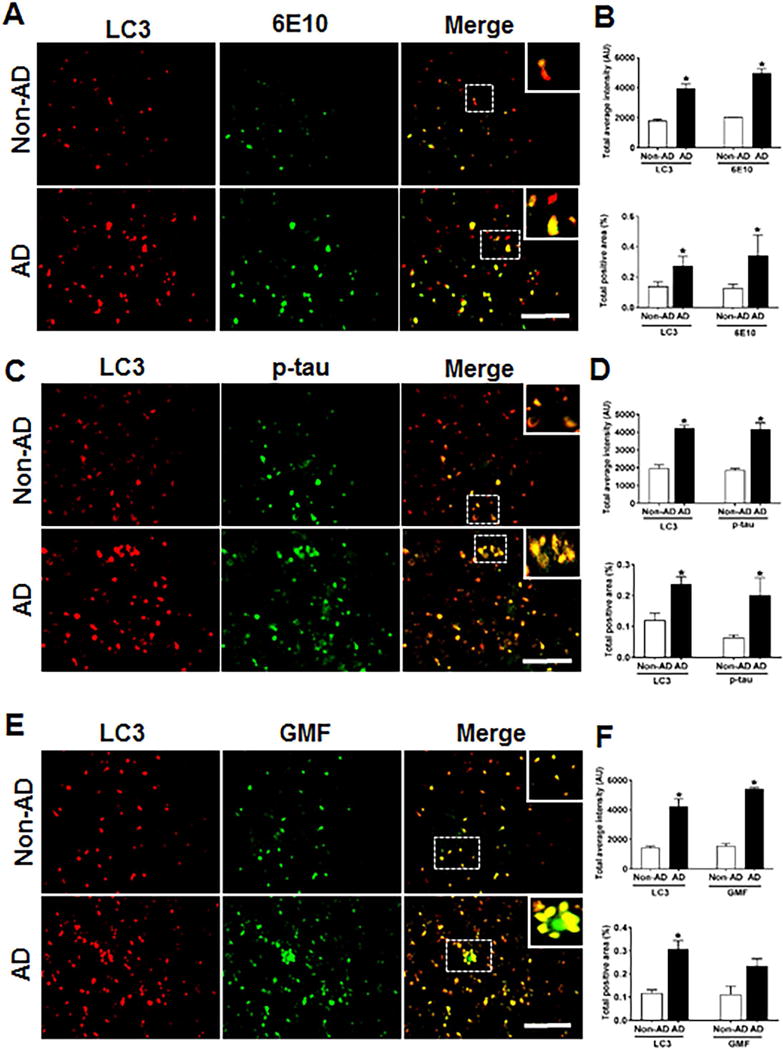
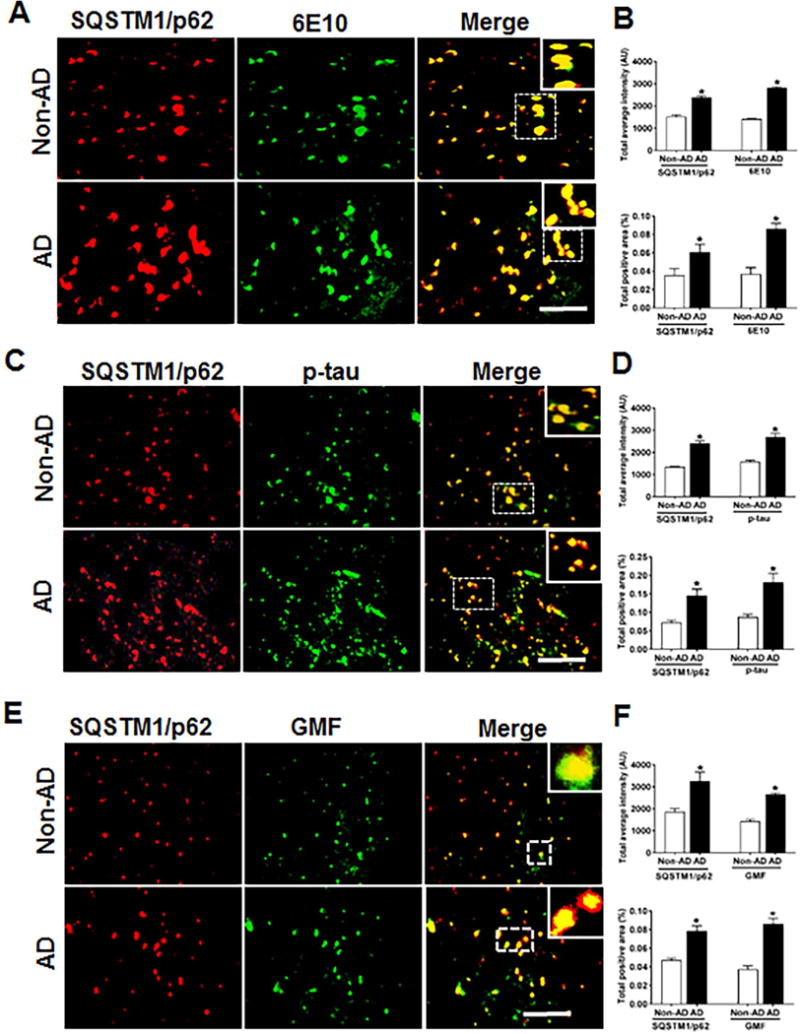
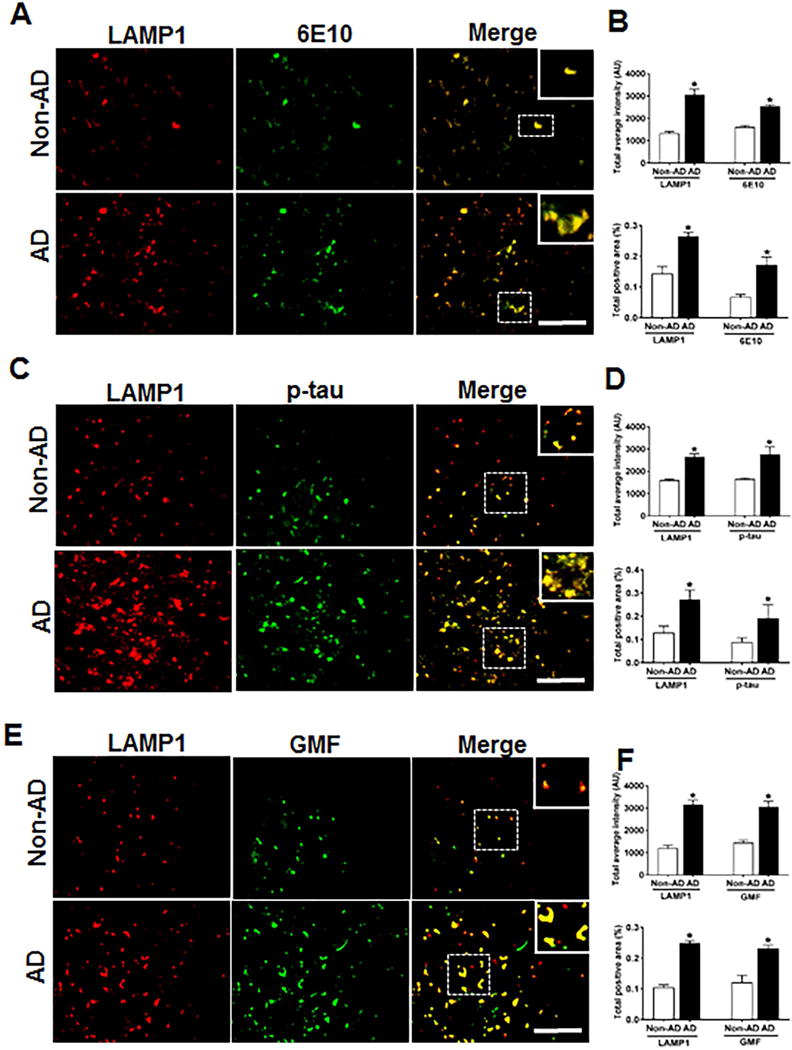
Alzheimer's disease (AD) is a progressive neurodegenerative disease characterized by the presence of intracellular neurofibrillary tangles (NFTs) containing hyperphosphorylated tau, and the extracellular deposition of amyloid plaques (APs) with misfolded amyloid-β (Aβ) peptide. Glia maturation factor (GMF), a highly conserved pro-inflammatory protein, isolated and cloned in our laboratory, has been shown to activate glial cells leading to neuroinflammation and neurodegeneration in AD. We hypothesized that inflammatory reactions promoted by NLRP3-Caspase-1inflammasome pathway trigger dysfunction in autophagy and accumulation of Aβ which is amplified and regulated by GMF in AD. In this study, using immunohistochemical techniques we analyzed components of the NLRP3 inflammasome and autophagy- lysosomal markers in relation to Aβ, p-tau and GMF in human postmortem AD and age-matched non-AD brains. Tissue sections were prepared from the temporal cortex of human postmortem brains. Here, we demonstrate an increased expression of the inflammasome components NLRP3 and Caspase-1 and the products of inflammasome activation IL-1β and IL-18 along with GMF in the temporal cortex of AD brains. These inflammasome components and the pro-inflammatory cytokines co-localized with GMF in the vicinity and periphery of the APs and NFTs. Moreover, using double immunofluorescence staining, AD brain displayed an increase in the autophagy SQSTM1/p62 and LC3 positive vesicles and the lysosomal marker LAMP1 that also co-localized with GMF, Aβ and hyperphosphorylated p-tau. Our results indicate that in AD, the neuroinflammation promoted by the NLRP3 inflammasome may be amplified and regulated by GMF, which further impairs clearance of protein aggregates mediated by the auto-phagosomal pathway.

Keywords: Alzheimer’s disease; amyloid plaques; autophagy; glia maturation factor; inflammasome; neurofibrillary tangles; pro-inflammatory cytokine.


Figures

Fig 1
Fig 1
Co-localization of GMF with GFAP and IBA1 in the temporal cortex of AD and non-AD control brain. (A) Sections were immunostained with ant-GMF and anti-GFAP respectively. Representative images showed higher expression and co-localization of GMF (red) with GFAP (green), which clearly indicates astrocytes are one of the site of expression of GMF in human AD brain. (C) Sections were immunostained with anti-GMF and anti-IBA1 respectively. Representative image display the higher expression of and co-localization of GMF(red) with IBA1(red) which clearly indicates microglia are another site in addition to the astrocyte and some neuronal cell for the GMF expression in human AD brain. The values are expressed as mean ± standard error of determination from each group (n= 3–5). *p <0.05 versus non-AD was considered statistically significant. Boxed area shows the enlarged view of co-localization of GMF (red) with GFAP (green) and IBA1 (red) Scale bar = 50μm and AU (Arbitrary Unit). (B&D) Quantification of GMF, GFAP and IBA1based on average labeled intensity and labeled positive area in AD and non-AD brains.
Fig 2
Fig 2
Co-localization of Aβ (6E10) and p-tau with GMF in the temporal cortex of AD and non-AD control brain. (A) Sections were immunostained with anti Aβ (6E10) and anti-GMF respectively. Representative images display the higher expression and co-localization of 6E10 (red) and GMF (green) in AD as compared with non-AD control brain. (C) Sections were immunostained with p-tau and with GMF respectively. Representative image display higher expression and co-localization of GMF (green) with p-tau (red) in AD compared to age-matched non-AD brain. The values are expressed as mean ± standard error of determination from each group (n= 3–5). *p <0.05 versus non-AD was considered statistically significant. Boxed area shows the enlarged view of co-localization of GMF (green) with 6E10 (red) and p-tau (red) Scale bar = 50μm and AU (Arbitrary Unit). (B&D) Quantification of 6E10, p-tau and GMF based on average labeled intensity and labeled positive area in AD and non-AD brains.
Fig 3
Fig 3
Co-localization of NLRP3 with Aβ, p-tau and GMF in temporal cortex of AD and non-AD brain. (A) Sections were immunostained with anti-NLRP3 and 6E10 respectively. Representative immunofluorescence staining displayed the higher expression and co-localization of NLRP3 (green) and 6E10 (red) in AD as compared with non-AD. (C) Sections were immunostained with NLRP3 and with anti-p-tau respectively to check the co-localization of NLRP3 with p-tau. Representative immunofluorescence staining displayed the higher expression and co-localization of NLRP3 (green) and p-tau (red) in AD compared with non-AD. (E) Sections were immunostained with NLRP3 with GMF respectively to check the co-localization of NLRP3 with GMF. Representative immunofluorescence staining displayed the higher expression and co-localization of NLRP3 (green) and GMF (red) in AD compared with non-AD (F). The values are expressed as mean ± standard error each group (n= 3–5). *p <0.05 versus non-AD was considered statistically significant. Zoom of boxed area showed the enlarge view of co-localization of NLRP3 (green) with 6E10 (red), p-tau (red) and GMF (red) Scale bar = 50 μm and AU (Arbitrary Unit). (B, D, F) Quantification of NLRP3, 6E10, p-tau and GMF based on average labeled intensity and labeled positive area in AD and non-AD brains.
Fig 4
Fig 4
Co-localization of caspase-1 with Aβ, p-tau and GMF in the temporal cortex of AD and non-AD brain. (A) Sections were immunostained with anti-caspase-1 and 6E10 respectively. Representative immunofluorescence staining display the higher expression and co-localization of caspase-1 (green) and 6E10 (red) in AD as compared with non-AD. (C) Sections were immunostained with anti-caspase-1 and anti-p-tau respectively to check the co-localization of caspase-1 with p-tau. Representative immunofluorescence staining displayed the higher expression and co-localization of caspase-1(green) and p-tau (red) in AD compared with non-AD. (E) Sections were immunostained with anti-caspase-1 and anti-GMF respectively to check the co-localization of caspase-1with GMF. Representative immunofluorescence staining displayed the higher expression and co-localization of caspase-1(green) and GMF (red) in AD compared with non-AD. The values are expressed as mean ± standard error, from each group (n= 3–5). *p <0.05 versus non-AD was considered statistically significant. Zoom of boxed area showed the enlarge view of co-localization of caspase-1 (green) with 6E10 (red), p-tau (red) and GMF (red) Scale bar = 50 μm and AU (Arbitrary Unit). (B, D, F) Quantification of Caspase-1, 6E10, p-tau and GMF based on average labeled intensity and labeled positive area in AD and non-AD brains.
Fig 5
Fig 5
Co-localization of IL-1β with Aβ, p-tau and GMF in temporal cortex of AD and non-AD brain. (A) Sections were immunostained with anti-IL-1β and 6E10 respectively. Representative immunofluorescence staining display the higher expression and co-localization of IL-1β (green) and 6E10 (red) in AD as compared with non-AD. (C) Sections were immunostained withanti-IL-1β and with anti-p-tau respectively to check the co-localization of IL-1β with p-tau. Representative immunofluorescence staining display the higher expression and co-localization of IL-1β (green) and p-tau (red) in AD compared with Non-AD (E) Sections were immunostained with anti-IL-1β and anti-GMF respectively to check the co-localization of IL-1β with GMF. Representative immunofluorescence staining display the higher expression and co-localization of IL-1β (green) and GMF (red) in AD compared with non-AD. Data are expressed as mean ± standard error, from each group (n= 3–5). *p <0.05 versus non-AD was considered statistically significant. Zoom of boxed area showed the enlarge view of co-localization of IL-1β (green) with 6E10 (red), p-tau (red) and GMF (red) Scale bar = 50 μm and AU (Arbitrary Unit). (B, D, F) Quantification of IL-1β, 6E10, p-tau and GMF based on average labeled intensity and labeled positive area in AD and non-AD brains.
Fig 6
Fig 6
Co-localization of IL-18 with Aβ, p-tau and GMF in temporal cortex of AD and non-AD brain. (A) Sections were immunostained with anti-IL-18 and 6E10 respectively. Representative immunofluorescence staining display the higher expression and co-localization of IL-18 (green) and 6E10 (red) in AD as compared with non-AD. (C) Sections were immunostained with anti-IL-18and with anti-p-tau respectively to check the co-localization of IL-18 with p-tau. Representative immunofluorescence staining display the higher expression and co-localization of IL-18 (green) and p-tau (red) in AD compared with non-AD. (E) Sections were immunostained with anti-IL-18 and anti-GMF respectively to check the co-localization of IL-18 with GMF. Representative immunofluorescence staining display the higher expression and co-localization of IL-18 (green) and GMF (red) in AD compared with non-AD. Data were analyzed as mean ± standard error, from each group (n= 3–5). *p <0.05 versus non-AD was considered statistically significant. Zoom of boxed area showed the enlarge view of co-localization of IL-18 (green) with 6E10 (red), p-tau (red) and GMF (red) Scale bar = 50 μm and AU (Arbitrary Unit). (B, D, F) Quantification of IL-18, 6E10, p-tau and GMF based on average labeled intensity and labeled positive area in AD and non-AD brains.
Fig 7
Fig 7
Accumulation of autophagy marker (LC3) and co-localization with Aβ, p-tau and GMF in the temporal cortex of AD and non-AD brain (A) Sections immunostained with anti-LC3 and E10, respectively displayed higher accumulation and co-localization of LC3 and 6E10 in AD compared with non-AD. (C) Sections immunostained with anti-LC3 and anti-p-tau respectively, displayed higher accumulation and co-localization of LC3 with p-tau in AD compared with non-AD. (E) Sections immunostained with anti-LC3 and anti-GMF respectively, displayed higher accumulation and co-localization of LC3 with GMF in AD compared with non-AD. Data were analyzed as mean ± standard error, from each group (n= 3–5). *p <0.05 versus non-AD was considered statistically significant. Zoom of boxed area showed the enlarge view of co-localization of LC3 (red) with 6E10 (green), p-tau (green) and GMF (green) Scale bar = 50 μm and AU (Arbitrary Unit). (B, D, F) Quantification of LC3, 6E10, p-tau and GMF based on average labeled intensity and labeled positive area in AD and non-AD brains.
Fig 8
Fig 8
The autophagy marker SQSTM1/p62 accumulates and co-localizes with Aβ marker 6E10 p-tau and GMF in the temporal cortex of human AD compared to non-AD brain. (A) Sections were double immunofluorescence stained with anti-SQSTM1/p62 (red) and 6E10 (green), respectively and displayed higher accumulation and co-localization of SQSTM1/p62 and 6E10 in AD compared with non-AD. (C) Sections were immunostained with anti-SQSTM1/p62 and anti-p-tau respectively and displayed higher accumulation and co-localization of SQSTM1/p62with p-tau in AD compared with non-AD (E) Sections were immunostained with anti-SQSTM1/p62 and anti-GMF respectively and displayed higher accumulation and co-localization of SQSTM1/p62 with GMF in AD compared with non-AD. Data were analyzed as mean ± standard error, from each group (n= 3–5). *p <0.05 versus non-AD was considered statistically significant. Zoom of boxed area showed the enlarge view of co-localization of SQSTM1/p62 (red) with 6E10 (green), p-tau (green) and GMF (green) Scale bar = 50 μm and AU (Arbitrary Unit). (B, D, F) Quantification of SQSTM1/p62, 6E10, p-tau and GMF based on average labeled intensity and labeled positive area in AD and non-AD brains.
Fig 9
Fig 9
Accumulation of lysosomal marker (LAMP1) and co-localization with Aβ marker, 6E10, p-tau and GMF. Double immunofluorescence staining on postmortem brain temporal cortex of AD and non-AD brain. (A) Sections immunostained with anti-LAMP1 and 6E10, respectively displayed higher accumulation and co-localization of LAMP1 and 6E10 in AD compared with non-AD. (C) Sections immunostained with anti-LAMP1 and anti-p-tau respectively, displayed higher accumulation and co-localization of LAMP1 with p-tau in AD compared with non-AD. (E) Sections immunostained with anti-LAMP1 and anti-GMF respectively, displayed higher accumulation and co-localization of LAMP1 with GMF in AD compared with non-AD Data were analyzed as mean ± standard error, from each group (n= 3–5). *p <0.05 versus non-AD was considered statistically significant. Zoom of boxed area showed the enlarge view of co-localization of LAMP1 (red) with 6E10 (green), p-tau (green) and GMF (green) Scale bar = 50 μm and AU (Arbitrary Unit). (B, D, F) Quantification of LAMP1, 6E10, p-tau and GMF based on average labeled intensity and labeled positive area in AD and non-AD brains.

References

    1. Xiong Z, Thangavel R, Kempuraj D, Yang E, Zaheer S, Zaheer A. Alzheimer’s disease: evidence for the expression of interleukin-33 and its receptor ST2 in the brain. J Alzheimers Dis. 2014;40:297–308. - PMC - PubMed
    1. Morris M, Knudsen GM, Maeda S, Trinidad JC, Ioanoviciu A, Burlingame AL, Mucke L. Tau post-translational modifications in wild-type and human amyloid precursor protein transgenic mice. Nat Neurosci. 2015;18:1183–1189. - PMC - PubMed
    1. Sage MD, Gavin JB. Microvascular function at the margins of early experimental myocardial infarcts in isolated rabbit hearts. Heart Vessels. 1986;2:81–86. - PubMed
    1. Guo JP, Arai T, Miklossy J, McGeer PL. Abeta and tau form soluble complexes that may promote self aggregation of both into the insoluble forms observed in Alzheimer’s disease. Proc Natl Acad Sci U S A. 2006;103:1953–1958. - PMC - PubMed
    1. Ko TM, Tzeng SJ, Hsieh FJ, Chu JS. Acardius anceps: report of 3 cases. Asia Oceania J Obstet Gynaecol. 1991;17:49–56. - PubMed

MeSH terms

Substances

LinkOut - more resources