. 2018 Feb;25(2):255-267.
doi: 10.1038/cdd.2017.152. Epub 2017 Oct 6.

Oxidative stress promotes SIRT1 recruitment to the GADD34/PP1α complex to activate its deacetylase function

Affiliations

Oxidative stress promotes SIRT1 recruitment to the GADD34/PP1α complex to activate its deacetylase function

Irene Chengjie Lee et al. Cell Death Differ. 2018 Feb.

Abstract

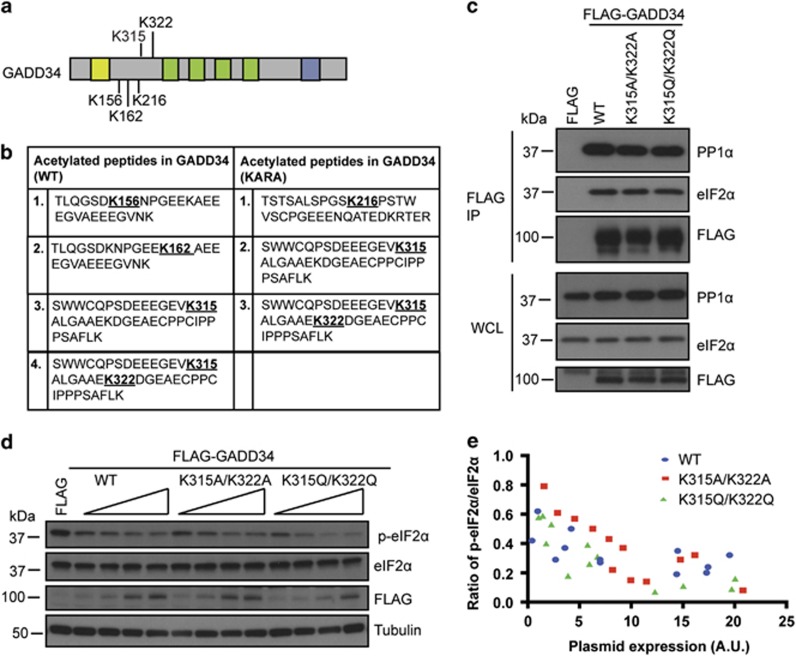
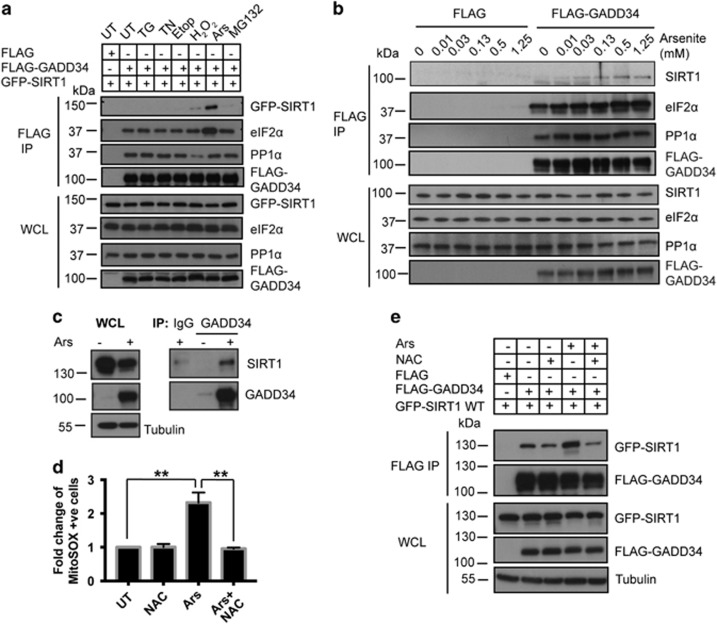
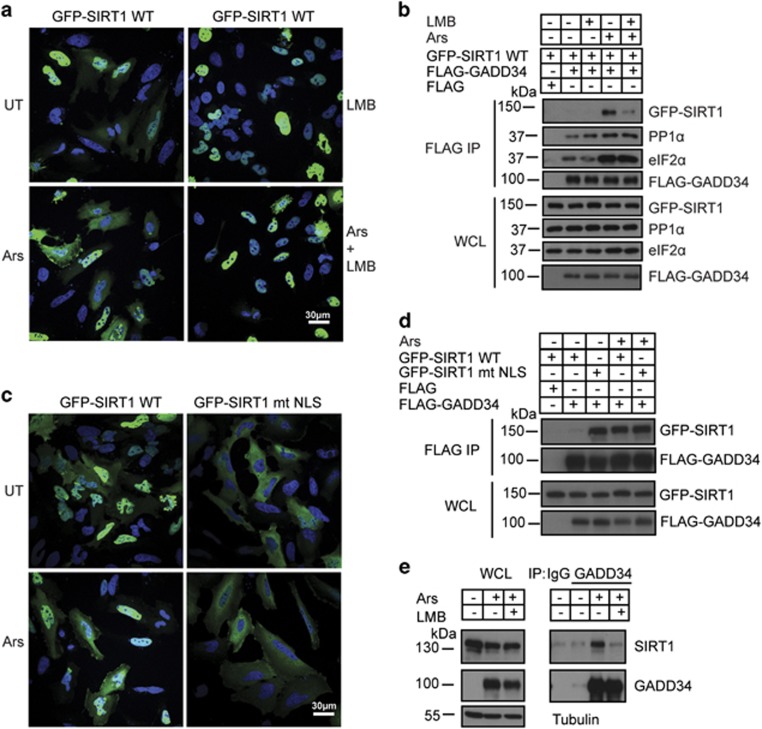
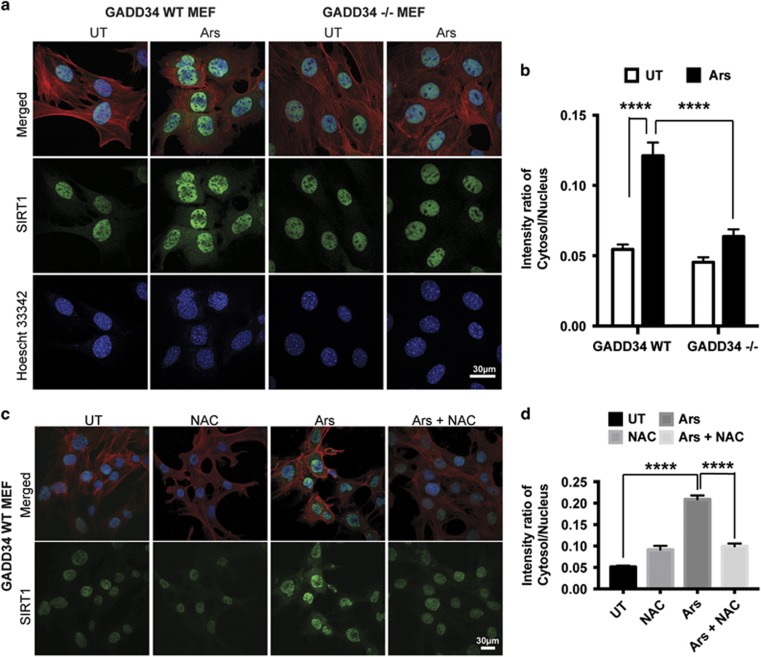
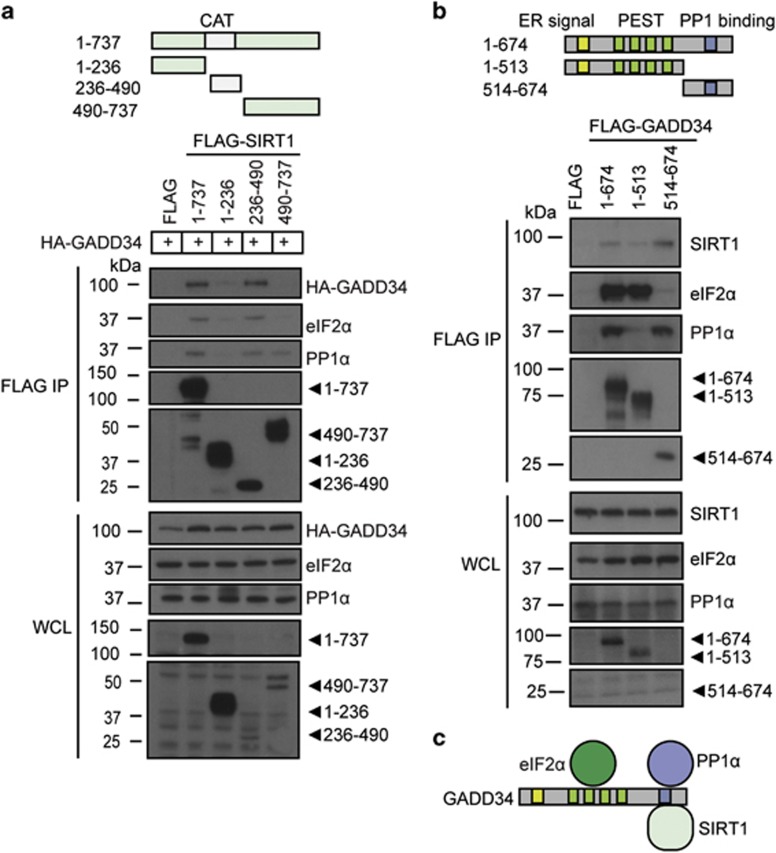
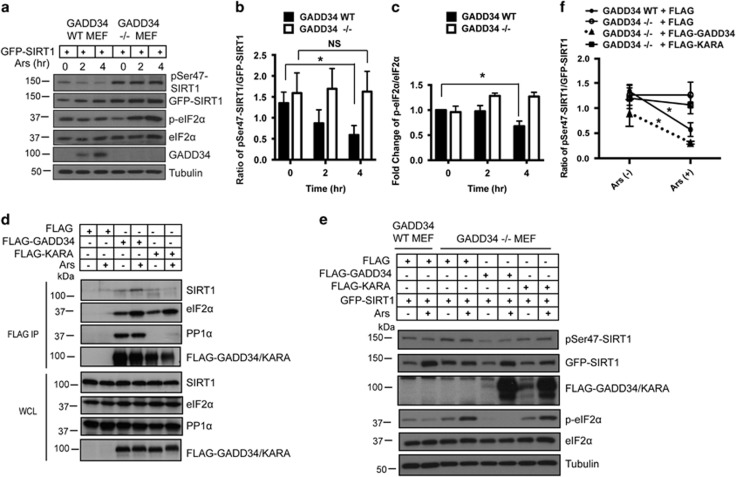
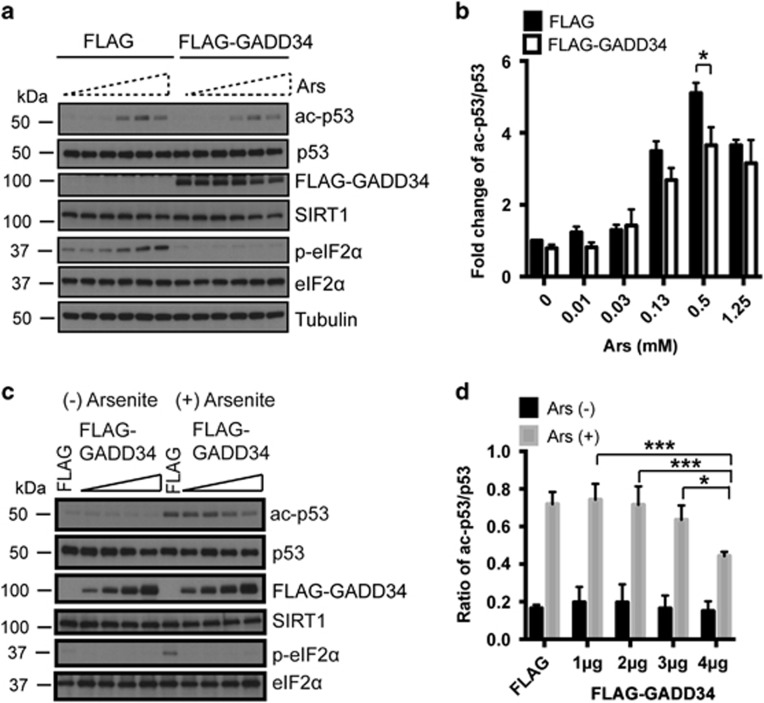
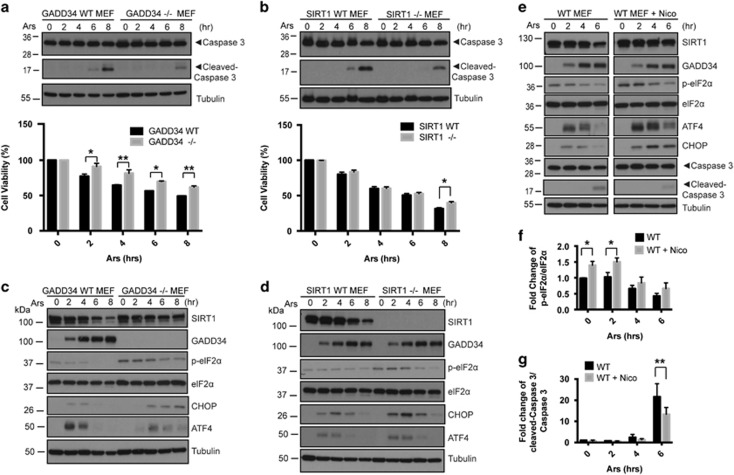
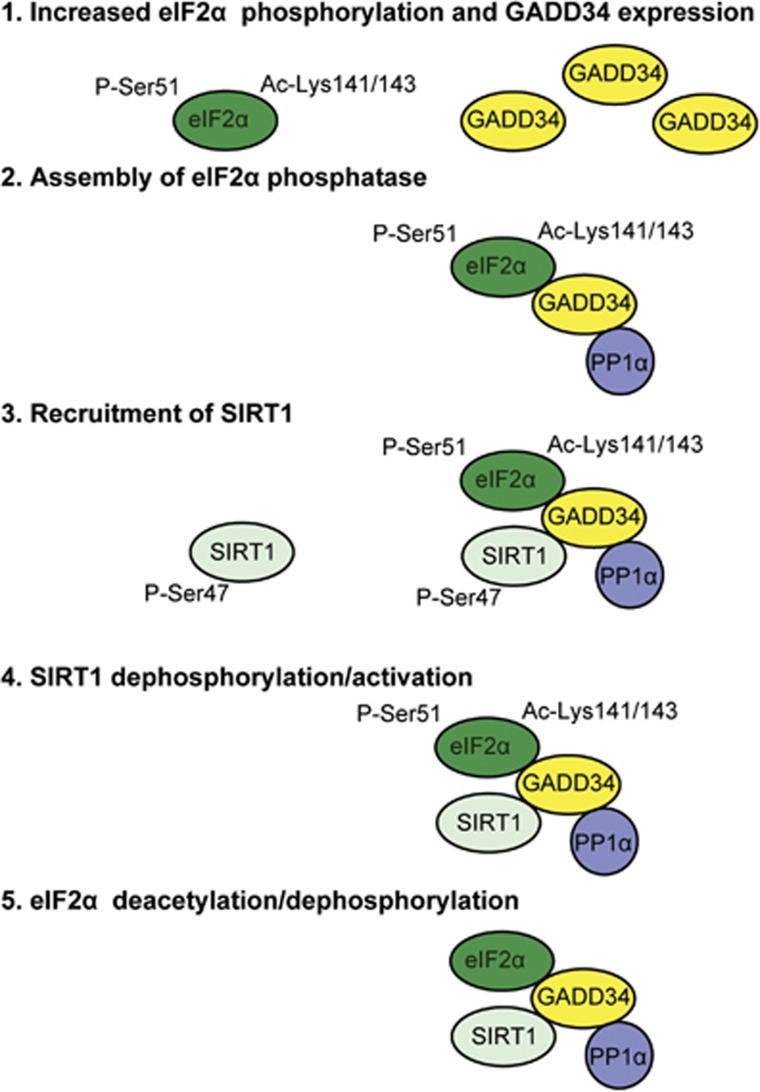
Phosphorylation of the eukaryotic translation initiation factor, eIF2α, by stress-activated protein kinases and dephosphorylation by the growth arrest and DNA damage-inducible protein (GADD34)-containing phosphatase is a central node in the integrated stress response. Mass spectrometry demonstrated GADD34 acetylation at multiple lysines. Substituting K315 and K322 with alanines or glutamines did not impair GADD34's ability to recruit protein phosphatase 1α (PP1α) or eIF2α, suggesting that GADD34 acetylation did not modulate eIF2α phosphatase activity. Arsenite (Ars)-induced oxidative stress increased cellular GADD34 levels and enhanced Sirtuin 1 (SIRT1) recruitment to assemble a cytoplasmic complex containing GADD34, PP1α, eIF2α and SIRT1. Induction of GADD34 in WT MEFs paralleled the dephosphorylation of eIF2α (phosphoserine-51) and SIRT1 (phosphoserine-47). By comparison, eIF2α and SIRT1 were persistently phosphorylated in Ars-treated GADD34-/- MEFs. Expressing WT GADD34, but not a mutant unable to bind PP1α in GADD34-/- MEFs restored both eIF2α and SIRT1 dephosphorylation. SIRT1 dephosphorylation increased its deacetylase activity, measured in vitro and in cells. Loss of function of GADD34 or SIRT1 enhanced cellular p-eIF2α levels and attenuated cell death following Ars exposure. These results highlighted a novel role for the GADD34/PP1α complex in coordinating the dephosphorylation and reactivation of eIF2α and SIRT1 to determine cell fate following oxidative stress.


Conflict of interest statement

The authors declare no conflict of interest.

Figures

Figure 1
Figure 1
GADD34 is acetylated. (a) Schematic of the GADD34 protein with acetylated lysines (K). The N-terminal ER localization sequence is denoted by yellow box. The central PEST repeats are represented as green boxes and the C-terminal blue box represents the PP1-binding domain. (b) Mass spectrometry of FLAG-GADD34 (WT) or FLAG-GADD34 (KARA) immunoprecipitates (IP) from cells treated with or without 5 mM nicotinamide for 6 h identified acetylated peptides with sequences as shown. (c) HEK293 cells expressing FLAG-GADD34 (WT) and mutants, FLAG-K312A/K322A and FLAG-K315Q/K322Q, were subjected to immunoprecipitation using anti-FLAG antibody. Immunoprecipitates (IP) and whole cell lysates (WCL) were analyzed for endogenous eIF2α, PP1α and FLAG-GADD34 by immunoblotting. Molecular weight markers (kDa) are shown. (d) HEK293 cells expressing the FLAG epitope and increasing amounts of FLAG-GADD34 WT or FLAG-K315A/K322A and FLAG-K315Q/K322Q mutation were analyzed for eIF2α dephosphorylation. Cells were immunoblotting for eIF2α, p-eIF2α, FLAG-GADD34 and tubulin. (e) Quantitation of p-eIF2α/eIF2α ratio in cells expressing increasing amounts of the WT FLAG-GADD34, FLAG-K315A/K322A and FLAG-K315Q/K322Q (expressed in arbituary units, A.U.) from 4 independent experiments each consisting of 12 data points
Figure 2
Figure 2
Ars enhances SIRT1 association with GADD34. (a) HEK293 cells expressing FLAG-GADD34 were subjected to the following stresses for 1 h (hr): TG, TN, Etop, H2O2, Ars and MG132 before immunoprecipitations (IP) using anti-FLAG antibody. IP and WCL were immunoblotted for GFP-SIRT1, FLAG-GADD34, eIF2α and PP1α. Molecular weight markers (kDa) are shown. (b) HEK293 cells expressing the FLAG peptide or FLAG-GADD34 were subjected to increasing Ars concentrations for 1 h before IP using anti-FLAG. IP and WCL were immunoblotted for SIRT1, eIF2α, PP1α and FLAG-GADD34. (c) Anti-GADD34 immunoprecipitates from WT MEFs treated with Ars (50 μM, 5 h) or UT were immunoblotted for SIRT1 and GADD34. Control IgG antibody was included for control IP. Tubulin was used as loading control. (d) HEK293 cells, exposed to antioxidant, NAC (20 mM, 2 h), or Ars (0.5 mM, 1 h) or NAC (20 mM, 1 h) before Ars (0.5 mM, 1 h), were stained using mitochondrial ROS-detecting dye, MitoSOX. MitoSOX-stained cells were quantified by FACS and represented as fold change compared with UT HEK293 (mean±S.E.M., n=3). Sidak’s multiple comparisons test was used after two-way ANOVA to generate P-values (**P<0.01). (e) Anti-FLAG immunoprecipitations from HEK293 cells co-expressing FLAG-GADD34 and GFP-SIRT1 WT either UT (−) or following treatment with NAC, Ars or NAC and Ars as described in d were analyzed. IP and WCL were immunoblotted for GFP-SIRT1 and FLAG-GADD34. Tubulin was used as a loading control. Molecular weight markers (kDa) are shown
Figure 3
Figure 3
Cytosolic SIRT1 Binds GADD34. (a) Subcelullar distribution of GFP-SIRT1 wild-type (WT) in HeLa cells is shown under UT conditions and after Ars (0.5 mM, 1 h) treatment. LMB (10 nM, 3 h), or LMB (10 nM, 2 h) pretreatment before Ars (0.5 mM, 1 h) exposure are also shown. GFP-SIRT1 is shown in green with nuclear staining by Hoescht 33342 in blue. Scale bar, 30 μm. (b) Anti-FLAG immunoprecipitations from HEK293 cells co-expressing FLAG-GADD34 and GFP-SIRT1, either UT (−) or following treatment with LMB, Ars or both LMB and Ars, as described in a, were analyzed for GFP-SIRT1, FLAG-GADD34, eIF2α and PP1α by immunoblotting IPs and WCL with appropriate antibodies. (c) Subcellular distribution of GFP-SIRT1 wild-type (WT) and mutant GFP-SIRT1 lacking the NLS (mt NLS) are shown in HeLa cells either UT or after Ars (0.5 mM, 1 h) treatment. GFP-SIRT1 is shown in green and nuclear staining by Hoescht 33342 in blue. Scale bar, 30 μm. (d) HEK293 cells coexpressing FLAG-GADD34 and either GFP-SIRT1 WT or GFP-SIRT1 mt NLS UT or following Ars treatment (0.5 mM, 1 h) were subjected immunoprecipitations using anti-FLAG. The GFP-SIRT1 proteins and FLAG-GADD34 in IP and WCL were analyzed by immunoblotting as described in methods. (e) Anti-GADD34 immunoprecipitates from WT MEFs either UT (−) or following treatment with Ars (50 μM, 5 h) or LMB (10 nM, 1 h) pretreatment before exposure to Ars (50 μM, 5 h) were immunoblotted with anti-SIRT1 and anti-GADD34 antibodies. Control IgG was included as control. Tubulin was used a loading control
Figure 4
Figure 4
GADD34 contributes to SIRT1 localization in cytoplasm. (a) Immunohistochemistry assessed the subcellular distribution of SIRT1 (green) in WT and GADD34−/− MEFs either UT or following treatment with 50 μM Ars for 4 h. The nuclei were stained with Hoescht 33342 (blue) and cytoplasm outlined using Rhodamine-Phalloidin to stain filamentous actin (red). Scale bar, 30 μm. (b) The intensity of SIRT1 staining in nucleus and cytoplasm of WT and GADD34−/− MEFs before and after Ars treatment was quantified. (Mean±S.E.M., n≥15 cells). Tukey multiple comparison test was used after two-way ANOVA to generate P-values (****P<0.0001). (c) Immunohistochemistry assessed the subcellular distribution of SIRT1 (green) in WT MEFs either UT or NAC (20 mM, 5 h) or Ars (50 μM, 4 h), or pretreatment of NAC (20 mM, 1 h) before exposure to 50 μM Ars for 4 h. The nuclei were stained with Hoescht 33342 (blue) and cytoplasm outlined using Rhodamine-Phalloidin (red). Scale bar, 30 μm. (d) The intensity of SIRT1 staining in the nucleus and cytoplasm of WT MEFs subjected to various treatments as shown in c was quantified (mean±S.E.M., n≥70 cells). Tukey multiple comparison test was used after two-way ANOVA to generate P-values (****P<0.0001)
Figure 5
Figure 5
Domains of GADD34 and SIRT1 that mediate their association. (a) Schematic of SIRT1 and its deletion mutants used to map the GADD34-binding site. HA-GADD34 was coexpressed with either empty FLAG vector, full-length FLAG-SIRT1 (1-737) and selected SIRT1 fragments in HEK293 cells, which were treated with Ars (0.5 mM, 1 h). Following immunoprecipitations using anti-FLAG, IP and WCL were immunoblotted for HA-GADD34, FLAG-SIRT1, eIF2α and PP1α. Molecular weight markers (kDa) are shown. (b) Schematic of GADD34 and its deletion mutants used to map the SIRT1-binding site. FLAG-GADD34 polypeptides were immunoprecipitated from HEK293 cells treated with 0.5 mM Ars for 1 h using anti-FLAG. IP and WCL were immunoblotted for SIRT1, eIF2α, PP1α and FLAG-GADD34. (c) Schematic summarizing the binding sites on GADD34 for SIRT1, eIF2α and PP1α is shown. The N-terminal ER localization sequence in GADD34 is shown as yellow box, the central PEST repeats as green boxes and the C-terminal PP1-binding domain as a blue box
Figure 6
Figure 6
GADD34 promotes dephosphorylation of phosphoserine-47 on SIRT1. (a) WT or GADD34−/− MEFs expressing GFP-SIRT1 were treated with 50 μM Ars for 0, 2 and 4 h before immunoblotting for phosphoserine-47 SIRT1 (pSer47-SIRT1), GFP-SIRT1, phosphoserine-51 eIF2α (p-eIF2α), eIF2α, GADD34 and tubulin. (b) Ratio of pSer47-SIRT1/GFP-SIRT1 level in WT or GADD34−/− MEFs treated with Ars for indicated times is shown as a bar graph (mean±S.E.M., n=3 independent experiments). Tuke’s multiple comparison test was used after two-way ANOVA to generate P-values (*P<0.05, NS denotes not significant). (c) Fold change of p-eIF2α/eIF2α in WT or GADD34−/− MEFs treated with Ars for indicated times is shown as a bar graph (mean±S.E.M., n=3 independent experiments). Dunnett’s multiple comparisons test was used after two-way ANOVA to generate P-values (*P<0.05, NS denotes not significant). (d) HEK293 cells expressing FLAG empty vector, FLAG-GADD34 or FLAG KARA were either UT (−) or Ars-treated (+)before immunoprecipitations using anti-FLAG conjugated beads. IP and WCLs were immunoblotted for SIRT1, eIF2α, PP1α and the FLAG-GADD34. (e) GFP-SIRT1 was coexpressed with either empty FLAG vector, FLAG-GADD34 or FLAG-KARA in GADD34−/− MEFs. As control, GFP-SIRT1 was co-expressed with empty FLAG vector in WT MEFs. Transfected MEFs were UT (−) or treated with 50 μM Ars for 4 h and immunoblotted as described in a. (f) Ratio of pSer47-SIRT1/GFP-SIRT1 in WT or GADD34−/− MEFs expressing various FLAG plasmids with or without Ars treatment (mean±S.E.M., n=3). Sidak multiple comparison test was used after two-way ANOVA to generate P-values (*P<0.05)
Figure 7
Figure 7
GADD34 enhances SIRT1’s deacetylase activity. (a) HEK293 cells expressing FLAG-GADD34 were exposed to increasing concentrations of Ars (1 h) and immunoblotted for acetylated p53 (ac-p53), p53, SIRT1, eIF2α, p-eIF2α, FLAG-GADD34 and Tubulin. (b) Quantification of the fold-change in ac-p53/p53 in HEK293 cells expressing FLAG or FLAG-GADD34 in the presence of increasing Ars concentrations (mean±S.E.M., n=3). Sidak’s multiple comparison test was used after two-way ANOVA to generate P-values (*P<0.05). (c) HEK293 cells expressing either FLAG or increasing amounts of the FLAG-GADD34 plasmid DNA were treated either without or with Ars (0.5 mM, 1 h) before immunoblotting for ac-p53, p53, SIRT1, eIF2α, p-eIF2α and FLAG-GADD34. (d) Ratio of ac-p53/p53 level in HEK293 cells expressing FLAG or increasing amounts of FLAG-GADD34 either UT (Ars−) or Ars-treated (+). (Mean±S.E.M., n=3). Tukey’s multiple comparison test was used after two-way ANOVA to generate P-values (*P<0.05 and ***P<0.001)
Figure 8
Figure 8
Loss of function of GADD34 or SIRT1 attenuates apoptosis induced by Ars. (a) Top: WT and GADD34−/− MEFs were treated with 50 μM Ars for the indicated duration (hours) and immunoblotted for caspase 3, cleaved-caspase 3 and tubulin. Bottom: viability of WT and GADD34−/− MEFs was monitored over the time-course of the treatment with 50 μM Ars. (Mean±S.E.M., n=3). Sidak’s multiple comparison test was used after two-way ANOVA to generate P-values (*P<0.05, **P<0.01). Top: WT and SIRT1−/− MEFs were treated with 50 μM Ars for the indicated duration (hours) and cell lysates were immunoblotted for SIRT1, caspase 3, cleaved-caspase 3 and tubulin. (b) Bottom: viability of WT and SIRT1−/− MEFs was monitored over the time-course of the treatment with 50 μM Ars. (Mean±S.E.M., n=4 independent experiments). Sidak’s multiple comparison test was used after two-way ANOVA to generate P-values (*P<0.05). (c) WT and GADD34−/− MEFs were treated with 50 μM Ars for the indicated duration (hours) and immunoblotted for SIRT1, GADD34, p-eIF2α, eIF2α, ATF4, CHOP and tubulin. (d) WT and SIRT1−/− MEFs were treated with 50 μM Ars for the indicated duration (hours) and immunoblotted for SIRT1, GADD34, p-eIF2α, eIF2α, ATF4, CHOP and tubulin. (e) WT MEFs were treated with either 50 μM Ars for the indicated duration (hours) or pretreatment of Nicotinamide (Nico, 5 mM, overnight) following Ars exposure for the indicated duration (hours). Treated MEFs were immunoblotted with SIRT1, GADD34, p-eIF2α, eIF2α, ATF4, CHOP, caspase 3, cleaved-caspase 3 and tubulin. (f) Fold change of p-eIF2α/eIF2α in treated MEFs as described in e is shown as a bar graph (mean±S.E.M., n=3 independent experiments). Sidak’s multiple comparisons test was used after two-way ANOVA to generate P-values (*P<0.05). (g) Fold change of cleaved-caspase 3/caspase 3 in treated MEFs as described in e is shown as a bar graph (mean±S.E.M., n=3 independent experiments). Sidak’s multiple comparisons test was used after two-way ANOVA to generate P-values (**P<0.01)
Figure 9
Figure 9
Oxidative stress regulates eIF2α phosphorylation and dephosphorylation (The 5-STEP Model). Oxidative stress promotes eIF2α phosphorylation at serine-51, which is enhanced by the acetylation of lysines-141/143. In addition to increasing p-eIF2α, oxidative stress engages other as yet unknown mechanisms to elevate cellular GADD34 to much higher levels than seen with other stresses (STEP 1). Assembly of the GADD34/p-eIF2α/PP1α complex (STEP 2) enables eIF2α dephosphorylation and terminates ISR signaling. To ensure adequate downstream ISR signaling, we propose that acetylation of eIF2α at lysines 141/143 impedes the dephosphorylation by GADD34-bound PP1α. However, oxidative stress also recruits p-SIRT1, whose phosphorylation at serine-47 is enhanced by stress (STEP 3). Assembly of the new SIRT1/GADD34/eIF2α/PP1α complex enables SIRT1 dephosphorylation by the GADD34-bound PP1α and the resulting SIRT1 activation (STEP 4) catalyzes eIF2α deacetylation. This removes the brake on GADD34-bound PP1α and accelerates eIF2α dephosphorylation (STEP 5) to terminate ISR signaling. Thus, the coordination of eIF2α deacetylation with its dephosphorylation generates a delay that ensures the activation of the complex transcriptional and translational program known as ISR that is critical for cell survival

Similar articles

Cited by

References

    1. Wang M, Kaufman RJ. Protein misfolding in the endoplasmic reticulum as a conduit to human disease. Nature 2016; 529: 326–335. - PubMed
    1. Marciniak SJ, Yun CY, Oyadomari S, Novoa I, Zhang Y, Jungreis R et al. CHOP induces death by promoting protein synthesis and oxidation in the stressed endoplasmic reticulum. Genes Dev 2004; 18: 3066–3077. - PMC - PubMed
    1. Han J, Back SH, Hur J, Lin YH, Gildersleeve R, Shan J et al. ER-stress-induced transcriptional regulation increases protein synthesis leading to cell death. Nat Cell Biol 2013; 15: 481–490. - PMC - PubMed
    1. Pakos-Zebrucka K, Koryga I, Mnich K, Ljujic M, Samali A, Gorman AM. The integrated stress response. EMBO Rep 2016; 17: 1374–1395. - PMC - PubMed
    1. Novoa I, Zeng H, Harding HP, Ron D. Feedback inhibition of the unfolded protein response by GADD34-mediated dephosphorylation of eIF2alpha. J Cell Biol 2001; 153: 1011–1022. - PMC - PubMed

Publication types