Net Evolutionary Loss of Residue Polarity in Drosophilid Protein Cores Indicates Ongoing Optimization of Amino Acid Composition
- PMID: 28985302
- PMCID: PMC5737390
- DOI: 10.1093/gbe/evx191
Net Evolutionary Loss of Residue Polarity in Drosophilid Protein Cores Indicates Ongoing Optimization of Amino Acid Composition
Abstract
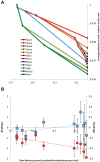
Amino acid frequencies in proteins may not be at equilibrium. We consider two possible explanations for the nonzero net residue fluxes in drosophilid proteins. First, protein interiors may have a suboptimal residue composition and be under a selective pressure favoring stability, that is, leading to the loss of polar (and the gain of large) amino acids. One would then expect stronger net fluxes on the protein interior than at the exposed sites. Alternatively, if most of the polarity loss occurs at the exposed sites and the selective constraint on amino acid composition at such sites decreases over time, net loss of polarity may be neutral and caused by disproportionally high occurrence of polar residues at exposed, least constrained sites. We estimated net evolutionary fluxes of residue polarity and volume at sites with different solvent accessibility in conserved protein families from 12 species of Drosophila. Net loss of polarity, miniscule in magnitude, but consistent across all lineages, occurred at all sites except the most exposed ones, where net flux of polarity was close to zero or, in membrane proteins, even positive. At the intermediate solvent accessibility the net fluxes of polarity and volume were similar to neutral predictions, whereas much of the polarity loss not attributable to neutral expectations occurred at the buried sites. These observations are consistent with the hypothesis that residue composition in many proteins is structurally suboptimal and continues to evolve toward lower polarity in the protein interior, in particular in proteins with intracellular localization. The magnitude of polarity and volume changes was independent from the protein's evolutionary age, indicating that the approach to equilibrium has been slow or that no such single equilibrium exists.
Keywords: Drosophila; residue polarity; residue volume; selection; solvent accessibility; stability.
Published by Oxford University Press on behalf of the Society for Molecular Biology and Evolution 2017. This work is written by US Government employees and is in the public domain in the US. This Open Access article contains public sector information licensed under the Open Government Licence v2.0 (http://www.nationalarchives.gov.uk/doc/open-government-licence/version/2/).
Figures


Similar articles
-
Evolutionary patterns of amino acid substitutions in 12 Drosophila genomes.BMC Genomics. 2010 Dec 2;11 Suppl 4(Suppl 4):S10. doi: 10.1186/1471-2164-11-S4-S10. BMC Genomics. 2010. PMID: 21143793 Free PMC article.
-
Estimating the influence of selection on the variable amino acid sites of the cytochrome B protein functional domains.Mol Biol Evol. 2001 Jun;18(6):917-25. doi: 10.1093/oxfordjournals.molbev.a003892. Mol Biol Evol. 2001. PMID: 11371579
-
The evolution of small insertions and deletions in the coding genes of Drosophila melanogaster.Mol Biol Evol. 2013 Dec;30(12):2699-708. doi: 10.1093/molbev/mst167. Epub 2013 Sep 26. Mol Biol Evol. 2013. PMID: 24077769
-
Structural determinants of protein evolution are context-sensitive at the residue level.Mol Biol Evol. 2009 Oct;26(10):2387-95. doi: 10.1093/molbev/msp146. Epub 2009 Jul 13. Mol Biol Evol. 2009. PMID: 19597162
-
Extensive parallelism in protein evolution.Biol Direct. 2007 Aug 16;2:20. doi: 10.1186/1745-6150-2-20. Biol Direct. 2007. PMID: 17705846 Free PMC article.
Cited by
-
Integration of sulfate assimilation with carbon and nitrogen metabolism in transition from C3 to C4 photosynthesis.J Exp Bot. 2019 Aug 19;70(16):4211-4221. doi: 10.1093/jxb/erz250. J Exp Bot. 2019. PMID: 31124557 Free PMC article. Review.
-
A Shift in Aggregation Avoidance Strategy Marks a Long-Term Direction to Protein Evolution.Genetics. 2019 Apr;211(4):1345-1355. doi: 10.1534/genetics.118.301719. Epub 2019 Jan 28. Genetics. 2019. PMID: 30692195 Free PMC article.
References
-
- Baldwin RL. 2007. Energetics of protein folding. J Mol Biol. 371(2):283–301. - PubMed
-
- Bigelow CC. 1967. On the average hydrophobicity of proteins and the relation between it and protein structure. J Theor Biol. 16(2):187–211. - PubMed
-
- Cambillau C, Claverie JM.. 2000. Structural and genomic correlates of hyperthermostability. J Biol Chem. 275(42):32383–32386. - PubMed
Publication types
MeSH terms
Substances
LinkOut - more resources
Full Text Sources
Other Literature Sources
Molecular Biology Databases

