. 2017 Oct 1;57(4):690-704.
doi: 10.1093/icb/icx090.

The Effects of Captivity on the Mammalian Gut Microbiome

Affiliations

The Effects of Captivity on the Mammalian Gut Microbiome

Valerie J McKenzie et al. Integr Comp Biol. .

Abstract

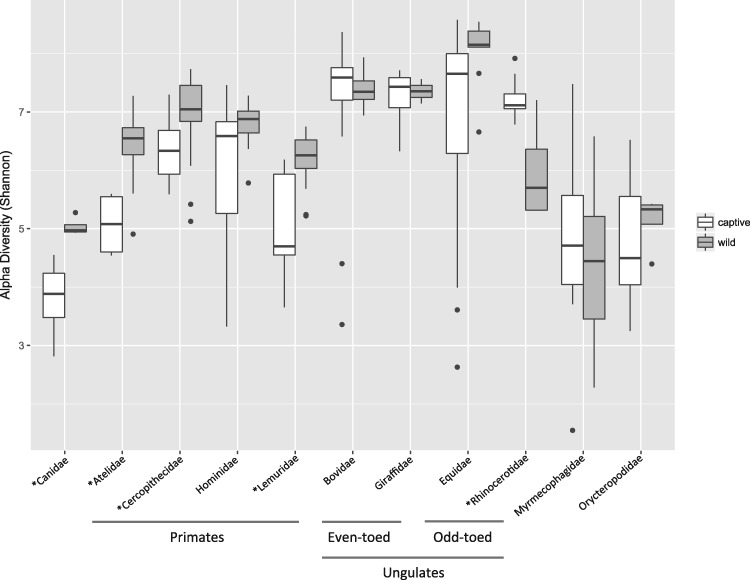
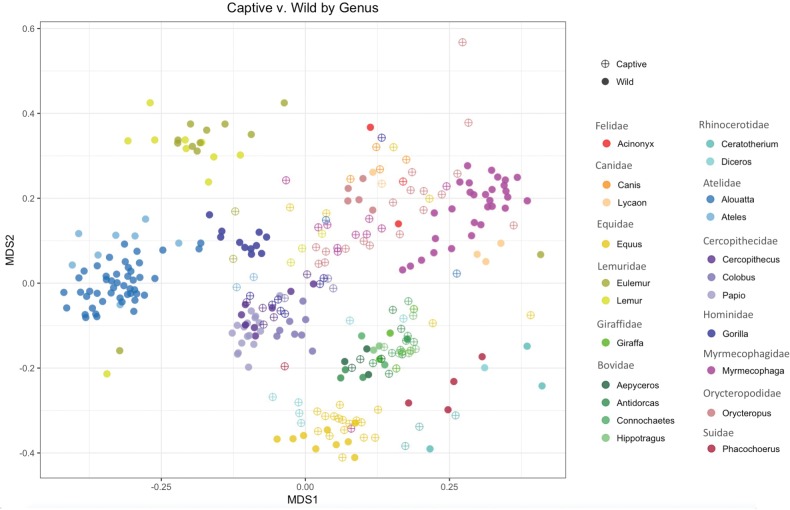
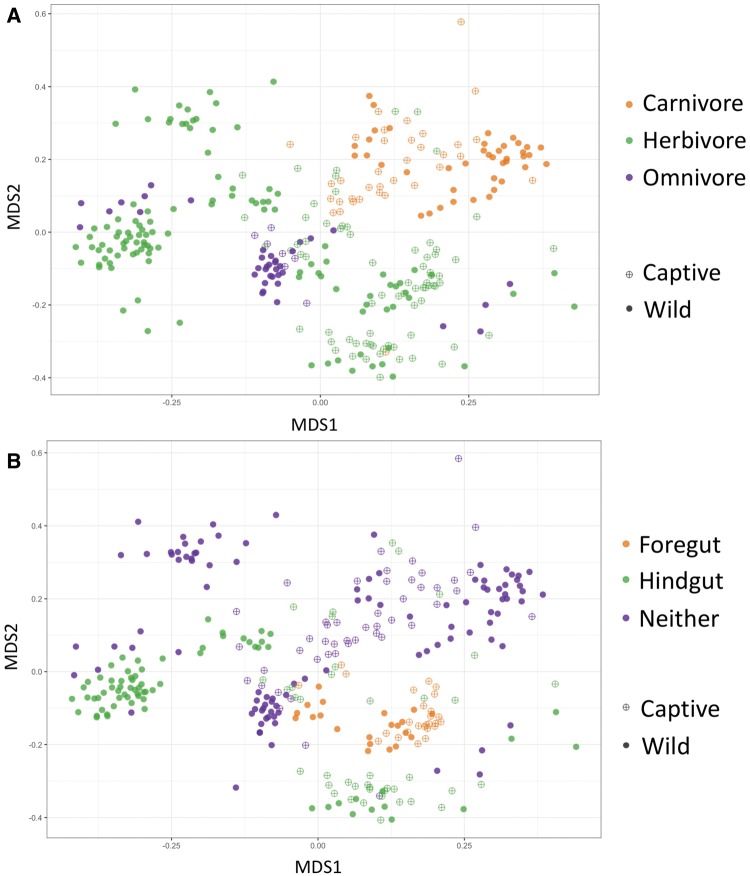
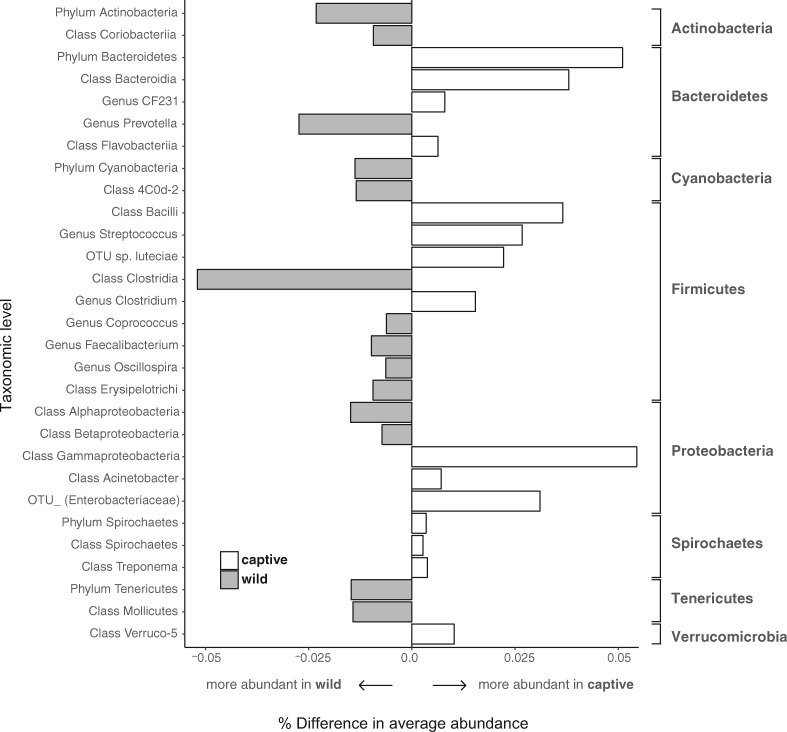
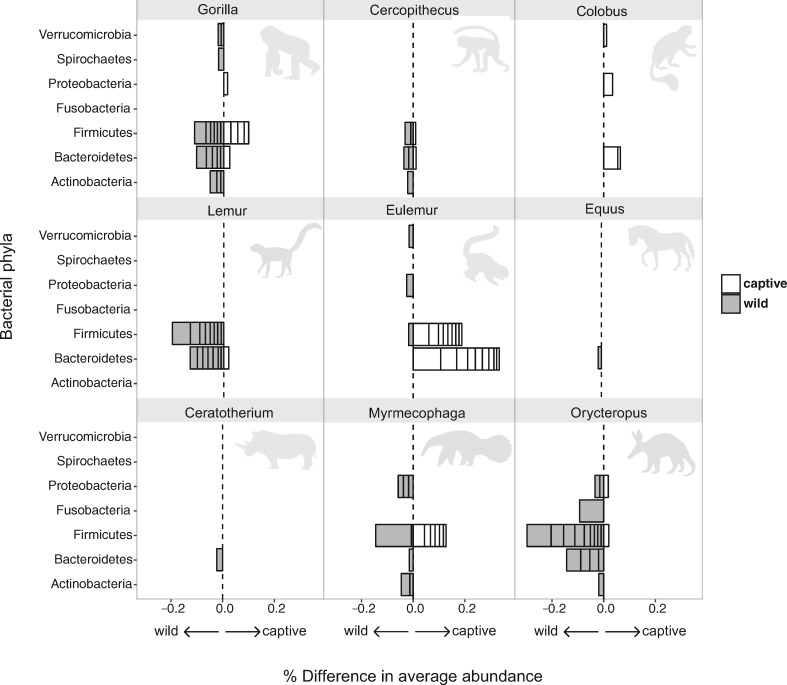
Recent studies increasingly note the effect of captivity or the built environment on the microbiome of humans and other animals. As symbiotic microbes are essential to many aspects of biology (e.g., digestive and immune functions), it is important to understand how lifestyle differences can impact the microbiome, and, consequently, the health of hosts. Animals living in captivity experience a range of changes that may influence the gut bacteria, such as diet changes, treatments, and reduced contact with other individuals, species and variable environmental substrates that act as sources of bacterial diversity. Thus far, initial results from previous studies point to a pattern of decreased bacterial diversity in captive animals. However, these studies are relatively limited in the scope of species that have been examined. Here we present a dataset that includes paired wild and captive samples from mammalian taxa across six Orders to investigate generalizable patterns of the effects captivity on mammalian gut bacteria. In comparing the wild to the captive condition, our results indicate that alpha diversity of the gut bacteria remains consistent in some mammalian hosts (bovids, giraffes, anteaters, and aardvarks), declines in the captive condition in some hosts (canids, primates, and equids), and increases in the captive condition in one host taxon (rhinoceros). Differences in gut bacterial beta diversity between the captive and wild state were observed for most of the taxa surveyed, except the even-toed ungulates (bovids and giraffes). Additionally, beta diversity variation was also strongly influenced by host taxonomic group, diet type, and gut fermentation physiology. Bacterial taxa that demonstrated larger shifts in relative abundance between the captive and wild states included members of the Firmicutes and Bacteroidetes. Overall, the patterns that we observe will inform a range of disciplines from veterinary practice to captive breeding efforts for biological conservation. Furthermore, bacterial taxa that persist in the captive state provide unique insight into symbiotic relationships with the host.


Figures

Fig. 1
Fig. 1
Gut bacterial alpha-diversity comparison between captive and wild mammals. Alpha-diversity was computed in QIIME using the Shannon diversity index per mammal family in the captive and wild state, respectively. See Table 1 for mammal species included in each family. Open bars represent alpha-diversity of microbes within captive hosts; shaded bars represent microbial alpha-diversity within wild hosts. Boxes represent 25–75% quantile with median (50% quantile) represented by a black line; points outside boxes indicate outliers. Two-tailed t-tests were used to compare captive versus wild for each mammal family. Asterisks denote significance: *Canidae (P = 0.0093), *Atelidae (P < 0.001), *Cercopithecidae (P = 0.011), Hominidae (P = 0.101), *Lemuridae (P = 0.0003), Bovidae (P = 0.55), Giraffidae (P = 0.81), Equidae (P = 0.061), *Rhinocerotidae (P = 0.0028), Myrmecophagidae (P = 0.358), Orycteropodidae (P = 0.448).
Fig. 2
Fig. 2
Nonmetric multi-dimensional scaling plot of mammal gut bacterial communities in the captive and wild state, by host genus. Open symbols (with cross-hatch) indicate captive individuals, and closed circles indicate wild individuals. The colors correspond with different mammal genera; similar colors were chosen for host genera of the same family (e.g., shades of navy blue belong to the family Atelidae). Statistical differences in the beta-diversity among captive versus wild per host genus are provided in Table 2.
Fig. 3
Fig. 3
Nonmetric multi-dimensional scaling plot of mammal gut bacterial communities in the captive and wild state, by host diet type (A) and host gut fermenter type (B). Host trait assignments are listed in Supplementary Table S1. Open circles (with cross hatch) indicate captive individuals, and closed circles indicate wild individuals. In a Permanova analysis, host diet type shown in A, as a sole factor, is a significant predictor of gut bacterial community similarity (P < 0.001, R2 = 0.075), as is host gut fermenter type shown in B (P < 0.001, R2 = 0.091). Beta-diversity differences between the captive versus wild state for these factors are shown in Table 2.
Fig. 4
Fig. 4
Differences in the average relative abundance of bacterial taxa between captive and wild hosts. Bars represent the percent difference in abundance of mean captive minus mean wild for each bacterial taxa across all mammal host samples. Shaded and open bars indicate significant increases of the relative abundances of specific bacterial taxa in the wild or in captivity, respectively (false discovery rate-corrected P < 0.05). Only those bacterial taxa with significant differences at the phyla, class, genus and OTU (97%-cutoff) levels are shown.
Fig. 5
Fig. 5
Differences in the relative abundance of bacterial phylotypes between captive and wild hosts, within host genera. Bacterial phylotypes were binned by phyla-level taxonomic identity for each genus plot. Within bins, each segment denotes a bacterial OTU (97%-cutoff) that differed significantly in average relative abundance (false discovery rate-corrected P < 0.05). Width of segments shows magnitude of difference in abundance, calculated as captive minus wild. Thus, the overall width of each phyla bin is the cumulative percent difference of significant bacterial OTUs. Shaded and open bars indicate bacterial OTUs with a higher relative abundance in the wild and in captive hosts, respectively. See Supplementary Table S3 for summary statistics and taxonomic identities of bacterial OTUs.

References

    1. Amato KR, Van Belle S, Di Fiore A, Estrada A, Stumpf R, White B, Nelson KE, Knight R, Leigh SR.. 2017. Patterns in gut microbiota similarity associated with degree of sociality among sex classes of a neotropical primate. Microb Ecol 1–9. - PubMed
    1. Amir A, McDonald D, Navas-Molina JA, Kopylova E, Morton JT, Zech Xu Z, Kightley EP, Thompson LR, Hyde ER, Gonzalez A, et al. 2017. Deblur rapidly resolves single-nucleotide community sequence patterns. mSystems 2:e00191–16. - PMC - PubMed
    1. Biagi E, Franceschi C, Rampelli S, Severgnini M, Ostan R, Turroni S, Consolandi C, Quercia S, Scurti M, Monti D, et al. 2016. Gut microbiota and extreme longevity. Curr Biol 26:1480–5. - PubMed
    1. Caporaso JG, Lauber CL, Walters WA, Berg-Lyons D, Huntley J, Fierer N, Owens SM, Betley J, Fraser L, Bauer M, et al. 2012. Ultra-high-throughput microbial community analysis on the Illumina HiSeq and MiSeq platforms. ISME J 6:1621–4. - PMC - PubMed
    1. Caporaso JG, Kuczynski J, Stombaugh J, Bittinger K, Bushman FD, Costello EK, Fierer N, Pena AG, Goodrich JK, Gordon JI, et al. 2010. QIIME allows analysis of high-throughput community sequencing data. Nat Methods 7:335–6. - PMC - PubMed

Publication types