

Small RNA profiling in Chlamydomonas: insights into chloroplast RNA metabolism
- PMID: 28985404
- PMCID: PMC5737564
- DOI: 10.1093/nar/gkx668
Small RNA profiling in Chlamydomonas: insights into chloroplast RNA metabolism
Abstract
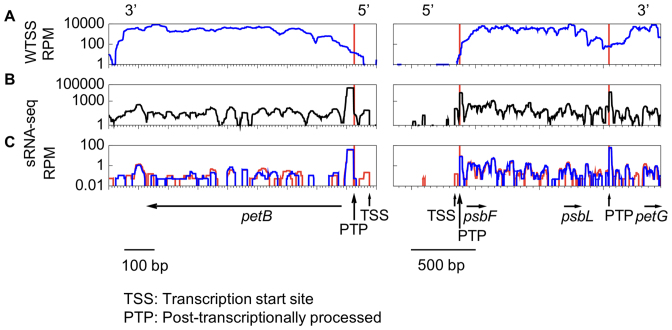
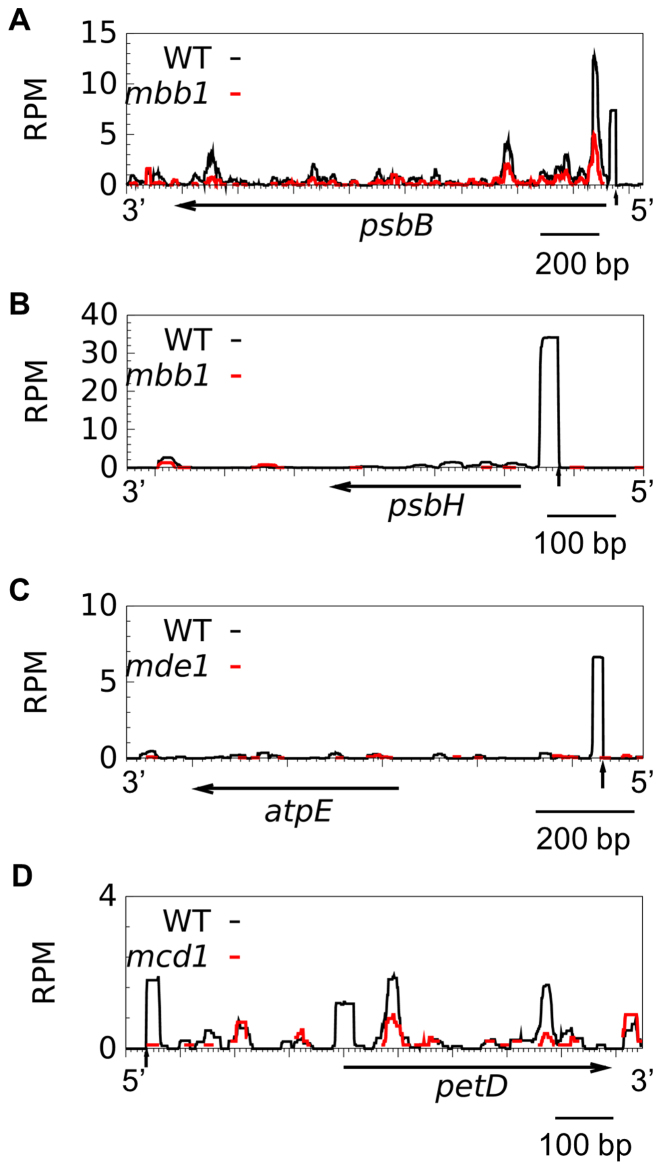
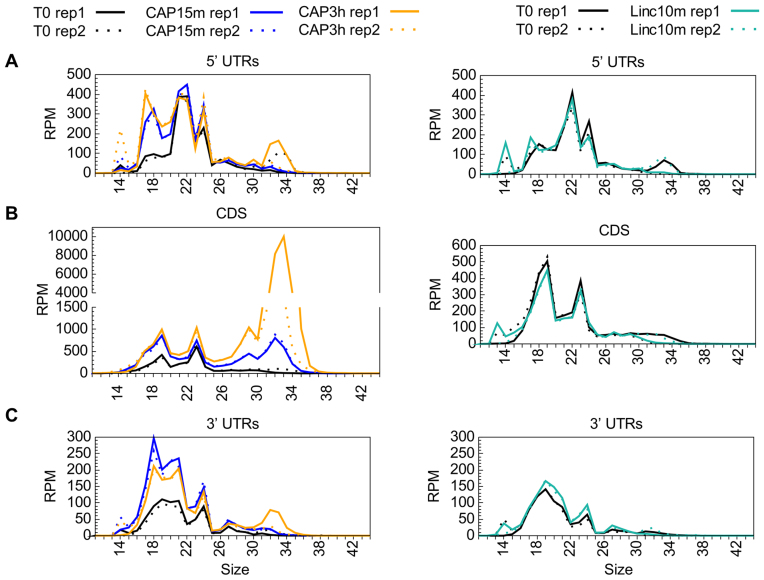
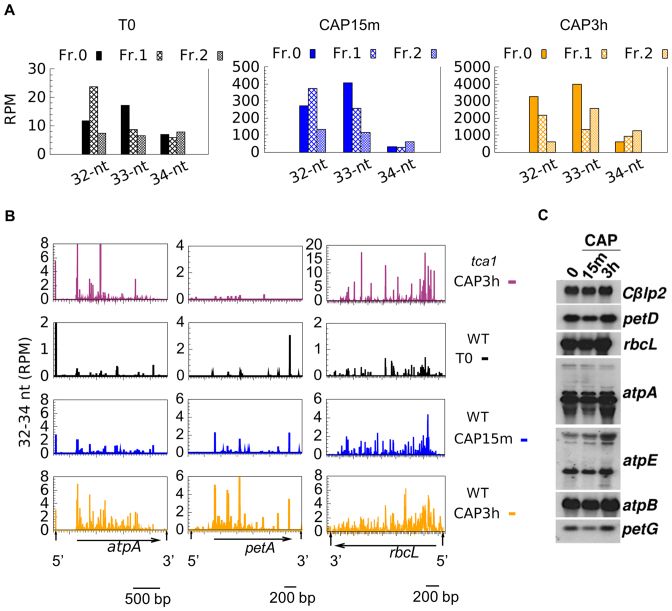
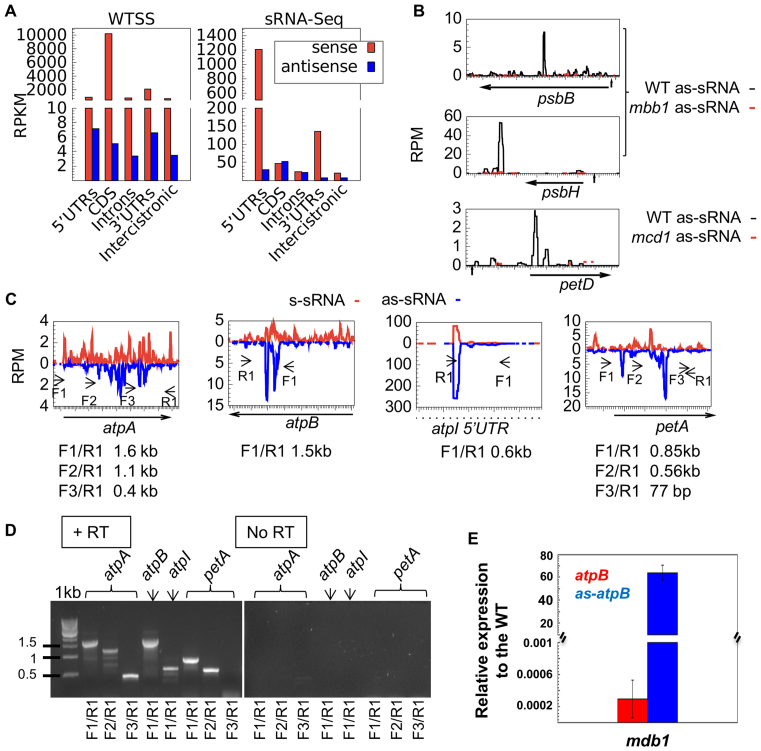
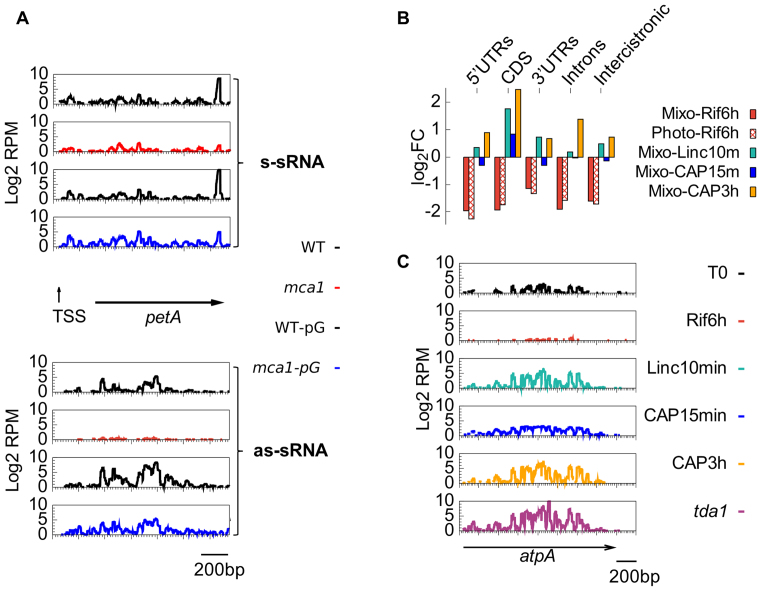
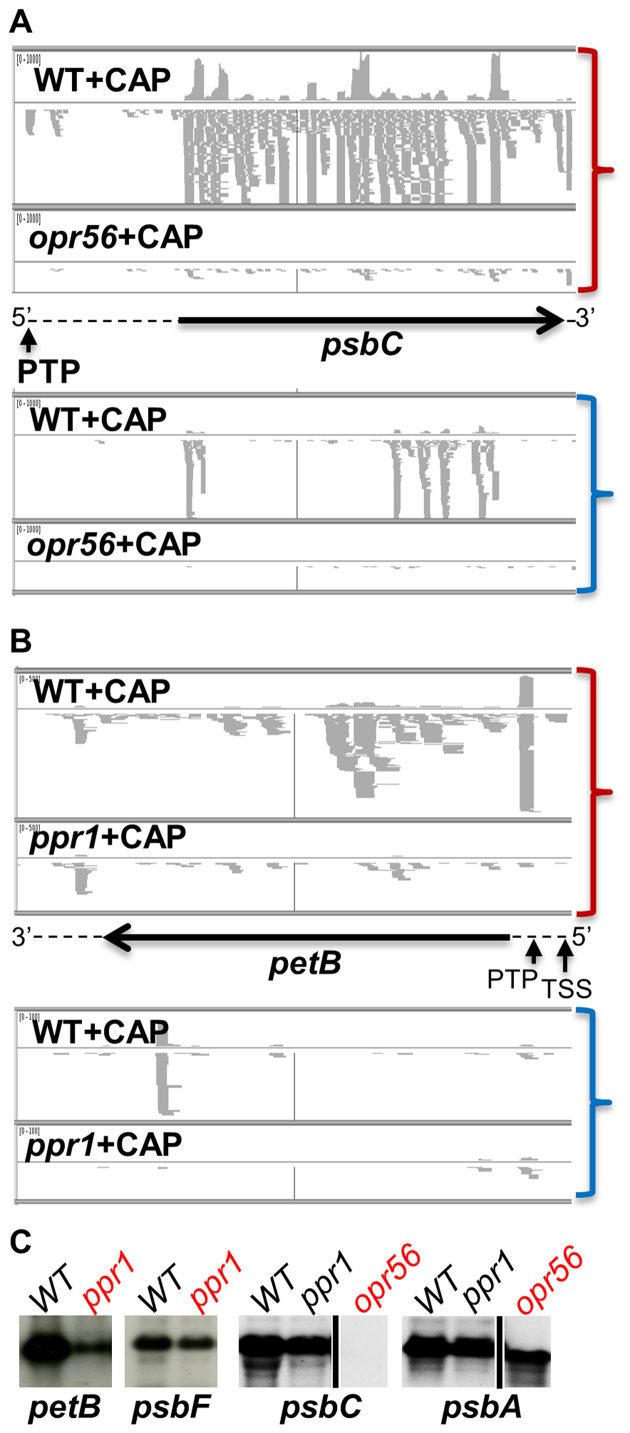
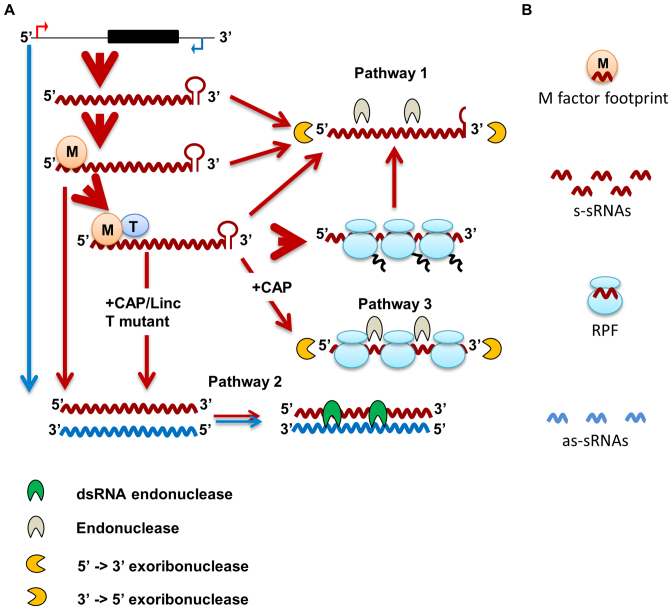
In Chlamydomonas reinhardtii, regulation of chloroplast gene expression is mainly post-transcriptional. It requires nucleus-encoded trans-acting protein factors for maturation/stabilization (M factors) or translation (T factors) of specific target mRNAs. We used long- and small-RNA sequencing to generate a detailed map of the transcriptome. Clusters of sRNAs marked the 5' end of all mature mRNAs. Their absence in M-factor mutants reflects the protection of transcript 5' end by the cognate factor. Enzymatic removal of 5'-triphosphates allowed identifying those cosRNA that mark a transcription start site. We detected another class of sRNAs derived from low abundance transcripts, antisense to mRNAs. The formation of antisense sRNAs required the presence of the complementary mRNA and was stimulated when translation was inhibited by chloramphenicol or lincomycin. We propose that they derive from degradation of double-stranded RNAs generated by pairing of antisense and sense transcripts, a process normally hindered by the traveling of the ribosomes. In addition, chloramphenicol treatment, by freezing ribosomes on the mRNA, caused the accumulation of 32-34 nt ribosome-protected fragments. Using this 'in vivo ribosome footprinting', we identified the function and molecular target of two candidate trans-acting factors.
© The Author(s) 2017. Published by Oxford University Press on behalf of Nucleic Acids Research.
Figures
Similar articles
-
Small RNAs reveal two target sites of the RNA-maturation factor Mbb1 in the chloroplast of Chlamydomonas.Nucleic Acids Res. 2014 Mar;42(5):3286-97. doi: 10.1093/nar/gkt1272. Epub 2013 Dec 11. Nucleic Acids Res. 2014. PMID: 24335082 Free PMC article.
-
On the complexity of chloroplast RNA metabolism: psaA trans-splicing can be bypassed in chlamydomonas.Mol Biol Evol. 2014 Oct;31(10):2697-707. doi: 10.1093/molbev/msu215. Epub 2014 Jul 22. Mol Biol Evol. 2014. PMID: 25053803
-
Two Chlamydomonas OPR proteins stabilize chloroplast mRNAs encoding small subunits of photosystem II and cytochrome b6 f.Plant J. 2015 Jun;82(5):861-73. doi: 10.1111/tpj.12858. Plant J. 2015. PMID: 25898982
-
Small regulatory RNAs in Archaea.RNA Biol. 2014;11(5):484-93. doi: 10.4161/rna.28452. Epub 2014 Mar 31. RNA Biol. 2014. PMID: 24755959 Free PMC article. Review.
-
New insights into small RNA-dependent translational regulation in prokaryotes.Trends Genet. 2013 Feb;29(2):92-8. doi: 10.1016/j.tig.2012.10.004. Epub 2012 Nov 6. Trends Genet. 2013. PMID: 23141721 Review.
Cited by
-
New Synthetic Operon Vectors for Expressing Multiple Proteins in the Chlamydomonas reinhardtii Chloroplast.Genes (Basel). 2023 Jan 31;14(2):368. doi: 10.3390/genes14020368. Genes (Basel). 2023. PMID: 36833295 Free PMC article.
-
The Algal Chloroplast as a Testbed for Synthetic Biology Designs Aimed at Radically Rewiring Plant Metabolism.Front Plant Sci. 2021 Sep 24;12:708370. doi: 10.3389/fpls.2021.708370. eCollection 2021. Front Plant Sci. 2021. PMID: 34630459 Free PMC article. Review.
-
Accelerating Chloroplast Engineering: A New System for Rapid Generation of Marker-Free Transplastomic Lines of Chlamydomonas reinhardtii.Microorganisms. 2023 Jul 31;11(8):1967. doi: 10.3390/microorganisms11081967. Microorganisms. 2023. PMID: 37630526 Free PMC article.
-
The OPR Protein MTHI1 Controls the Expression of Two Different Subunits of ATP Synthase CFo in Chlamydomonas reinhardtii.Plant Cell. 2020 Apr;32(4):1179-1203. doi: 10.1105/tpc.19.00770. Epub 2020 Jan 27. Plant Cell. 2020. PMID: 31988263 Free PMC article.
-
Full-length transcriptome analysis of Ophioglossum vulgatum: effects of experimentally identified chloroplast gene clusters on expression and evolutionary patterns.Plant Mol Biol. 2024 Mar 21;114(2):31. doi: 10.1007/s11103-024-01423-2. Plant Mol Biol. 2024. PMID: 38509284
References
-
- Martin W., Rujan T., Richly E., Hansen A., Cornelsen S., Lins T., Leister D., Stoebe B., Hasegawa M., Penny D.. Evolutionary analysis of Arabidopsis, cyanobacterial, and chloroplast genomes reveals plastid phylogeny and thousands of cyanobacterial genes in the nucleus. Proc. Natl. Acad. Sci. U.S.A. 2002; 99:12246–12251. - PMC - PubMed
-
- Eberhard S., Drapier D., Wollman F.A.. Searching limiting steps in the expression of chloroplast-encoded proteins: relations between gene copy number, transcription, transcript abundance and translation rate in the chloroplast of Chlamydomonas reinhardtii. Plant J. 2002; 31:149–160. - PubMed
-
- Stern D.B., Goldschmidt-Clermont M., Hanson M.R.. Chloroplast RNA metabolism. Annu. Rev. Plant Biol. 2010; 61:125–155. - PubMed
MeSH terms
Substances
LinkOut - more resources
Full Text Sources
Other Literature Sources
Research Materials
