. 2017 Oct 5;171(2):358-371.e9.
doi: 10.1016/j.cell.2017.09.019.

Lactate Metabolism in Human Lung Tumors

Affiliations

Lactate Metabolism in Human Lung Tumors

Brandon Faubert et al. Cell. .

Abstract

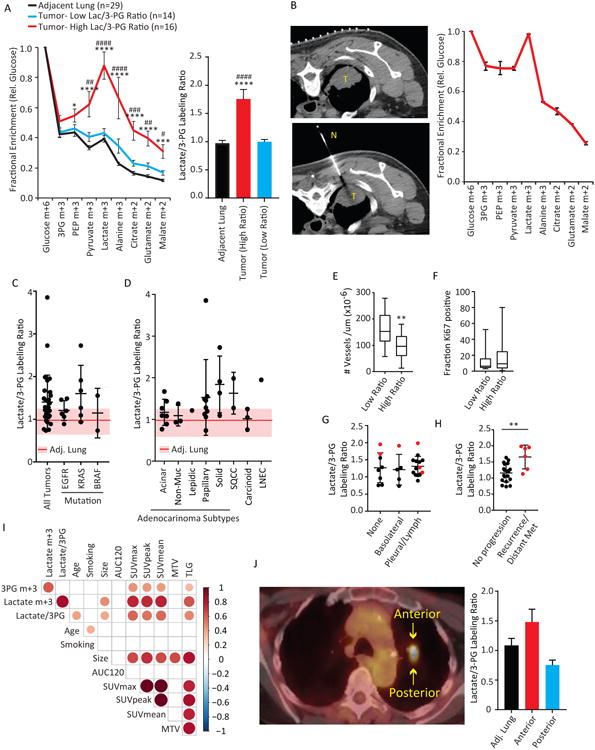
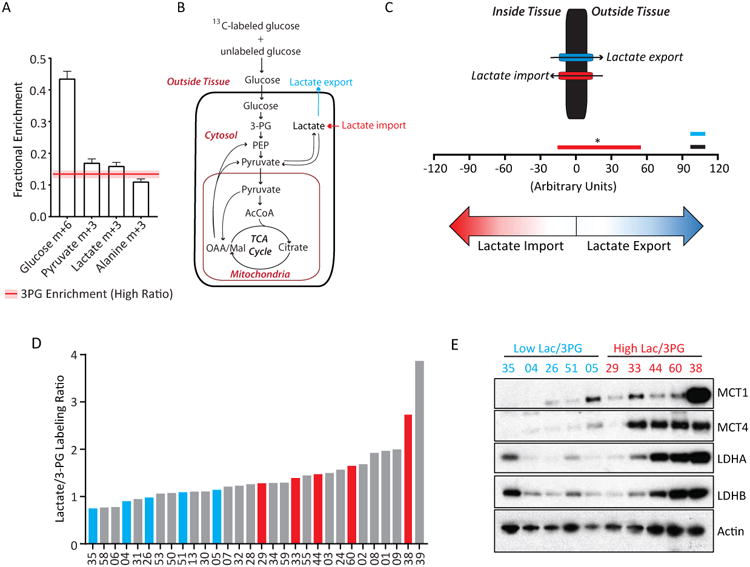
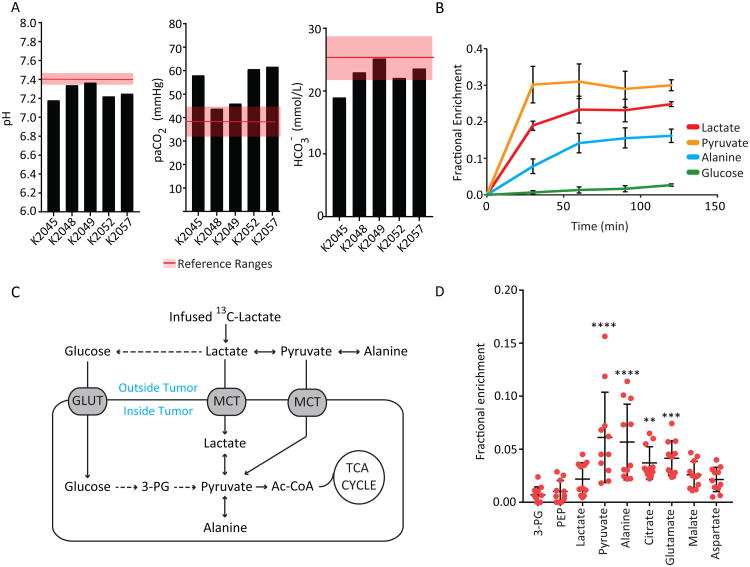
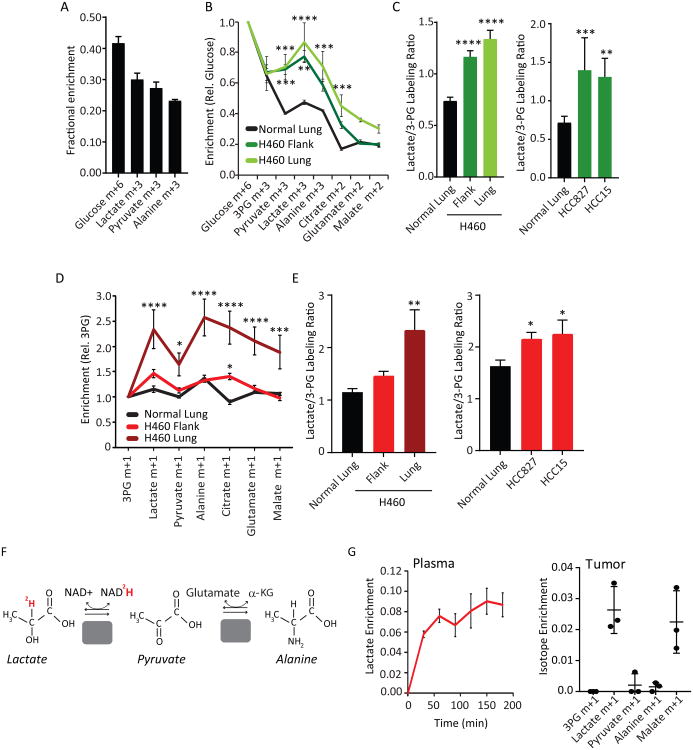
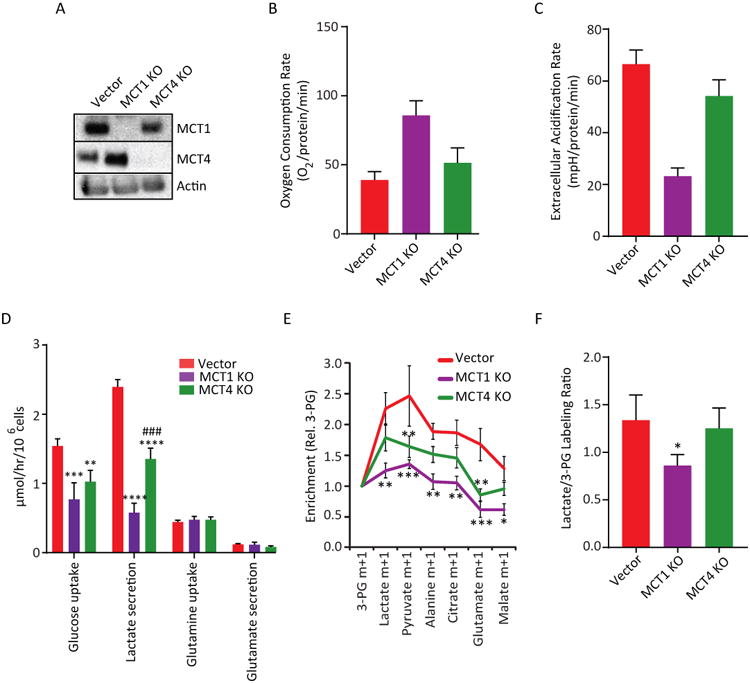
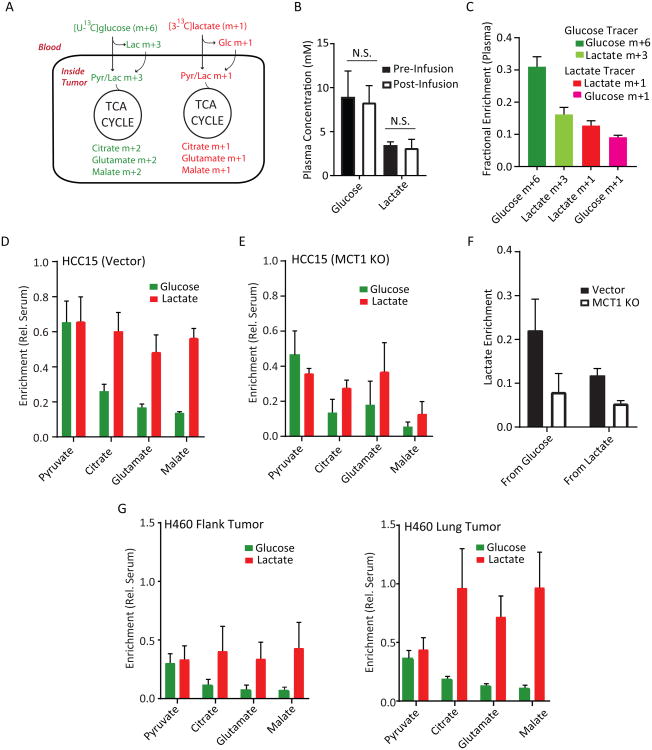
Cancer cells consume glucose and secrete lactate in culture. It is unknown whether lactate contributes to energy metabolism in living tumors. We previously reported that human non-small-cell lung cancers (NSCLCs) oxidize glucose in the tricarboxylic acid (TCA) cycle. Here, we show that lactate is also a TCA cycle carbon source for NSCLC. In human NSCLC, evidence of lactate utilization was most apparent in tumors with high 18fluorodeoxyglucose uptake and aggressive oncological behavior. Infusing human NSCLC patients with 13C-lactate revealed extensive labeling of TCA cycle metabolites. In mice, deleting monocarboxylate transporter-1 (MCT1) from tumor cells eliminated lactate-dependent metabolite labeling, confirming tumor-cell-autonomous lactate uptake. Strikingly, directly comparing lactate and glucose metabolism in vivo indicated that lactate's contribution to the TCA cycle predominates. The data indicate that tumors, including bona fide human NSCLC, can use lactate as a fuel in vivo.

Keywords: Cancer metabolism; Glycolysis; Lactate; Lung cancer; Metabolic flux analysis; Monocarboxylate transport; Tricarboxylic Acid Cycle; Warburg effect.


Figures

Figure 1
Figure 1. Human tumors display heterogeneous patterns of 13C labeling in vivo
(A) 13C enrichments in adjacent lung (black, n=29), Low ratio tumors (blue, n=14) and High ratiotumors (red, n=16). Fractional enrichments of glycolytic and TCA cycle metabolites arenormalized to enrichment of glucose in the tissue. Lactate/3PG labeling ratios are summarized inthe graph to the right. Average values and S.E.M. are displayed. For High ratio vs. Adjacent Lung:**** p< 0.0001; *** p<0.001; *p<0.05. For High Ratio vs. Low Ratio: #### p< 0.0001; ###p<0.001; ## p<0.01; #p<0.05 (Left, Two-way ANOVA, Tukey post-hoc; Right, one-way ANOVA,Tukey post-hoc). (B) Left: Computed tomography-guided biopsy of a human NSCLC before (top) and during (bottom)the biopsy. Right: Mass isotopologues from the tumor. Error bars represent S.D. of threetechnical replicates. (C) Lactate/3PG labeling ratio in tumors of various oncogenotypes (n=30). The shaded regionindicates the mean (line) and S.E.M. of benign lung samples (n=29). (D) Lactate/3PG labeling ratios in tumors of various histological types (n=30). The shaded regionindicates the mean (line) and S.E.M. of benign lung samples (n=29). (E) Microvessel density (MVD) (n=12 per group). ** p<0.01 (Students t-test). (F) Ki67 content by MIB1 staining (n=12 low; n=14 high). (G) Lactate/3PG labeling ratios in Stage 1 or 2 tumors of various levels of invasiveness at time of infusion (n=25). Pleural/lymph indicates tumors with spread to the pleural cavity or regional lymph nodes. Tumors that recurred or developed distant metastases in the years after the infusions are in red. (H) Lactate/3PG labeling ratios of Stage 1 or 2 tumors that progressed (distant metastasis or recurrence in the lung) or did not progress during the study. ** p<0.01 (Student's t-test). (I) Correlation analysis of clinical and metabolic features. Each circle denotes a statistically significant (p<0.05) correlation, with size and color scaling with level of significance. Smoking was measured in pack-years (i.e. average number of packs per day x number of years smoking). (J) Left: Axial view of patient K1051's FDG-PET scan. Regions of differing FDG-PET signal were sampled. Right: Labeling ratios from three regions of K1051's resection. Data are average and S.D. of three small fragments obtained from each site. Abbreviations: 3PG, 3-phosphoglycerate; PEP, phosphoenolpyruvate; AUC120, area under the relative contrast enhancement curve after 120 seconds during dynamic contrast-enhanced MRI; SUV, standardized uptake value; MTV, metabolic tumor volume; TLG, total lesion glycolysis. T, tumor; N, needle.
Figure 2
Figure 2. Evidence for lactate import in human NSCLC
(A) Fractional enrichment in human plasma metabolites. 3PG enrichment in tumors with High Lactate/3PG labeling ratios is indicated by the red line (average) and shaded bar (S.E.M.). Data are average and S.E.M of all patients (n=30). (B) Schematic of selected reactions from the MFA model. (C) Net flux ranges for lactate transport in adjacent lung (black bar) and tumors with Low (blue bar) and High (red bar) Lactate/3PG labeling ratios. Bars are the lower and upper bounds of 95% confidence intervals. Data are considered significant (p<0.05) if the bounds do not overlap. (D) All tumors infused with [U-13C]glucose ranked from lowest to highest Lactate/3PG labeling ratio. (E) Immunoblot analysis of tumor MCT1, MCT4, LDHA and LDHB. Actin is used as a loading control.
Figure 3
Figure 3. Lactate is a carbon source in human lung tumors
(A) Arterial blood pH, partial pressure of CO2 and bicarbonate concentrations from patients infusedwith 13C-lactate. Reference ranges are displayed by the shaded bar. (B) Plasma metabolite enrichment in five patients infused with 13C lactate. Data are average andS.E.M from all 5 patients. M+1 isotopologues were evaluated for the patient infused with [2-13C]lactate. M+3 isotopologues were evaluated for patients infused with [U-13C]lactate. (C) Schematic illustrating routes of 13C entry from infused 13C-lactate. (D) Metabolite enrichment in tumor samples from patients infused with 13C lactate. (11 fragments from n=5 patients). **** p< 0.0001, **p<0.001, **p<0.01. (One-way ANOVA, Dunnett post-hoc vs 3PG)
Figure 4
Figure 4. Lactate is a fuel in mouse NSCLC xenografts
(A) Plasma metabolite enrichment in mice infused with [U-13C]glucose. Data are average and S.E.M.(n=6 mice). (B) Tissue metabolite enrichment in H460 tumor-bearing mice infused with [U-13C]glucose.Enrichments in normal lung, flank tumor and lung tumor are normalized to glucose enrichmentin each tissue. Data are average and S.E.M. **** p< 0.0001, *** p< 0.001, ** p< 0.01, (Two-wayANOVA, Tukey post-hoc) (n=3-4 mice per group). (C) Left: Lactate/3PG labeling ratios of tissues from (B). Right: Mice bearing HCC827 and HCC15flank xenografts were infused as in (B). Lactate/3PG labeling ratios are displayed as average andS.E.M. The Lactate/3PG labeling ratio of HCC15 tumors are derived from Vector control tumorsin Fig. 5F. **** p< 0.0001, *** p< 0.001, ** p< 0.01 (One-way ANOVA, Dunnett post-hoc vs.Adjacent lung; n=5-6 mice per group). (D) Mice bearing H460 tumors in the flank or lung were infused with [3-13C]lactate. Enrichmentvalues are relative to 3PG. Data are average and S.E.M. ****p< 0.0001, ***p<0.001, *p<0.05 vs.adjacent lung. (Two-way ANOVA, Tukey post-hoc; n=4-5 mice per group). (E) Left: Lactate/3PG labeling ratios of tissues in (D). Right: Mice bearing HCC827 and HCC15 flank xenografts were infused as in (D). Data are average and S.E.M. ** p<0.01, * p< 0.05 (One-way ANOVA, Dunnett post-hoc vs. 3PG; n=4-5 mice per group). The Lac/3PG ratio of the HCC15 mice is derived from the vector control tumors in panel 5E. (F) Schematic of [2-2H]lactate metabolism. (G) Plasma and tumor metabolite enrichments in mice infused with [2-2H]lactate. Data are average and S.D. (n=3 mice).
Figure 5
Figure 5. MCT1 regulates lactate uptake in HCC15 xenografts
(A) Immunoblot of HCC15 cells expressing a control vector or CRISPR-mediated knockoutof MCT1 or MCT4. Actin is used as a loading control. (B,C) Oxygen consumption and extracellular acidification rates in Control, MCT1 KO and MCT4 KOcells. Data are average ± SD from a representative experiment (n= 6). (D) Metabolic rates from cultures of Vector control HCC15 cells and sub-lines with knockout of MCT1 or MCT4. **** p< 0.0001; *** p<0.001, **p<0.01 vs. Vector. ### p<0.001 vs MCT1 KO(Two-way ANOVA, Tukey post-hoc, n=3 separate experiments). (E) Mice bearing HCC15 Vector control, MCT1 KO, or MCT4 KO tumors were infused with [2-13C]lactate. Enrichment values are normalized to 3PG. *** p< 0.001, ** p< 0.01, *p<0.05. (Two-way ANOVA, Tukey post-hoc; n=3-4 mice per group). (F) Mice bearing HCC15 Vector control, MCT1 KO, or MCT4 KO tumors were infused with [U-13C]glucose. The Lactate/3PG labeling ratio is plotted for each tumor type. Data are average andS.EM. * p< 0.05 (One-way ANOVA, Tukey post-hoc; n=3-5 mice per group).
Figure 6
Figure 6. Lactate is preferred to glucose as a fuel for the TCA cycle
(A) Schematic for co-infusions with [U-13C]glucose and [3-13C]lactate. In short infusions, glucose-derived pyruvate and lactate are primarily m+3 and TCA cycle metabolites are primarily m+2,whereas lactate-derived metabolites are primarily m+1. (B) Abundance of glucose and lactate pre- and post-infusion. N.S., not significant. (Student's t-test;n=3-5 samples per group) (C) Plasma fractional enrichment of glucose and lactate during co-infusion of [U-13C]glucose and [3-13C]lactate. Data are average and S.E.M (n=8 co-infused mice). (D) Mice with flank xenografts of HCC15 control cells were co-infused with [U13C]glucose and [3-13C]lactate. Enrichments are normalized to the enrichment of each precursor in plasma. Data areaverage and S.E.M. (n=4 mice). (E) Mice bearing flank xenografts of HCC15 MCT1 KO cells were co-infused with [U13C]glucose and[3-13C]lactate as in (C). Enrichments are normalized to the enrichment of each precursor inplasma. Data are average and S.D. (n=2 mice). (F) Effect of MCT1 knockout on enrichments of tumor lactate derived from circulating glucose orcirculating lactate. Data are from the infusions shown in (D) and (E) and are expressed asaverage and S.E.M. (G) Mice bearing flank (left) and lung (right) H460 tumors were co-infused with [U-13C]glucose and[3-13C]lactate. Enrichments are normalized to enrichment of each precursor in plasma. Data areaverage and S.E.M. (n=3 mice).

Comment in

References

    1. Berghmans T, Dusart M, Paesmans M, Hossein-Foucher C, Buvat I, Castaigne C, Scherpereel A, Mascaux C, Moreau M, Roelandts M, et al. Primary tumor standardized uptake value (SUVmax) measured on fluorodeoxyglucose positron emission tomography (FDG-PET) is of prognostic value for survival in non-small cell lung cancer (NSCLC): a systematic review and meta-analysis (MA) by the European Lung Cancer Working Party for the IASLC Lung Cancer Staging Project. J Thorac Oncol. 2008;3:6–12. - PubMed
    1. Bonuccelli G, Tsirigos A, Whitaker-Menezes D, Pavlides S, Pestell RG, Chiavarina B, Frank PG, Flomenberg N, Howell A, Martinez-Outschoorn UE, et al. Ketones and lactate “fuel” tumor growth and metastasis: Evidence that epithelial cancer cells use oxidative mitochondrial metabolism. Cell cycle (Georgetown, Tex) 2010;9:3506–3514. - PMC - PubMed
    1. Brand A, Singer K, Koehl GE, Kolitzus M, Schoenhammer G, Thiel A, Matos C, Bruss C, Klobuch S, Peter K, et al. LDHA-Associated Lactic Acid Production Blunts Tumor Immunosurveillance by T and NK Cells. Cell Metab. 2016;24:657–671. - PubMed
    1. Brooks GA. Lactate shuttles in nature. Biochem Soc Trans. 2002;30:258–264. - PubMed
    1. Buescher JM, Antoniewicz MR, Boros LG, Burgess SC, Brunengraber H, Clish CB, DeBerardinis RJ, Feron O, Frezza C, Ghesquiere B, et al. A roadmap for interpreting (13)C metabolite labeling patterns from cells. Curr Opin Biotechnol. 2015;34:189–201. - PMC - PubMed