. 2017 Dec 1;77(23):6717-6728.
doi: 10.1158/0008-5472.CAN-17-1120. Epub 2017 Oct 6.

Chemotherapeutic Dose Scheduling Based on Tumor Growth Rates Provides a Case for Low-Dose Metronomic High-Entropy Therapies

Affiliations

Chemotherapeutic Dose Scheduling Based on Tumor Growth Rates Provides a Case for Low-Dose Metronomic High-Entropy Therapies

Jeffrey West et al. Cancer Res. .

Abstract

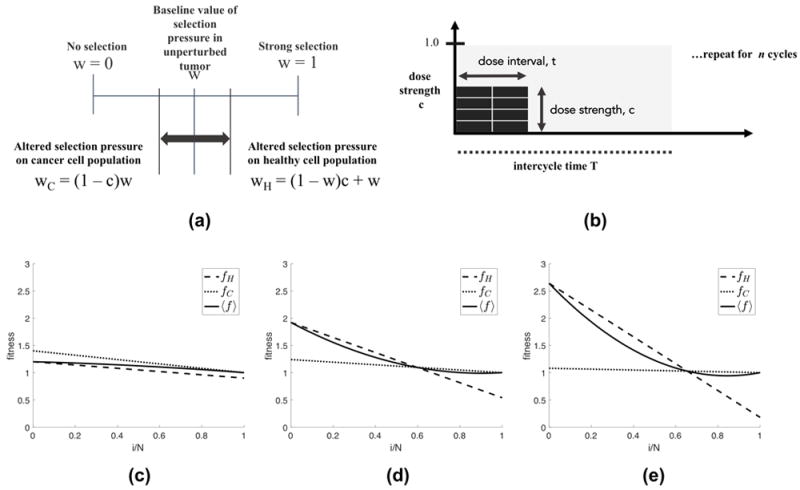
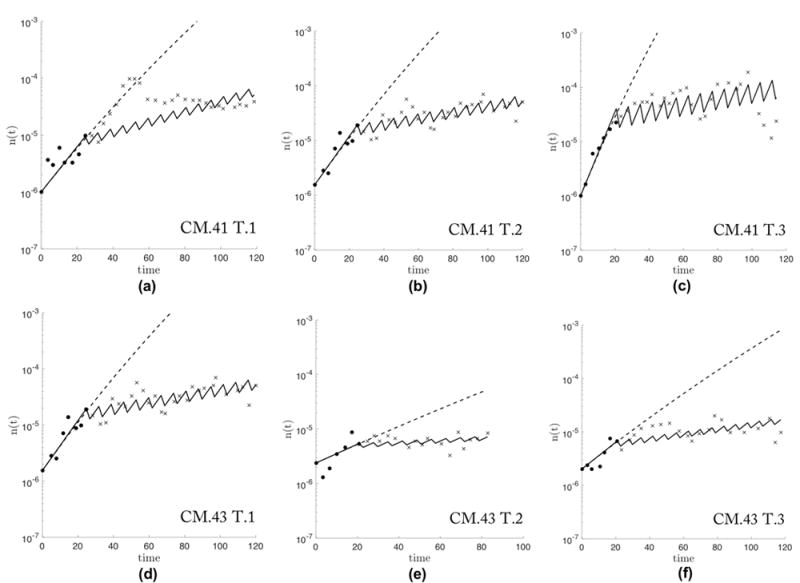
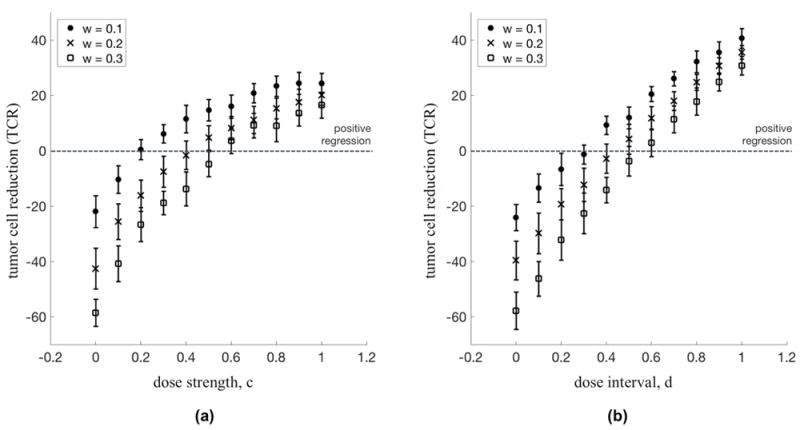
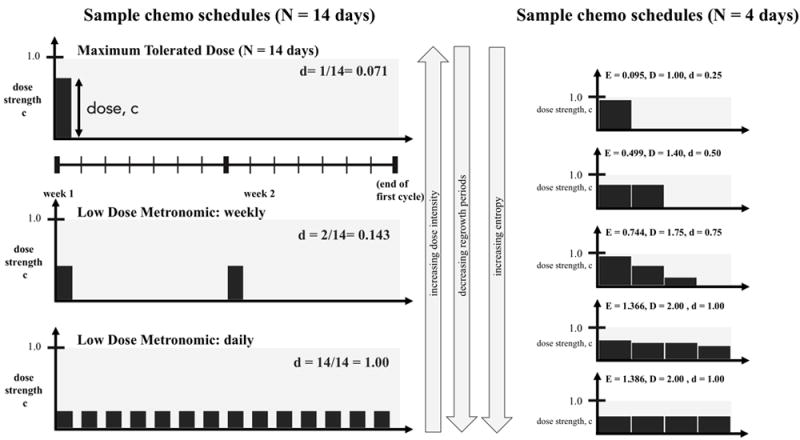
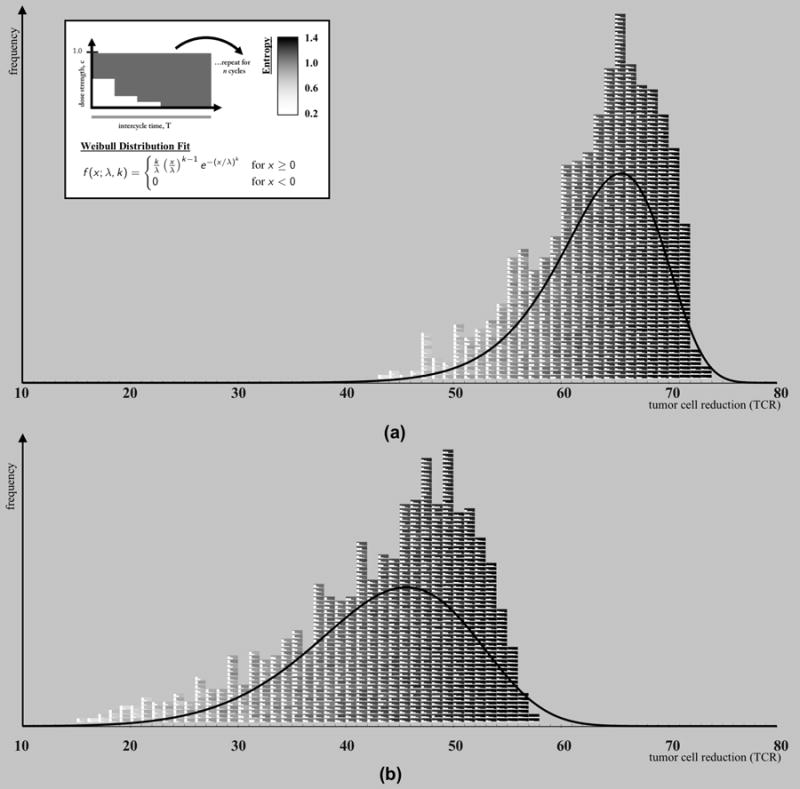
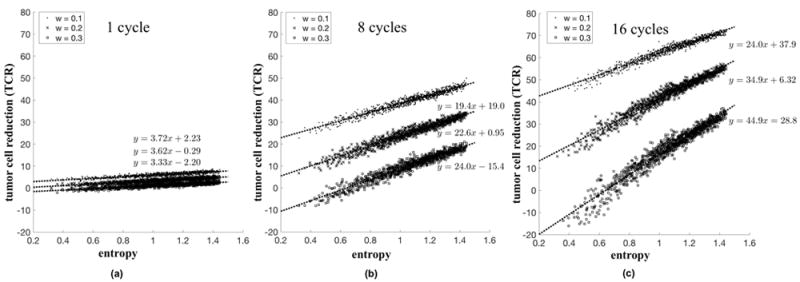
We extended the classical tumor regression models such as Skipper's laws and the Norton-Simon hypothesis from instantaneous regression rates to the cumulative effect over repeated cycles of chemotherapy. To achieve this end, we used a stochastic Moran process model of tumor cell kinetics coupled with a prisoner's dilemma game-theoretic cell-cell interaction model to design chemotherapeutic strategies tailored to different tumor growth characteristics. Using the Shannon entropy as a novel tool to quantify the success of dosing strategies, we contrasted MTD strategies as compared with low-dose, high-density metronomic strategies (LDM) for tumors with different growth rates. Our results show that LDM strategies outperformed MTD strategies in total tumor cell reduction. This advantage was magnified for fast-growing tumors that thrive on long periods of unhindered growth without chemotherapy drugs present and was not evident after a single cycle of chemotherapy but grew after each subsequent cycle of repeated chemotherapy. The evolutionary growth/regression model introduced in this article agrees well with murine models. Overall, this model supports the concept of designing different chemotherapeutic schedules for tumors with different growth rates and develops quantitative tools to optimize these schedules for maintaining low-volume tumors. Cancer Res; 77(23); 6717-28. ©2017 AACR.


Conflict of interest statement

Disclosure of Potential Conflicts of Interest:

The authors declare no potential conflicts of interest.

Figures

Figure 1
Figure 1. Chemotherapy is a selective agent that alters the fitness landscape of cells
(a) The dose strength parameter, c, (0 ≤ c ≤ 1), alters the selection pressure parameter, w, (0 ≤ w ≤ 1), in favor of the healthy cell population (wH > w) and to the disadvantage of the cancer cell population (wC < w). (b) Total dose density delivered in the one chemotherapeutic cycle, D, is the product of the dose strength (c, 0 ≤ c ≤ 1) and dose interval (d, 0 ≤ d ≤ 1) such that D = ct (eqn. 13 (0 ≤ D ≤ 1)). (c,d,e) Plots showing the fitness of the healthy cell subpopulation (fH, dashed line) and the cancer cell subpopulation (fC, dotted line) for no therapy, low dose therapy, and high dose therapy.
Figure 2
Figure 2. Classical Tumor Regression Laws
(a) The Norton-Simon hypothesis states that tumor regression is proportional to the growth rate of an unperturbed tumor of that size. Unperturbed tumor growth, nU (t) (dashed line) in a representative population of N = 103 cells, and growth rate, γ(t) (solid line) is shown. Therapy is administered at various timepoints in the growth of the tumor and then regression, nT (t), is plotted (dotted line). Rate of regression, β, is the best-fit slope on the log-plot. (b) The average regression rate was calculated for 25 stochastic simulations, and plotted as a function of γ at the time of therapy with error bars indicating the standard deviation of values. A linear best fit (predicted to be linear by the Norton-Simon hypothesis; dotted line) is calculated to be β(t) = 3.0865γ + 5.2359e05.
Figure 3
Figure 3. Response of murine tumors to 5-Fluorouracil (5-FU) treatment with model best-fit
Data (reproduced from (47)) from two treated mice: CM.41 (a, b, c) and CM.43 (d, e, f), receiving total doses of 50mg/kg or 100mg/kg, respectively, on a weekly basis. Biweekly measurements of tumor volume are recorded for untreated (black circles) until 3-4mm in size and treated volumes (black x’s) are measured until tumor reaches 1cm size. A Gompertzian function is best-fit (dashed line) and the Prisoner’s dilemma model is fit using w and c as parameters (solid line). The model fit performs well for the wide range of tumor growth rates found in six tumors (w = [0.18, 0.08, 0.21, 0.08, 0.35, 0.12] and c = [0.30, 0.49, 0.34, 0.34, 0.36, 0.32] a through f, respectively) Note: tumor in (a) shows a time delay from start of treatment to response to therapy which our model does not address.
Figure 4
Figure 4. Diminishing returns of dose escalation compared to linear relationship of dose density
(a) Dose Escalation: The percent regression of a tumor for a range of dose strength (constant dose interval: t = 10 days, T = 14 days) are shown for a range of selection pressure: w = 0.1 (circles), w = 0.2 (x’s), and w = 0.3 (squares). For each subsequent increase in dose strength, the dose escalation approach to chemotherapy shows diminishing returns in percent tumor regression. (b) Dose Density: The percent regression of a tumor for a range of dose interval (constant dose strength: c = 1.0) are shown for a range of selection pressure: w = 0.1 (circles), w = 0.2 (x’s), and w = 0.3 (squares). Dose density shows a linear relationship between densifying chemotherapy and percent tumor regression.
Figure 5
Figure 5. Shannon entropy as an index to compare treatment strategies
(Left:) 3 common chemotherapy schedules are shown for one cycle (N = 14 days). Maximum Tolerated Dose (left, top) is a high dose (administered once at the beginning of every 2 week cycle) and low dose density (d = 0.071, see equation 16) regimen. Low Dose Metronomic Weekly (left, middle) is a lower dose, higher density (d = 0.143) regimen, while Low Dose Metronomic Daily is the lowest dose, highest density (d = 1.00). (Right:) Similarly, chemotherapy regimens can be simulated for a range of dose, density, and entropy values. Pictured from top to bottom are a range of representative regimens from low entropy (i.e. high dose, low density) to high entropy (i.e. low dose, high density) for a cycle of N = 4 days. On each ith day, treatment of dose ci is administered. The treatment strategy’s Shannon Entropy, E, is calculated according to equation 14 and the total dose delivered is calculated according to equation 15. All treatment strategies are front loaded (monotonically decreasing) regimens. It should be noted that LDM-like regimens correspond to a high entropy value (bottom, left and right).
Figure 6
Figure 6. High entropy, LDM-like chemotherapies outperform low entropy MTD-like chemotherapies
Two pictorial histograms are plotted where each block (color-coded from white: low entropy to black: high entropy) represents a chemotherapy regimen. (a) A slow-growing tumor (w = 0.1) (b) A fast-growing tumor (w = 0.2). All regimens are equivalent total dose (D = 0.3), monotonically decreasing, and are repeated for 8 cycles of chemotherapy and the tumor cell reduction (TCR) is recorded. The dose density, d, and dose concentration, ci, are varied between regimens. The histogram clearly shows a color-shift from white toward black for low TCR, ineffective therapies toward high TCR, effective therapies. High entropy (black) therapies outperform low entropy therapies. The data was fit to a Weibull distribution (shown in upper left panel; (a): k = 14.251, λ = 65.882, (b): k = 6.647, λ = 46.758), overlaid in a solid line.
Figure 7
Figure 7. High entropy strategies lead to an increase in tumor regression
The relationship between tumor cell reduction (TCR) and entropy (H) is shown for a single cycle of chemotherapy (a), 8 cycles (b), and 16 cycles (c). The simulations (averages of 25 stochastic simulations for total dose delivered D = 0.3) are repeated for slow (w = 0.1, circles), medium (w = 0.2, x’s), and fast growing tumors (w = 0.3, squares). The low slope value in (a) indicates negligible advantage of high entropy strategies after only a single cycle. After many cycles, the advantage of high entropy strategies is apparent (b,c). Also note that the slope associated with faster growing tumors (squares; w = 0.3) is higher than those of slower growing tumors (circles; w = 0.1). This indicates that at high entropies, TCR for the fast growing tumors is closer to those for slow growing tumors, as compared with low entropies.

References

    1. Axelrod R, Axelrod DE, Pienta KJ. Evolution of cooperation among tumor cells. Proceedings of the National Academy of Sciences. 2006;103:13474–13479. - PMC - PubMed
    1. Nowak M. Stochastic strategies in the prisoner’s dilemma. Theoretical Population Biology. 1990;38:93–112.
    1. Hanahan D, Bergers G, Bergsland E. Less is more, regularly: metronomic dosing of cytotoxic drugs can target tumor angiogenesis in mice. The Journal of Clinical Investigation. 2000;105:1045–1047. - PMC - PubMed
    1. Lien K, Georgsdottir S, Sivanathan L, Chan K, Emmenegger U. Low-dose metronomic chemotherapy: a systematic literature analysis. European Journal of Cancer. 2013;49:3387–3395. - PubMed
    1. Kerbel RS, Kamen BA. The anti-angiogenic basis of metronomic chemotherapy. Nature Reviews Cancer. 2004;4:423–436. - PubMed

Publication types

MeSH terms

Substances

LinkOut - more resources