

Impact of Selection Bias on Estimation of Subsequent Event Risk
- PMID: 28986451
- PMCID: PMC5659743
- DOI: 10.1161/CIRCGENETICS.116.001616
Impact of Selection Bias on Estimation of Subsequent Event Risk
Abstract
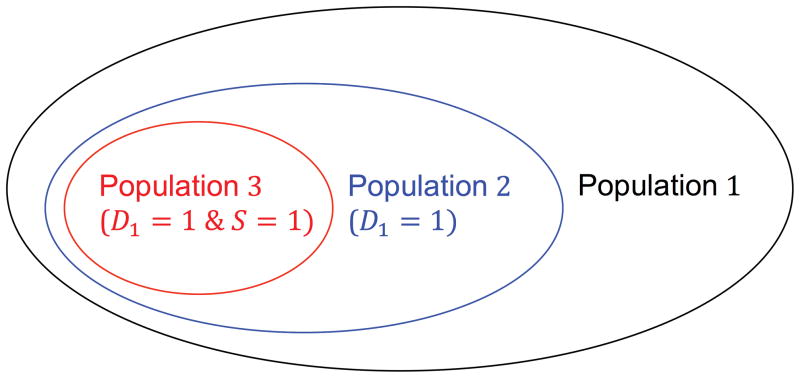
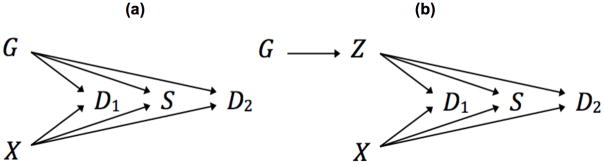
Background: Studies of recurrent or subsequent disease events may be susceptible to bias caused by selection of subjects who both experience and survive the primary indexing event. Currently, the magnitude of any selection bias, particularly for subsequent time-to-event analysis in genetic association studies, is unknown.
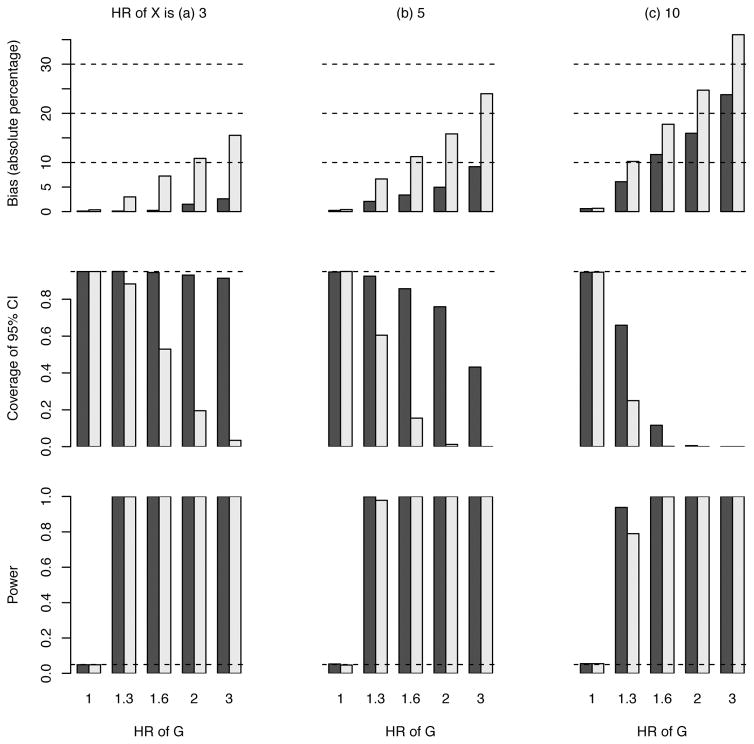
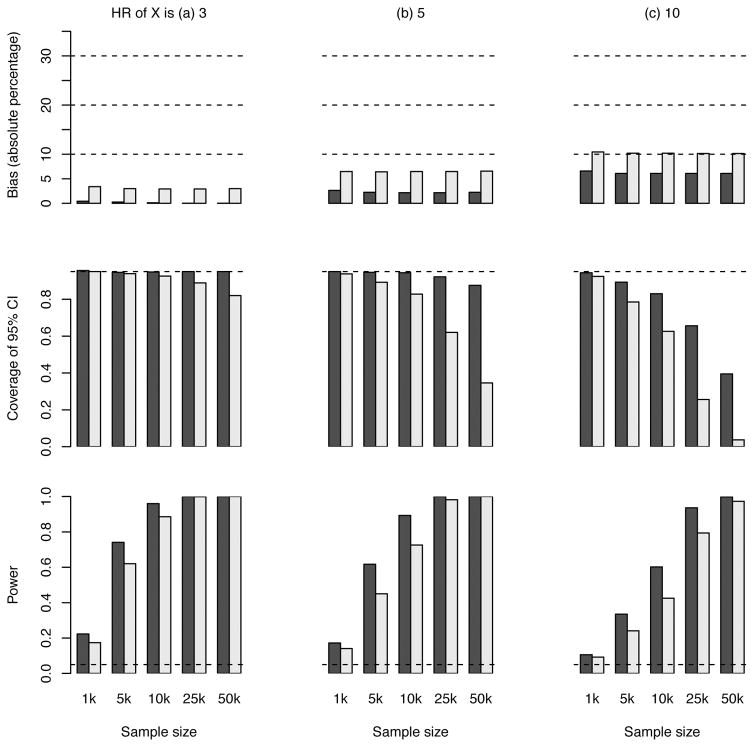
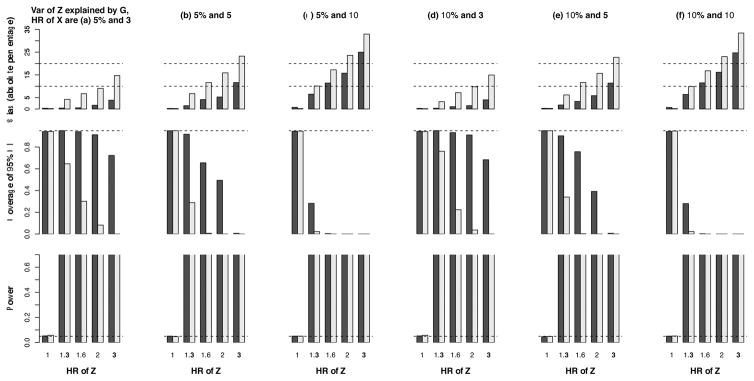
Methods and results: We used empirically inspired simulation studies to explore the impact of selection bias on the marginal hazard ratio for risk of subsequent events among those with established coronary heart disease. The extent of selection bias was determined by the magnitudes of genetic and nongenetic effects on the indexing (first) coronary heart disease event. Unless the genetic hazard ratio was unrealistically large (>1.6 per allele) and assuming the sum of all nongenetic hazard ratios was <10, bias was usually <10% (downward toward the null). Despite the low bias, the probability that a confidence interval included the true effect decreased (undercoverage) with increasing sample size because of increasing precision. Importantly, false-positive rates were not affected by selection bias.
Conclusions: In most empirical settings, selection bias is expected to have a limited impact on genetic effect estimates of subsequent event risk. Nevertheless, because of undercoverage increasing with sample size, most confidence intervals will be over precise (not wide enough). When there is no effect modification by history of coronary heart disease, the false-positive rates of association tests will be close to nominal.
Keywords: alleles; confidence intervals; genetic association studies; risk; sample size; selection bias.
© 2017 American Heart Association, Inc.
Figures

Comment in
-
Biases in Genetic Association of Coronary Heart Disease Events May Be Less Likely Than Suspected: Here Is When to Check for Them.Circ Cardiovasc Genet. 2017 Oct;10(5):e001912. doi: 10.1161/CIRCGENETICS.117.001912. Circ Cardiovasc Genet. 2017. PMID: 28986456 No abstract available.
References
-
- Capewell S, Allender S, Critchley J, Lloyd-Williams F, O’Flaherty M, Rayner M, et al. Modelling the UK burden of cardiovascular disease to 2020: A Research Report for the Cardio & Vascular Coalition and the British Heart Foundation. 2008.
-
- Mozaffarian D, Benjamin EJ, Go AS, Arnett DK, Blaha MJ, Cushman M, et al. Heart disease and stroke statistics-2015 update: A report from the American Heart Association. Circulation. 2015;131:e29–e39. - PubMed
-
- Reilly MP, Li M, He J, Ferguson JF, Stylianou IM, Mehta NN, et al. Identification of ADAMTS7 as a novel locus for coronary atherosclerosis and association of ABO with myocardial infarction in the presence of coronary atherosclerosis: two genome-wide association studies. Lancet. 2017;377:383–392. - PMC - PubMed
-
- Patel RS, Asselbergs FW. The GENIUS-CHD consortium. Eur Heart J. 2015;36:2674–2676. - PubMed
MeSH terms
Grants and funding
LinkOut - more resources
Full Text Sources
Other Literature Sources
Medical
