. 2017 Oct 6;8(1):797.
doi: 10.1038/s41467-017-00842-8.

Mammalian APE1 controls miRNA processing and its interactome is linked to cancer RNA metabolism

Affiliations

Mammalian APE1 controls miRNA processing and its interactome is linked to cancer RNA metabolism

Giulia Antoniali et al. Nat Commun. .

Abstract

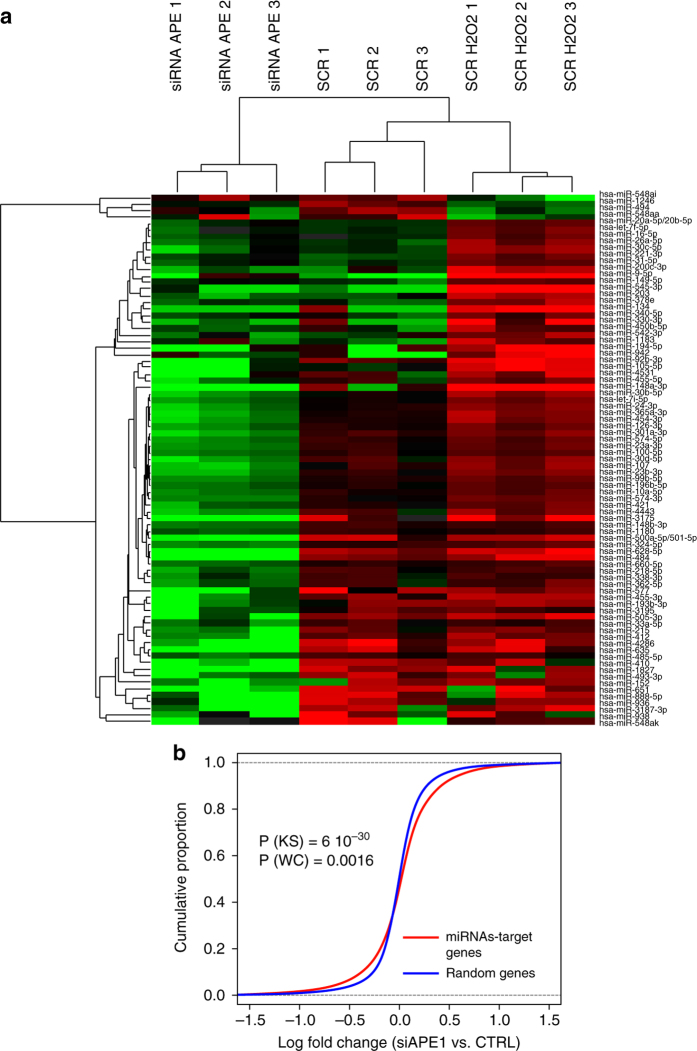
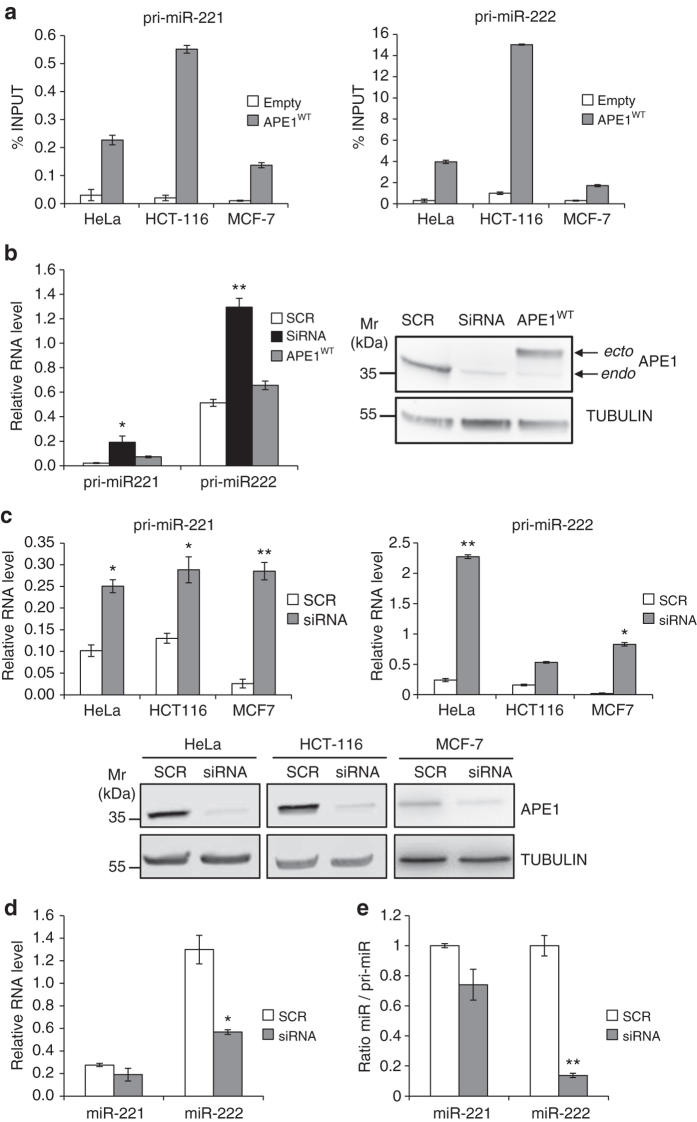
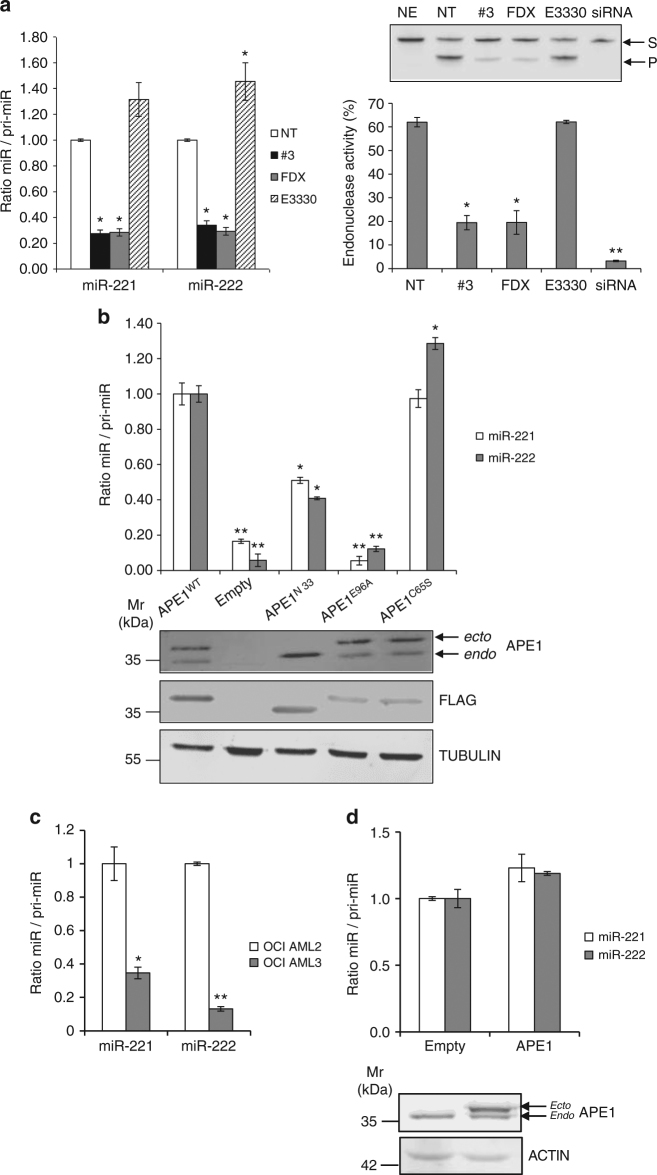
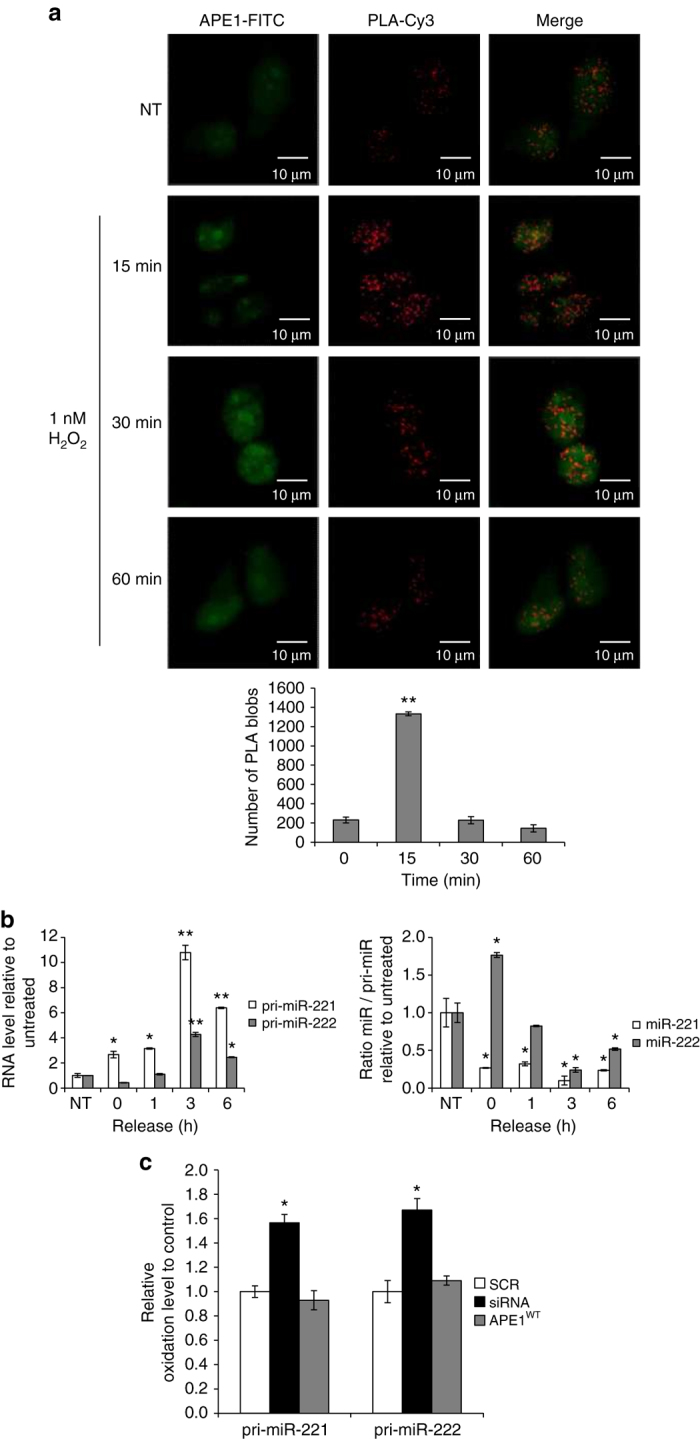
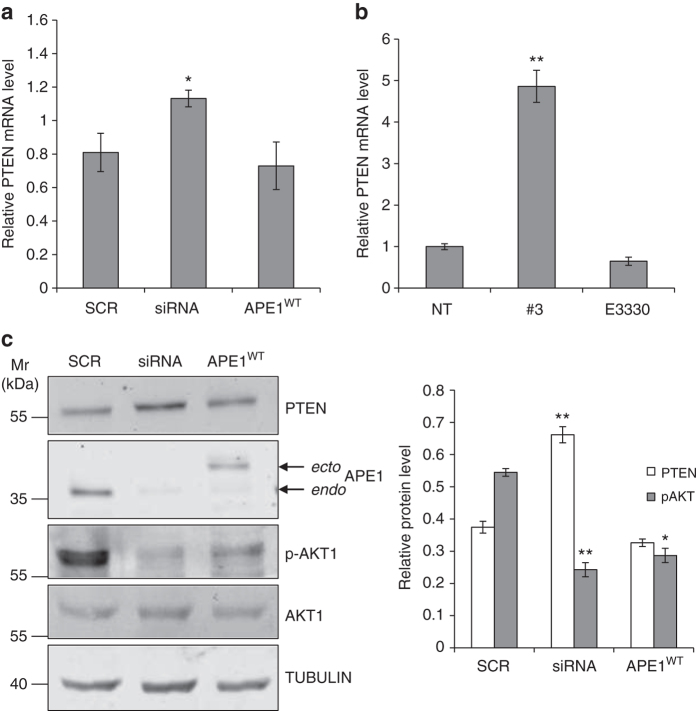
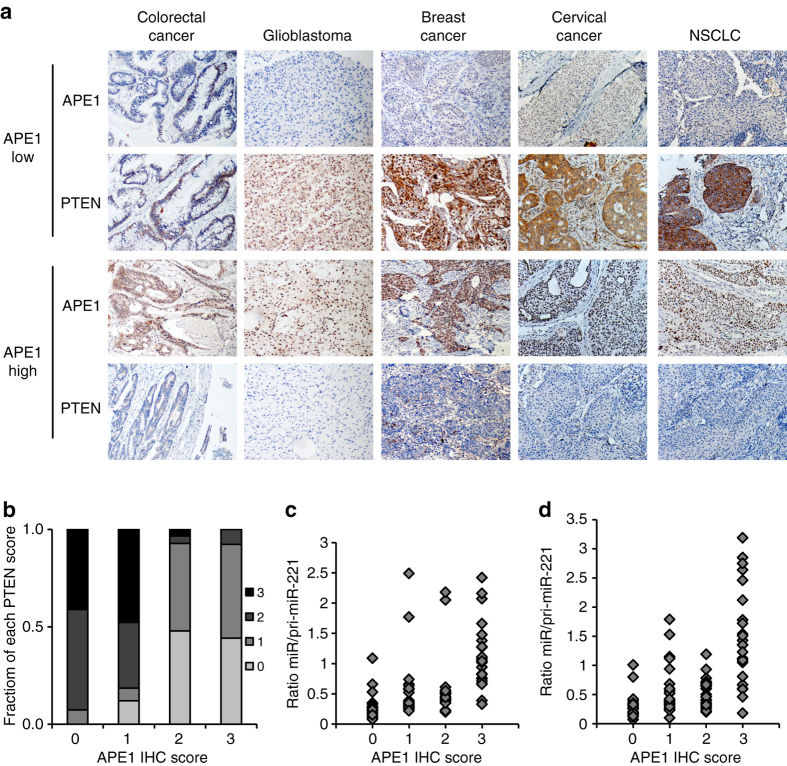
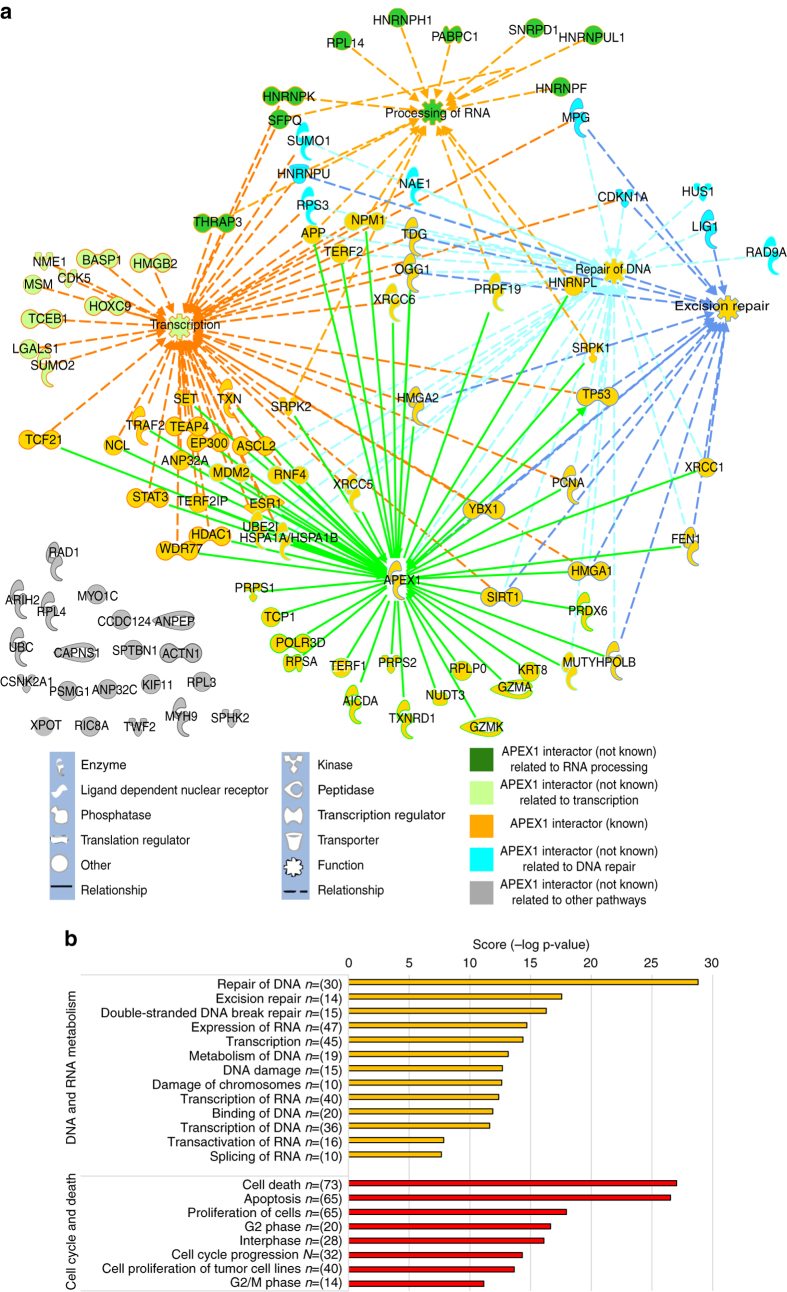
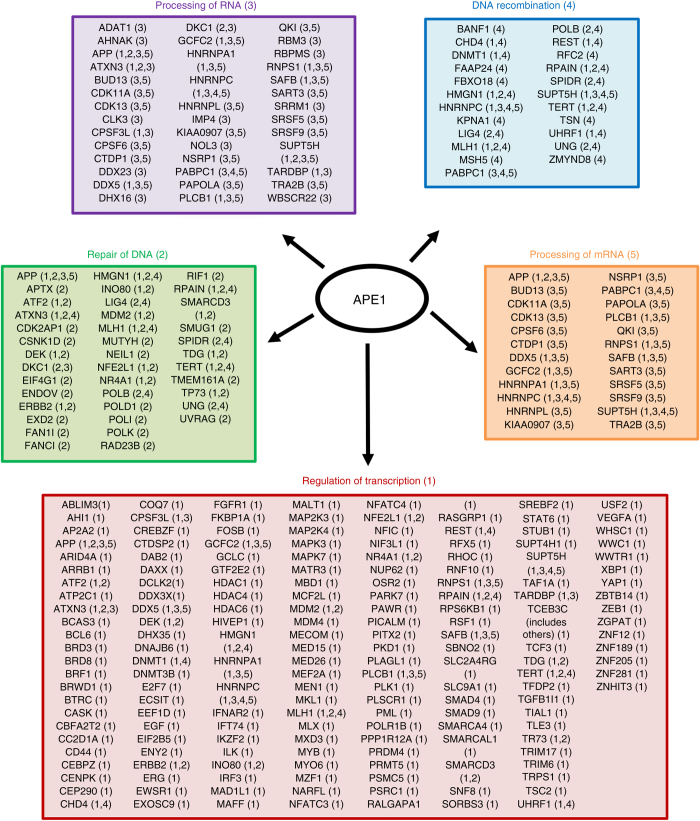
Mammalian apurinic/apyrimidinic endonuclease 1 is a DNA repair enzyme involved in genome stability and expression of genes involved in oxidative stress responses, tumor progression and chemoresistance. However, the molecular mechanisms underlying the role of apurinic/apyrimidinic endonuclease 1 in these processes are still unclear. Recent findings point to a novel role of apurinic/apyrimidinic endonuclease 1 in RNA metabolism. Through the characterization of the interactomes of apurinic/apyrimidinic endonuclease 1 with RNA and other proteins, we demonstrate here a role for apurinic/apyrimidinic endonuclease 1 in pri-miRNA processing and stability via association with the DROSHA-processing complex during genotoxic stress. We also show that endonuclease activity of apurinic/apyrimidinic endonuclease 1 is required for the processing of miR-221/222 in regulating expression of the tumor suppressor PTEN. Analysis of a cohort of different cancers supports the relevance of our findings for tumor biology. We also show that apurinic/apyrimidinic endonuclease 1 participates in RNA-interactomes and protein-interactomes involved in cancer development, thus indicating an unsuspected post-transcriptional effect on cancer genes.APE1 plays an important role in the cellular response to oxidative stress, and mutations are linked to tumor progression and chemoresistance. Here, the authors characterize the interactions of APE1 with RNA and demonstrate a role in microRNA processing.


Conflict of interest statement

The authors declare no competing financial interests.

Figures

Fig. 1
Fig. 1
miRNA profiling of H2O2-treated and APE1-knocked down HeLa cells. a Hierarchical-clustering analysis showing miRNAs differentially expressed in HeLa cell clones stably transfected with scrambled siRNA control (SCR), with an APE1 siRNA (siAPE) or SCR after stimulation with 1 mM H2O2 for 15 min. The heatmap diagram shows the centered miRNA expression values in logarithmic scale across the three groups of samples. b Empirical cumulative distribution function (ECDF) curves for expression changes (log fold change) of miRNAs-target genes (red line) vs. those of random mRNAs (blue line). Statistical significance of the difference between ECDFs is indicated (P-value from Kolmogorov–Smirnov (KS) test and Wilcoxon (WC))
Fig. 2
Fig. 2
APE1 binding to pri-miR-221/222. a Validation of APE1 binding to pri-miR-221 and pri-miR-222 in different human cancer cell lines. qRT-PCR of pri-miRs bound by APE1 in different cell lines transfected with either empty vector or with a vector expressing APE1WT FLAG-tag protein. Data are presented as fold percentage of the amount of immunoprecipitated pri-miR relative to that present in total input RNA. b Pri-miR-221 and pri-miR-222 expression levels evaluated by qRT-PCR analysis of HeLa cell clones silenced for APE1 expression. Total RNA was extracted from HeLa cell clones stably transfected with scrambled siRNA control (SCR), with an APE1 siRNA (siRNA) and reverse transcribed as described in the Methods section. Histograms show the detected levels of pri-miR-221 and pri-miR-221 normalized to GAPDH levels. Asterisks represent a significant difference with respect to control (SCR). *P < 0.05, **P < 0.001, Student’s t-test. Right, western blotting analyses of HeLa cell clone extracts silenced for APE1 expression. c Pri-miR-221 and pri-miR-222 expression levels evaluated by qRT-PCR analysis of different cell lines. Total RNA was extracted from HeLa, HCT-116, and MCF-7 cell lines transiently silenced for APE1 and reverse transcribed. Histograms show the detected levels of pri-miR-221 and pri-miR-221 normalized to GAPDH levels. Asterisks represent a significant difference with respect to control (SCR). *P < 0.05, **P < 0.001, Student’s t-test. Bottom, representative western blotting analyses to confirm APE1 silencing in HeLa, HCT-116, and MCF-7 cells. Tubulin was used as loading control. d Mature miR-221 and miR-222 expression levels evaluated by qRT-PCR analysis of HeLa cells silenced for APE1 expression. Total RNA was extracted from HeLa cell clones stably transfected with scrambled siRNA control (SCR), with an APE1 siRNA (siRNA), and reverse transcribed. Histograms show the detected levels of miR-221 and miR-222 normalized to RNU44 levels. Asterisks represent a significant difference with respect to control (SCR). *P < 0.05, **P < 0.001, Student’s t-test. e Mature miR to pri-miR ratios in HeLa cells clones silenced for APE1 expression. Mature miR-221 and miR-222 were measured by qRT-PCR analysis, normalized to RNU44, and expressed relative to GAPDH-normalized pri-miR-221/222. Asterisks represent a significant difference with respect to control (SCR). *P < 0.05, **P < 0.001, Student’s t-test
Fig. 3
Fig. 3
Inhibition of APE1 endonuclease activity negatively affects miR-221 and miR-222 processing. a Mature miR-221 and miR-222 were measured by qRT-PCR in HeLa cells treated with 20 µM compound #3, 40 µM fiduxosin (FDX) and 100 µM E3330 for 24 h, respectively. Mature miRNAs were normalized to RNU44 and expressed relative to GAPDH-normalized pri-miR-221/222. Right, AP-site incision activity of total cell extracts from HeLa cells treated with the indicated APE1 inhibitors or HeLa cells silenced for APE1 (siRNA). siRNA cell extracts were used as negative control. The histogram indicates the percentage conversion of an AP site-containing DNA substrate (S) to the incised product (P). Data are expressed as mean ± SD of three technical replicates from two independent assays. A representative image of the denaturing polyacrylamide gel of the enzymatic reactions is shown. NE no cell extract, NT non-treated cells. Asterisks represent a significant difference with respect to control (NT).*P < 0.05, **P < 0.001, Student’s t-test. b Mature miR to pri-miR ratios in HeLa cell clones silenced for the endogenous APE1 expression and transiently transfected with expression plasmids for FLAG-tagged, siRNA-resistant APE1 mutants APE1WT, APE1NΔ33, APE1E96A, and APE1C65S. Mature miR-221 and miR-222 levels were measured by qRT-PCR analysis, normalized to RNU44, and expressed as relative to GAPDH-normalized pri-miR-221/222. Asterisks represent a significant difference with respect to control (SCR). *P < 0.05, **P < 0.001, Student’s t-test. Below, western blotting analysis showing HeLa cell clones silenced for endogenous APE1–protein (endo) and re-expressing ectopic APE1–FLAG-tagged mutants (ecto). c miR-221 and miR-222 expression levels evaluated by qRT-PCR analysis of OCI/AML-2 and AML-3 cells lines. OCI/AML2 cells represent the control expressing a wild-type NPM1 protein, which accumulates within nucleoplasm and nucleoli. Histograms show the ratio between mature miRNAs relative to their GAPDH-normalized precursors. Asterisks represent a significant difference with respect to control (OCI/AML-2).*P < 0.05, **P < 0.001, Student’s t-test. d miR-221 and miR-222 expression levels evaluated by qRT-PCR analysis of HeLa cells overexpressing APE1 by transient transfection of APE1–FLAG-expressing plasmid. Histograms show the ratio between mature miRNAs relative to their GAPDH-normalized precursors. Below, western blotting analysis showing HeLa cells transfected with ectopic APE1 FLAG-tagged plasmid
Fig. 4
Fig. 4
Interaction of APE1 with the DROSHA complex is stimulated by oxidative stress. a Nucleoplasmic interaction between APE1 and the DROSHA complex after oxidative stress. HeLa cells were placed on a glass coverslip and treated with 1 mM H2O2 for 15, 30, and 60 min. PLA reaction was carried out using anti-APE1 and anti-DROSHA antibodies. APE1 expression was detected by using an anti-APE1 antibody and was used as a reference for the nuclei. Data reported in the histogram account for the average number of PLA signals of at least 30 randomly selected cells per condition. **P < 0.001, Student’s t-test. b miR-221 and miR-222 expression levels evaluated by qRT-PCR analysis of HeLa cells treated with 1 mM H2O2 for 15 min and released for 1, 3 or 6 h after treatment. Histograms show the detected levels of pri-miR-221 and pri-miR-221 normalized to GAPDH levels (left) and the ratio between mature miRNAs relative to their GAPDH-normalized precursors (right). Asterisks represent a significant difference with respect to control (NT). NT non-treated. *P < 0.05, **P < 0.001, Student’s t-test. c Total RNA, isolated from HeLa cell clones, was reacted with aldehyde-reactive probe specifically on oxidative abasic sites, followed by precipitation with magnetic beads. Precipitated oxidized RNA and total RNA were subjected to qRT-PCR individually using TaqMan probe for pri-miR-221 or pri-miR-222. Oxidation levels of miRNAs were determined based on difference in Ct value between oxidized and total RNA. Data are represented as mean ± SD after three replication tests. *P < 0.05, Student’s t-test
Fig. 5
Fig. 5
Impact of miR-221/222 processing on PTEN protein expression. a PTEN mRNA levels evaluated by qRT-PCR analysis of HeLa cell clones silenced for APE1 expression. Total RNA was extracted from HeLa cell clones expressing APE1 WT or APE1 silenced (siRNA) and reverse transcribed. Histogram shows the detected levels of PTEN normalized to GAPDH levels. Asterisks represent a significant difference with respect to control (SCR).*P < 0.05, Student’s t-test. b PTEN mRNA levels evaluated by qRT-PCR analysis of HeLa cell treated with 20 µM compound #3 or 100 µM E3330 for 24 h, respectively. Histogram shows the detected levels of PTEN normalized to GAPDH levels. Asterisks represent a significant difference with respect to control (NT). **P < 0.001, Student’s t-test. c PTEN protein level evaluated in HeLa cell clone silenced for APE1 expression. Representative western blotting analyses of total cell extracts of HeLa cell clones. PTEN expression inversely correlates with phosphorylation of Akt1 (pAkt1). Histogram reports expression level of PTEN and pAkt protein obtained after quantification of the signal intensity of the corresponding bands. Data represent the means of ± SD of three independent experiments. Tubulin was used as loading control and for data normalization. Asterisks represent a significant difference with respect to control (SCR).*P < 0.05, **P < 0.001, Student’s t-test
Fig. 6
Fig. 6
Correlative expression of APE1 and miR-221/222 with PTEN in a cohort of human cancer specimens. a APE1 and PTEN protein expression were determined by IHC assay and the representative images of both APE1 and PTEN were shown. PTEN expression significantly increased in tumor tissues showing poor APE1 expression, while was suppressed in tumor tissues showing high APE1 expression. b Bar graph showing the percentage of each score level of PTEN in 0, 1, 2, and 3 score level of APE1. Data were categorized as follow: (i) score 0, no expression in tumor cells; (ii) score 1, faint/barely perceptible partial expression in <10% of tumor cells; (iii) score 2, weak to moderate expression in >10% of tumor cells; (iv) score 3, strong expression in >10% of tumor cells. c and d Scattered plots showing distribution of miR to pri-miR ratios for miR-221 and miR-222 in each score level of APE1–protein staining, respectively
Fig. 7
Fig. 7
APE1–protein interactome network. a Protein network generated by Ingenuity Pathway Analysis. Starting from the gene list of the APE1-interacting protein partners, an interaction network was generated using the “connect tool” in order to differentiate between known or novel partners, also taking advantage of the Ingenuity Knowledge base. By using the “annotation tool”, we selected and connected in the network the top four functional themes that were able to annotate the majority of the genes (63%). In the legend, we show the meaning of the shape representation and the molecular relationships in the IPA network. b Bar chart showing the enrichment of specific functions obtained using IPA for the APE1-binding protein partners. Bars length represent the –(log P-value) of the enrichment
Fig. 8
Fig. 8
RIP identification of RNAs interacting with APE1. Top-five functional annotation clusters of APE1–RNA targets identified by Ingenuity Pathway Analysis based on functional terms of the “Biological Process” category. RNAs in more than one cluster are cross-referenced with numbers

References

    1. Li M, Wilson DM. Human apurinic/apyrimidinic endonuclease 1. Antioxid. Redox Signal. 2014;20:678–707. doi: 10.1089/ars.2013.5492. - DOI - PMC - PubMed
    1. Antoniali G, et al. SIRT1 gene expression upon genotoxic damage is regulated by APE1 through nCaRE-promoter elements. Mol. Biol. Cell. 2014;25:532–547. doi: 10.1091/mbc.E13-05-0286. - DOI - PMC - PubMed
    1. Tell G, Fantini D, Quadrifoglio F. Understanding different functions of mammalian AP endonuclease (APE1) as a promising tool for cancer treatment. Cell Mol. Life Sci. 2010;67:3589–3608. doi: 10.1007/s00018-010-0486-4. - DOI - PMC - PubMed
    1. Chattopadhyay R, et al. Regulatory role of human AP-endonuclease (APE1/Ref-1) in YB-1-mediated activation of the multidrug resistance gene MDR1. Mol. Cell Biol. 2008;28:7066–7080. doi: 10.1128/MCB.00244-08. - DOI - PMC - PubMed
    1. Sengupta S, Mantha AK, Mitra S, Bhakat KK. Human AP endonuclease (APE1/Ref-1) and its acetylation regulate YB-1-p300 recruitment and RNA polymerase II loading in the drug-induced activation of multidrug resistance gene MDR1. Oncogene. 2011;30:428–493. doi: 10.1038/onc.2010.435. - DOI - PMC - PubMed

Publication types

MeSH terms