. 2017 Oct 6;8(1):793.
doi: 10.1038/s41467-017-00925-6.

Galectin-3 captures interferon-gamma in the tumor matrix reducing chemokine gradient production and T-cell tumor infiltration

Affiliations

Galectin-3 captures interferon-gamma in the tumor matrix reducing chemokine gradient production and T-cell tumor infiltration

Monica Gordon-Alonso et al. Nat Commun. .

Abstract

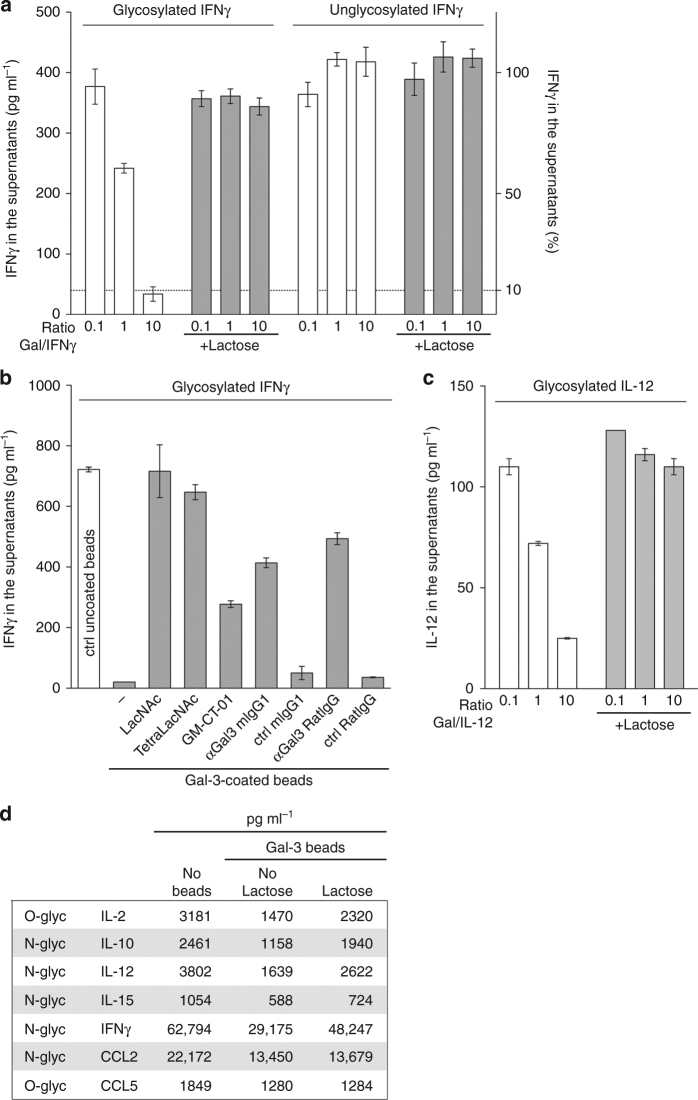
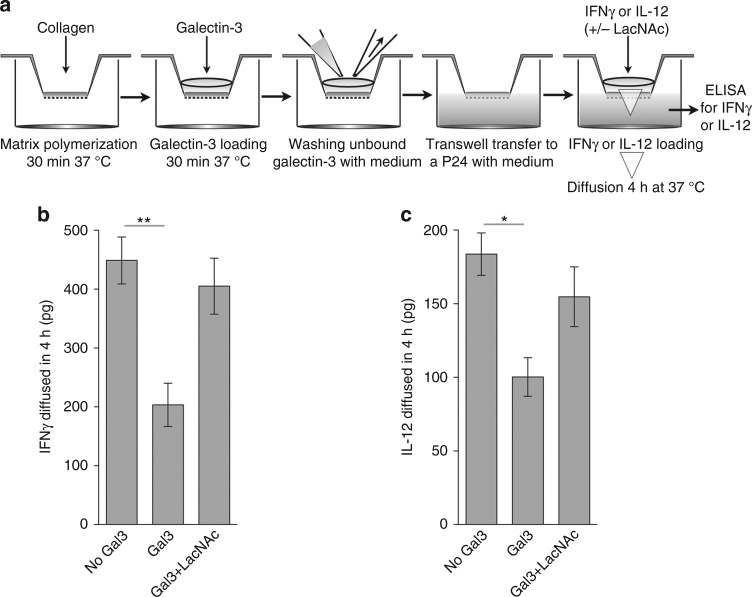
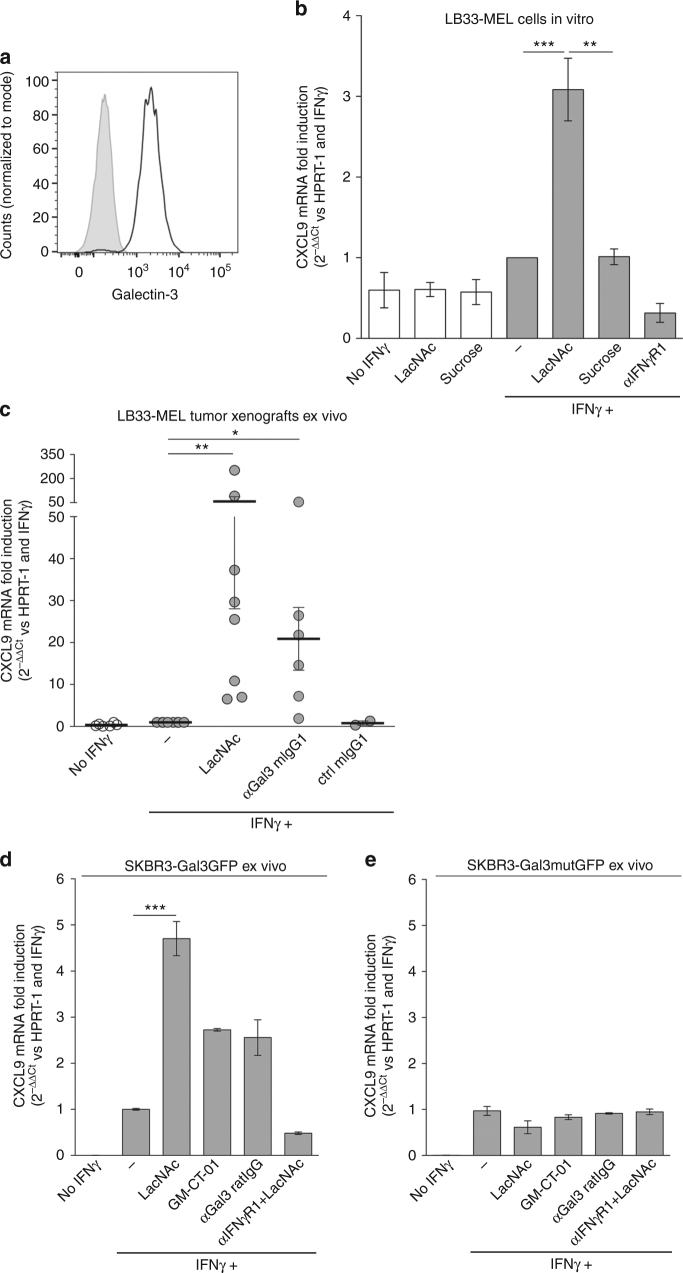
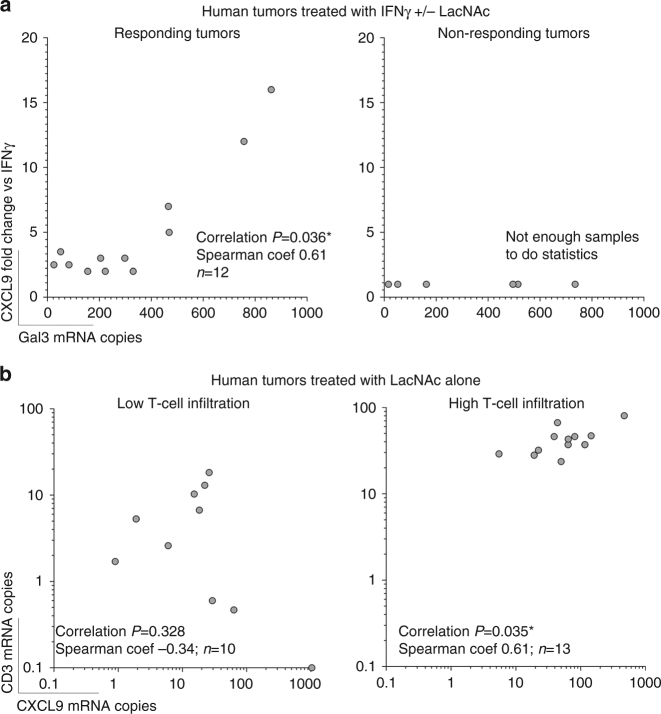
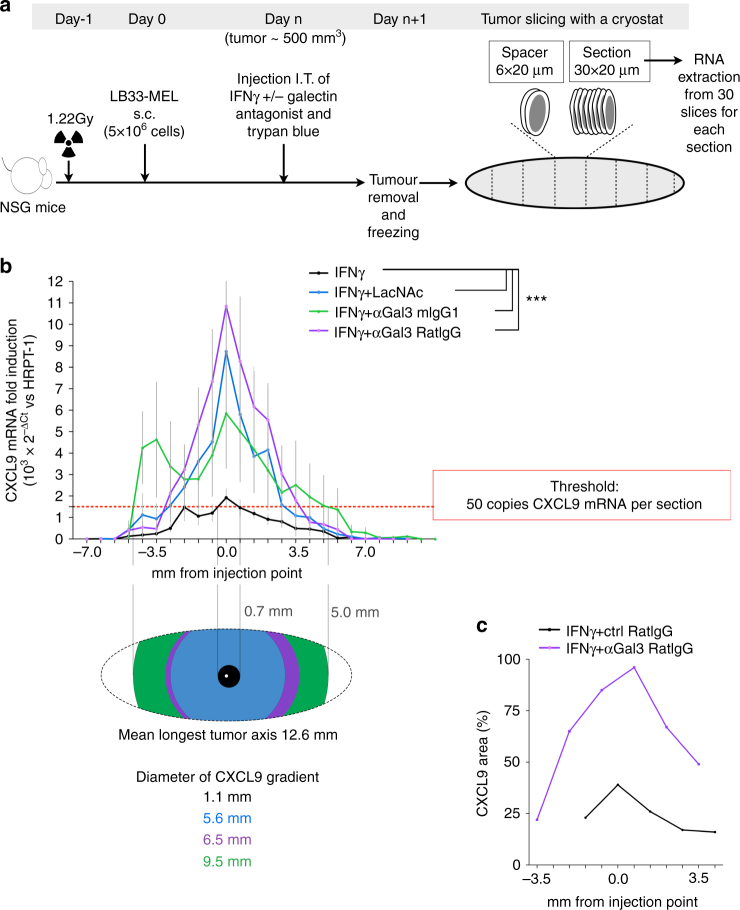
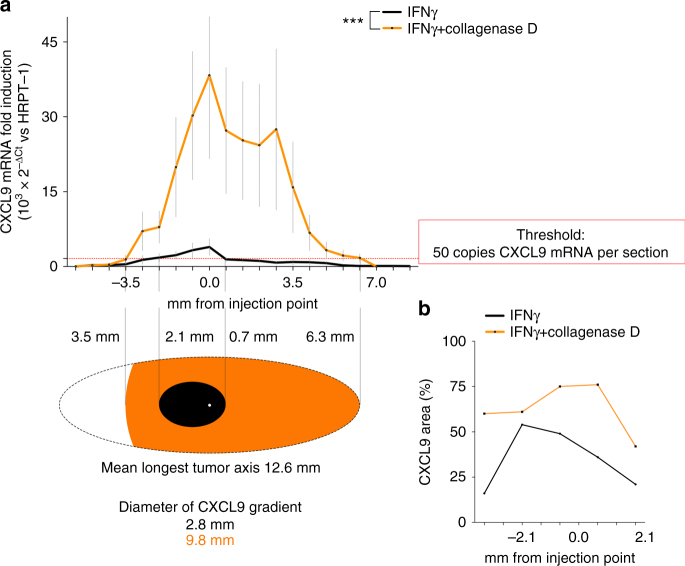
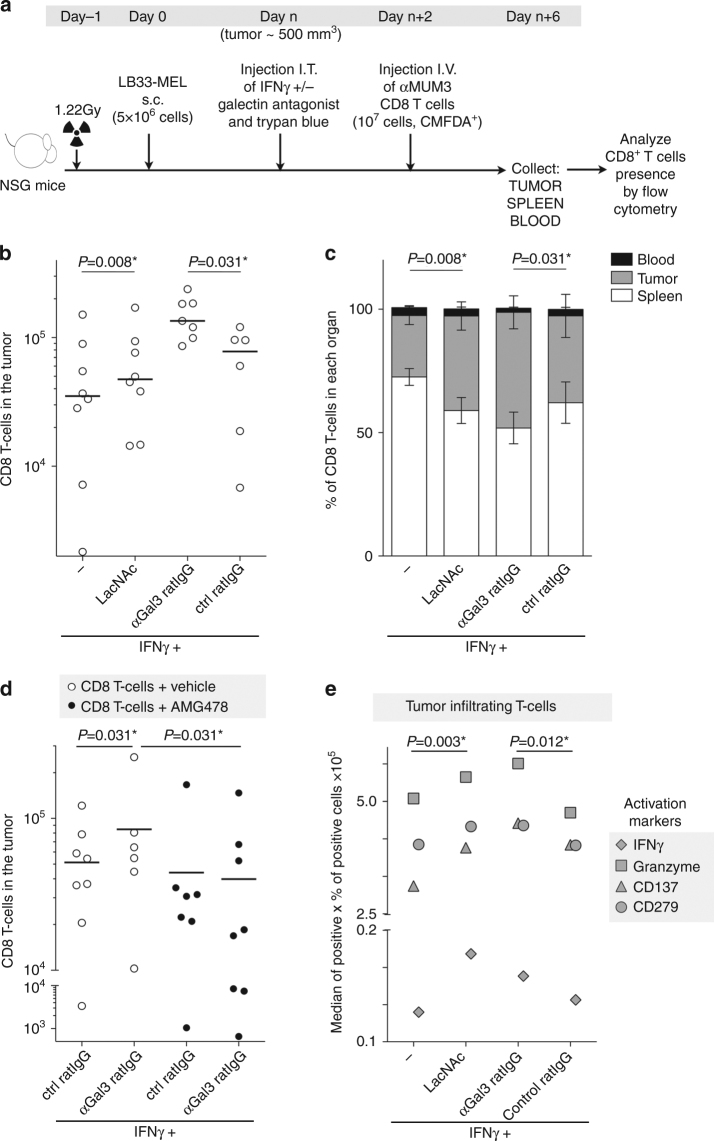
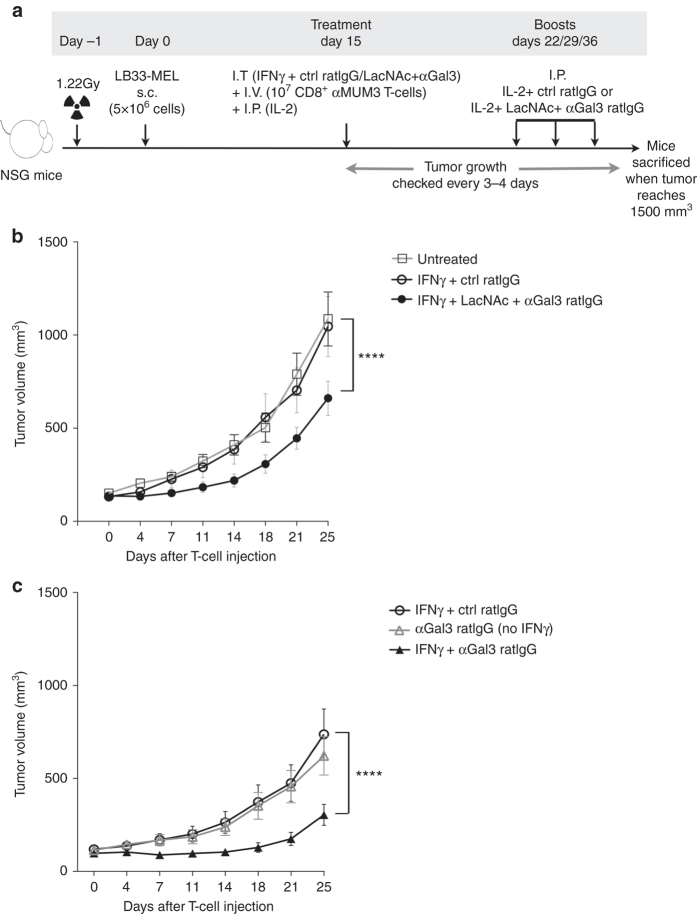
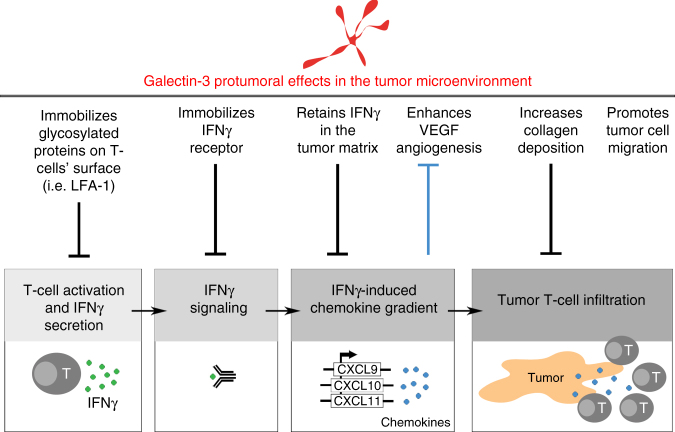
The presence of T cells in tumors predicts overall survival for cancer patients. However, why most tumors are poorly infiltrated by T cells is barely understood. T-cell recruitment towards the tumor requires a chemokine gradient of the critical IFNγ-induced chemokines CXCL9/10/11. Here, we describe how tumors can abolish IFNγ-induced chemokines, thereby reducing T-cell attraction. This mechanism requires extracellular galectin-3, a lectin secreted by tumors. Galectins bind the glycans of glycoproteins and form lattices by oligomerization. We demonstrate that galectin-3 binds the glycans of the extracellular matrix and those decorating IFNγ. In mice bearing human tumors, galectin-3 reduces IFNγ diffusion through the tumor matrix. Galectin antagonists increase intratumoral IFNγ diffusion, CXCL9 gradient and tumor recruitment of adoptively transferred human CD8+ T cells specific for a tumor antigen. Transfer of T cells reduces tumor growth only if galectin antagonists are injected. Considering that most human cytokines are glycosylated, galectin secretion could be a general strategy for tumor immune evasion.Most tumours are poorly infiltrated by T cells. Here the authors show that galectin-3 secreted by tumours binds both glycosylated IFNγ and glycoproteins of the tumour extracellular matrix, thus avoiding IFNγ diffusion and the formation of an IFNγ-induced chemokine gradient required for T cell infiltration.


Conflict of interest statement

The authors declare no competing financial interests.

Figures

Fig. 1
Fig. 1
Binding of human glycosylated cytokines to galectin-3-coated beads. Ratio refers to molar ratio. a hIFNγ measured by ELISA in the supernatant after incubation with galectin-3-coated beads in the presence or absence of 100 mM lactose. The glycosylated IFNγ was produced in CHO cells and the unglycosylated IFNγ was produced in E. coli. Mean ± SD of one representative experiment of 8 (glycosylated IFNγ) or 2 (unglycosylated IFNγ), performed in duplicates. The dotted line stresses that more than 90% of the glycosylated IFNγ was retained when mixed with 10 times more galectin-3-coated beads. b Glycosylated IFNγ measured by ELISA in the supernatant after incubation with galectin-3-coated beads and different galectin antagonists (LacNAc 5 mM, TetraLacNAc 30 μM, GM-CT-01 100 μg ml−1), anti-galectin-3 antibody or a control isotype (10 μg ml−1). Mean ± SD of one representative experiment of three. c Glycosylated hIL-12 measured by ELISA in the supernatant after incubation with galectin-3-coated beads in the presence or absence of 100 mM lactose. Mean ± SD of one representative experiment of three, performed in duplicates. d Cytokines and chemokines measured in a human synovial fluid collected from a rheumatoid arthritis patient after incubation with galectin-3-coated beads in the presence or absence of 100 mM lactose. Note: glycosylated cytokines and chemokines were entirely glycosylated, containing no detectable unglycosylated fraction
Fig. 2
Fig. 2
Reduced diffusion of glycosylated human IFNγ and IL-12 through galectin-3-loaded collagen matrices. a Schematic drawing of the protocol. Galectin-3 (1 μg per transwell), IFNγ (25 ng per transwell), IL-12 (7 ng per transwell), and LacNAc (1.2 mg per transwell). b IFNγ diffusion through collagen in 4 h was measured by ELISA. Mean ± SD of three experiments performed in duplicates. P = 0.006; Kruskal–Wallis test with Dunn’s Multiple Comparison Correction Test. c IL-12 diffusion through collagen after 4 h was measured by ELISA. Mean ± SD of three experiments performed in duplicates. P = 0.032; Kruskal–Wallis test with Dunn’s Multiple Comparison Correction Test
Fig. 3
Fig. 3
Galectin-3 in human tumors impedes CXCL9 induction by IFNγ. a Galectin-3 surface staining of melanoma cell line LB33-MEL. Control isotype staining is depicted in gray and galectin staining in black. b CXCL9 mRNA fold induction in LB33-MEL incubated for 4 h with IFNγ (50 ng ml−1), LacNAc (5 mM), sucrose (5 mM), and/or a neutralizing anti-IFNγR1 antibody (5 μg ml−1). Fold induction CXCL9 values were calculated using HPRT-1 as reference gene and with respect to IFNγ−treated condition (2−ΔΔCt). Mean ± SD of 3–10 experiments. ***P < 0.001 **P < 0.01; Kruskal–Wallis test with Dunn’s Multiple Comparison Correction Test. c CXCL9 mRNA fold induction in LB33-MEL xenografts treated ex vivo for 6 h with IFNγ (50 ng ml−1), LacNAc (10 mM), and/or different antibodies (10 μg ml−1). Each point represents one tumor. Mean ± SEM of eight independent experiments. **P < 0.01 *P < 0.05; Wilcoxon matched-pairs signed rank test with Dunn’s Multiple Comparison Correction Test. d, e CXCL9 mRNA fold induction for SKBR3-Gal3GFP (d) and SKBR3-Gal3mutGFP (e) xenografts treated for 6 h ex vivo with IFNγ (50 ng ml−1), LacNAc (10 mM), GM-CT-01 (100 μg ml−1), and/or antibodies (10 μg ml−1). Mean ± SEM of two independent experiments where pieces were pooled from 12 tumors SKBR3-Gal3GFP and 16 tumors SKBR3-Gal3mutGFP. ***P < 0.001; Wilcoxon matched-pairs signed rank test with Dunn’s Multiple Comparison Correction Test
Fig. 4
Fig. 4
Correlation between CXCL9 induction and T-cell infiltration or galectin-3 expression in human tumor biopsies treated ex vivo with galectin antagonists. Samples corresponding to those of Table 1. Correlation probabilities and non-parametric correlation coefficients are shown in each graph. a Correlation between CXCL9 induction (fold change induction in samples treated with IFNγ and LacNAc versus their corresponding samples treated with IFNγ alone) and galectin-3 expression in responding or non-responding tumors (having defined responding tumors such as those were CXCL9 fold change was at least two). b Correlation between CXCL9 and CD3 expressions in tumors treated with LacNAc alone and stratified depending on their T-cell infiltration. Tumors were considered as highly infiltrated if their CD3 expression was bigger than the average CD3 expression of all the tumor samples
Fig. 5
Fig. 5
Spreading of IFNγ signaling in tumor xenografts treated in vivo with galectin antagonists. a Scheme showing the protocol for analyzing IFNγ signal diffusion along the tumor. s.c. stands for subcutaneous injection and I.T. for intratumoral injection. b CXCL9 fold induction along the tumor sections. Mice treated with IFNγ alone (50 ng per tumor), or together with galectin antagonists LacNAc (0.1 μmol per tumor) or antibodies (100 ng per tumor). Mean ± SEM of eight independent tumors for each treatment. For CXCL9 induction in individual tumors see Supplementary Fig. 6a. ***P < 0.0001; Wilcoxon matched-pairs signed rank test with Dunn’s Multiple Comparison Correction Test. The red dotted line marks the threshold of 50 CXCL9 mRNA copies per section of the tumor. Each section represents 0.66 mm thick, contains 30 tumor slices, and about 1–4 millions cells. The drawing below shows the diffusion of CXCL9 gradient along the tumor taking into account the threshold. c Quantification of CXCL9 staining area in immunohistochemistry images of several sections of tumors treated with IFNγ and either a control isotype antibody or an anti-galectin3 ratIgG antibody. Representative images are shown in Supplementary Fig. 7
Fig. 6
Fig. 6
Spreading of IFNγ signaling in tumor xenografts treated in vivo with collagenase D. a CXCL9 fold induction along the tumor sections in mice treated with IFNγ alone (50 ng per tumor) or together with collagenase D (2.5 μg per tumor). Mean ± SEM of six independent tumors for each treatment. For CXCL9 induction in individual tumors see Supplementary Fig. 6b. ***P = 0.0006; Paired t-test, t = 4.035 and degree of freedom = 20. The red dotted line marks the threshold of 50 CXCL9 mRNA copies per section of the tumor. Each section represents 0.66 mm thick, contains 30 tumor slices, and about 1–4 millions cells. The drawing below shows the diffusion of CXCL9 gradient along the tumor taking into account the threshold. b Quantification of CXCL9 staining area in immunohistochemistry images of several sections of tumors treated either with IFNγ alone or combined with collagenase D. Representative images are shown in Supplementary Fig. 8
Fig. 7
Fig. 7
Anti-galectin treatments boost CD8+ T-cell infiltration in the tumor. a Scheme showing the protocol for analysis of T-cell infiltration in the tumor. s.c. stands for subcutaneous injection, I.T. for intratumoral injection, and I.V. for intravenous injection. The doses used for I.T. were IFNγ 50 ng per tumor, LacNAc 0.1 μmol per tumor, and antibodies 100 ng per tumor. b Absolute numbers of CD8+ T cells infiltrating the tumors of mice treated as explained above. Each point represents one mouse (average of quadruplicates). Lines represent the mean value for each treatment. Wilcoxon matched-pairs signed rank test. P-values are shown in the graph. Absolute numbers of CD8+ T cells in the spleens are shown in Supplementary Fig. 9a; n = 6–8 mice per group. c Percentage of CD8+ T cells found in the different compartments. Bars represent the mean ± SEM of 6–8 mice per group. Wilcoxon matched-pairs signed rank test. P-values regarding tumor and spleen proportions are shown in the graph. d Absolute numbers of CD8+ T cells infiltrating the tumors of mice treated or not with the CXCR3 inhibitor AMG478. Each point represents one mouse (average of quadruplicates). Lines represent the mean value for each treatment. Wilcoxon matched-pairs signed rank test. P-values are shown in the graph. Absolute numbers of CD8+ T cells in the spleens are shown in Supplementary Fig. 9a; n = 6–8 mice per group. e Global activation status of tumor infiltrating CD8+ T cells. Each symbol represents the mean value for the different activation markers (n = 6–8 mice per group). Wilcoxon matched-pairs signed rank test. P-values are shown in the graph. Representative histograms are shown in Supplementary Fig. 11
Fig. 8
Fig. 8
Galectin antagonists delay tumor growth. a Scheme showing the protocol for the analysis of tumor growth. s.c. stands for subcutaneous injection, I.T. for intratumoral injection, I.V. for intravenous injection, and I.P. for intraperitoneal injection. The doses used for the I.T. treatment were IFNγ 50 ng per tumor, LacNAc 0.1 μmol per tumor, and antibodies 100 ng per tumor. The doses used for the I.P. boosts were IL-2 200 ng per mouse, LacNAc 40 μmol per mouse, and antibodies 50 μg per mouse. b Tumor growth in mice untreated or treated with either IFNγ and a control isotype antibody or IFNγ  + LacNAc + αGal-3 antibody (n = 7, n = 10, and n = 11, respectively; mean ± SEM). Two-way ANOVA ****P < 0.0001, where treatment has F = 19.83, and degree of freedom = 1, and time has F = 24.91, and degree of freedom = 7. Individual tumor growths are shown in Supplementary Fig. 12. c Tumor growth in mice treated with IFNγ and a control isotype antibody, IFNγ and αGal-3 antibody or only with the αGal-3 antibody (n = 17, n = 18, and n = 10 respectively; mean ± SEM). Two-way ANOVA ****P < 0.0001, where treatment has F = 40.26, and degree of freedom = 1, and time has F = 13.52, and degree of freedom = 7. Individual tumor growths are shown in Supplementary Fig. 12
Fig. 9
Fig. 9
Scheme summarizing the main protumoral effects known for galectin-3 in the tumor microenvironment. Galectin-3 has been described to immobilize glycosylated proteins on the surface of T cells, , , , , IFNγ receptor on human fibroblasts and B cells, and VEGF receptor in human endothelial cells. In addition, galectin-3 favors collagen deposition by macrophages and tumor cell migration. This figure does not intend to make an exhaustive review about all the effects published for galectin-3 but to highlight the ones that, in our opinion, can be working simultaneously in the tumor microenvironment

References

    1. Munn DH, Bronte V. Immune suppressive mechanisms in the tumor microenvironment. Curr. Opin. Immunol. 2016;39:1–6. doi: 10.1016/j.coi.2015.10.009. - DOI - PMC - PubMed
    1. Galon J, et al. Type, density, and location of immune cells within human colorectal tumors predict clinical outcome. Science. 2006;313:1960–1964. doi: 10.1126/science.1129139. - DOI - PubMed
    1. Mahmoud SM, et al. Tumor-infiltrating CD8+lymphocytes predict clinical outcome in breast cancer. J. Clin. Oncol. 2011;29:1949–1955. doi: 10.1200/JCO.2010.30.5037. - DOI - PubMed
    1. Molon B, et al. Chemokine nitration prevents intratumoral infiltration of antigen-specific T cells. J. Exp. Med. 2011;208:1949–1962. doi: 10.1084/jem.20101956. - DOI - PMC - PubMed
    1. Salmon H, et al. Matrix architecture defines the preferential localization and migration of T cells into the stroma of human lung tumors. J. Clin. Invest. 2012;122:899–910. doi: 10.1172/JCI45817. - DOI - PMC - PubMed

Publication types

MeSH terms