. 2018 Aug;67(8):1454-1463.
doi: 10.1136/gutjnl-2017-314814. Epub 2017 Oct 7.

The oral microbiota in colorectal cancer is distinctive and predictive

Affiliations

The oral microbiota in colorectal cancer is distinctive and predictive

Burkhardt Flemer et al. Gut. 2018 Aug.

Abstract

Background and aims: Microbiota alterations are linked with colorectal cancer (CRC) and notably higher abundance of putative oral bacteria on colonic tumours. However, it is not known if colonic mucosa-associated taxa are indeed orally derived, if such cases are a distinct subset of patients or if the oral microbiome is generally suitable for screening for CRC.

Methods: We profiled the microbiota in oral swabs, colonic mucosae and stool from individuals with CRC (99 subjects), colorectal polyps (32) or controls (103).

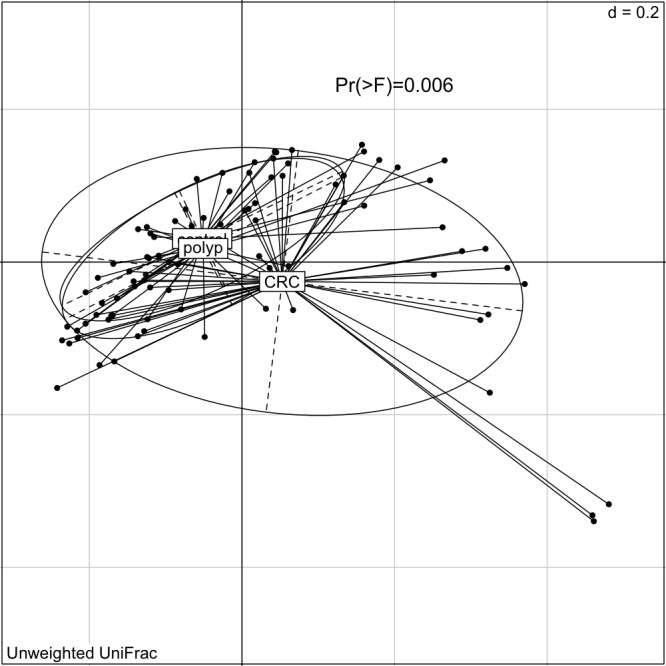
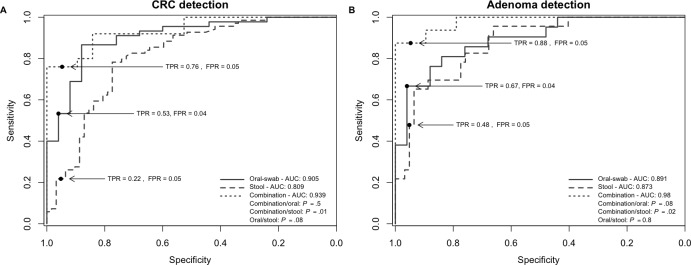
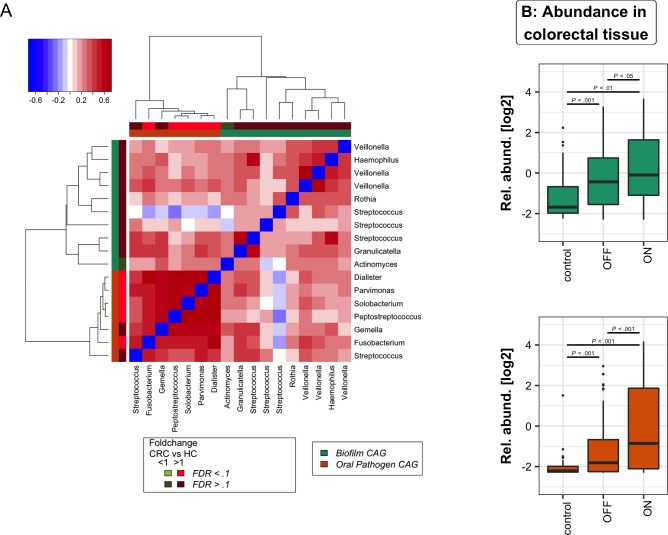
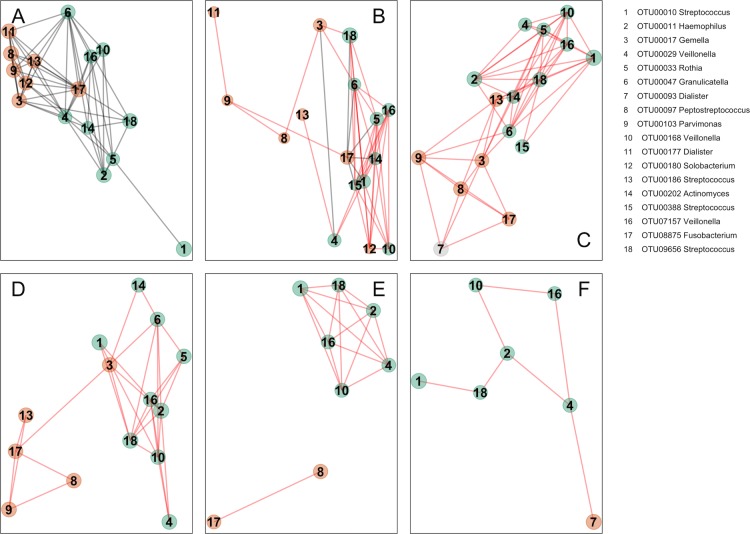
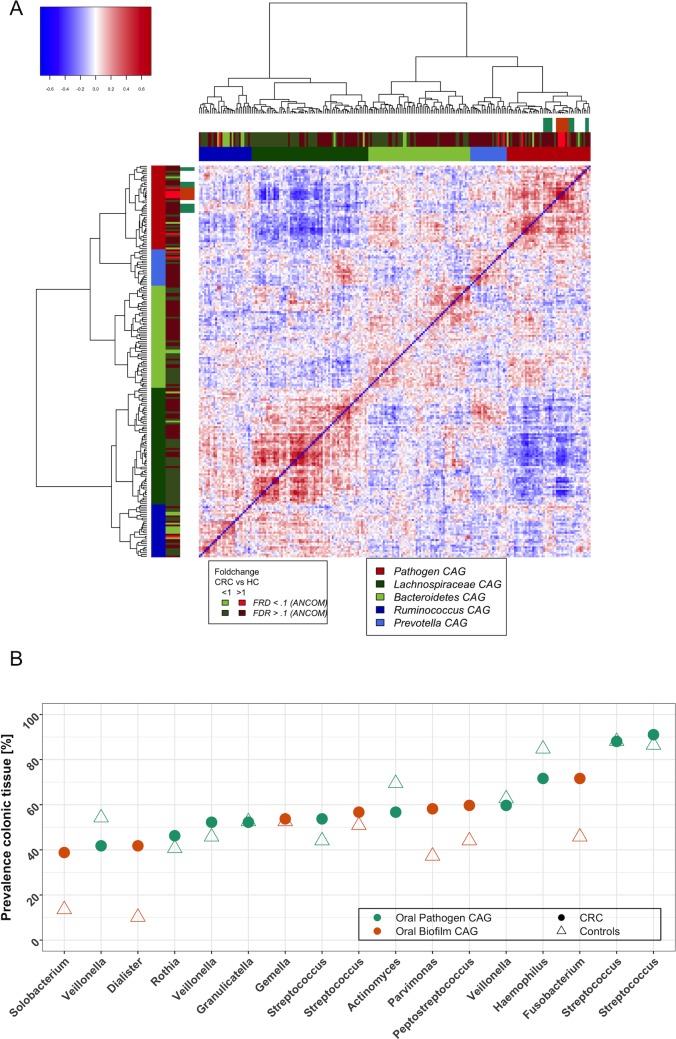
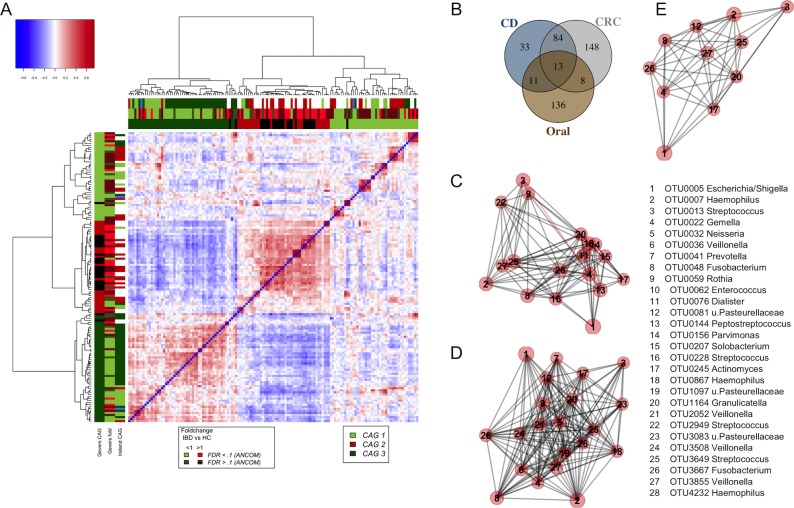
Results: Several oral taxa were differentially abundant in CRC compared with controls, for example, Streptococcus and Prevotellas pp. A classification model of oral swab microbiota distinguished individuals with CRC or polyps from controls (sensitivity: 53% (CRC)/67% (polyps); specificity: 96%). Combining the data from faecal microbiota and oral swab microbiota increased the sensitivity of this model to 76% (CRC)/88% (polyps). We detected similar bacterial networks in colonic microbiota and oral microbiota datasets comprising putative oral biofilm forming bacteria. While these taxa were more abundant in CRC, core networks between pathogenic, CRC-associated oral bacteria such as Peptostreptococcus, Parvimonas and Fusobacterium were also detected in healthy controls. High abundance of Lachnospiraceae was negatively associated with the colonisation of colonic tissue with oral-like bacterial networks suggesting a protective role for certain microbiota types against CRC, possibly by conferring colonisation resistance to CRC-associated oral taxa and possibly mediated through habitual diet.

Conclusion: The heterogeneity of CRC may relate to microbiota types that either predispose or provide resistance to the disease, and profiling the oral microbiome may offer an alternative screen for detecting CRC.

Keywords: colonic bacteria; colorectal cancer; colorectal cancer screening; diet; tumour markers.


Figures

Figure 1
Figure 1
The oral microbiota of individuals with CRC is statistically significantly different from that of healthy individuals. Shown is the PCoA of the unweighted UniFrac distance (significance assessed using PERMANOVA as described in Materials and Methods). CRC, colorectal cancer; PERMANOVA, permutational analysis of variance.
Figure 2
Figure 2
Oral and stool microbiota profiles are potential tools for the detection of CRC. (A and B) Receiver operating characteristic curves (ROC) and area under the curve (AUC) values for the prediction of CRC (A) and polyps (B) using microbiota profiles from oral swabs, stool or a combination of both. AUC values were highest for the combination test. Significance determined after DeLong (Materials and Methods). Sample numbers: swabs: n=25 (healthy controls), n=45 (CRCs), n=21 (polyps); stool: n=62 (healthy controls), n=69 (CRCs), n=23 (polyps); and combination: n=19 (healthy controls), n=25 (CRCs), n=16 (polyps). CRC, colorectal cancer; FPR, false-positive rate; TPR, true-positive rate.
Figure 3
Figure 3
Oral bacterial networks are detected in colonic mucosa and are enriched in CRC. (A) Clustering of the 17 oral bacterial OTUs associated with tumour tissue into two coabundance groups (CAGs). CAGs were defined on the basis of the clusters in the vertical or horizontal trees and named after their most notable characteristic. Column and row bars indicate bacterial CAGs (as per legend to the bottom right) and fold change between individuals with CRC and healthy controls (as per legend to the bottom left). Legend top left: colour-scale correlation coefficient. (B) The two CAGs comprising typically oral bacteria (oral pathogen CAG and biofilm CAG) were more abundant in colonic microbiota of CRC. Shown are boxplots of relative abundances of the two CAGs in colon tissue. n (controls)=59, n (off)=105, n (tumours)=67. CRC, colorectal cancer; FDR, false discovery rate; HC, healthy controls; OTUs, operational taxonomic units.
Figure 4
Figure 4
Bacterial networks detected at colonic mucosal surfaces (panels A,C,D) are similar to those networks detected at oral mucosal surfaces (B) and were not or only partially detected in faecal samples (panels E,F). Shown are network plots of bacterial OTUs found in both the oral cavity and colonic microbiota in different groups of samples: (A) diseased colorectal tissue (ON; 65 individuals with CRC and 2 polyps), (B) oral swab samples (45 individuals with CRC, 21 individuals with polyps and 25 healthy controls), (C) undiseased colorectal tissue (off) from 74 individuals with CRC and 31 individuals with polyps, (D) colorectal tissue from 59 healthy controls, (E) faecal samples from 69 individuals with CRC and 23 individuals with polyps and (F) faecal samples from 62 healthy controls. For each group of samples, the OTUs shared with the oral cavity was determined separately. The size of each node (OTU) correlates to the mean abundance of each OTU across all samples in each respective sample group. The colour of each node corresponds to the CAG determined using diseased colorectal tissue only (figure 3A). One OTU (no. 7, panel C) was only shared between undiseased colorectal tissue and the oral cavity, and it is thus coloured grey. The width of each edge corresponds to the p value of the correlation between each respective node (lower p value, higher line width). The location of each node was determined by a PCoA of the correlation distance as described in Materials and Methods. Only nodes with at least one significant edge are shown. Legend to the right: genus-level classification using RDP reference, version 14 of OTU representative sequences. CRC, colorectal cancer; ON, sample from the cancer or polyp; OTUs, operational taxonomic units; PCoA, Principal Coordinates Analysis; RDP, Ribosomal Database Project.
Figure 5
Figure 5
Oral bacterial colonisation of human CRCs is negatively associated with the colonic mucosal abundance of the Lachnospiraceae CAG. (A) The relative abundance of oral pathogens at colonic lesions (found mostly in bright red CAG) is negatively correlated with the relative abundance of OTUs clustered in a CAG mainly comprising Lachnospiraceae (Lachnospiraceae CAG; dark green CAG). Shown is the heatplot of the correlation values between OTUs detected at colonic mucosal surfaces. CAGs were defined on the basis of the clusters in the vertical or horizontal trees and named after their most notable characteristic. Column and row bars indicate bacterial CAGs (as per legend to the bottom right), fold change between individuals with CRC and healthy controls (as per legend to the bottom left) and bacterial CAGs determined with only the subset of 17 OTUs found both at colonic and oral mucosal surfaces (figure 3A). Legend top left: colour-scale correlation coefficient. (B) Scatterplot of the colonic prevalence of bacterial OTUs associated with oral pathogen and biofilm CAGs (figure 3A). Most OTUs were only detected on a subset of CRCs and polyps (circle) or healthy controls (triangle). CAGs, coabundance groups; CRCs, colorectal cancer; OTUs, operational taxonomic units.
Figure 6
Figure 6
Similarity of non-neoplastic and neoplastic colonic disease associated bacterial profiles. (A) Shown is the heatplot of the correlation values between OTUs associated with rectal tissue of children with and without CD. CAGs were defined on the basis of the clusters in the vertical or horizontal trees and named after their most notable characteristic. Column and row bars indicate bacterial CAGs (as per legend to the bottom right), fold change between individuals with CD and healthy controls (as per legend to the bottom left). Additionally, two row and column bars indicate the CAG in the Irish CRC cohort (figure 4A) and the fold change between individuals with CRCs/polyps and healthy controls. Legend top left: colour scale correlation coefficient. (B) Venn diagram of bacteria found in colorectal tissue of children with CD, colorectal tumours and oral swabs. (C–E) Network plots of bacterial OTUs found in both the oral cavity and different colonic tissue samples: (C) tumours (ON; 65 individuals with CRC and 2 polyps), (D) mucosa from children with CD (n=201) and (E) mucosa from healthy children (n=122). For each group of samples, the OTUs shared with the oral cavity was determined separately. The size of each node (OTU) correlates to the mean abundance of each OTU across all samples in each respective sample group. The width of each edge corresponds to the p value of the correlation between each respective node (lower p value, higher line width). The location of each node was determined by a PCoA of the correlation distance as described in Materials and Methods. Only nodes with at least one significant edge are shown. Legend to the right: genus-level classification using RDP reference, version 14 of OTU representative sequences. CAGs, coabundance groups; CD, Crohn’s disease; CRCs, colorectal cancer; OTUs, operational taxonomic units; PCoA, Principal Coordinates Analysis; RDP, Ribosomal Database Project.

Comment in

References

    1. Polk DB, Peek RM. Helicobacter pylori: gastric cancer and beyond. Nat Rev Cancer 2010;10:403–14. 10.1038/nrc2857 - DOI - PMC - PubMed
    1. Mf G, Smoot DT, pylori H. gastric malt lymphoma, and adenocarcinoma of the stomach. Semin Gastrointest Dis 2000;11:134–41 https://www.ncbi.nlm.nih.gov/pubmed/10950459 - PubMed
    1. Flemer B, Lynch DB, Brown JM, et al. . Tumour-associated and non-tumour-associated microbiota in colorectal cancer. Gut 2017;66:633–43. 10.1136/gutjnl-2015-309595 - DOI - PMC - PubMed
    1. Baxter NT, Ruffin MT, Rogers MA, et al. . Microbiota-based model improves the sensitivity of fecal immunochemical test for detecting colonic lesions. Genome Med 2016;8:37 10.1186/s13073-016-0290-3 - DOI - PMC - PubMed
    1. Zeller G, Tap J, Voigt AY, et al. . Potential of fecal microbiota for early-stage detection of colorectal cancer. Mol Syst Biol 2014;10:766 doi:10.15252/msb.20145645 - DOI - PMC - PubMed

Publication types