

Immunological effects of everolimus in patients with metastatic renal cell cancer
- PMID: 28988508
- PMCID: PMC5806813
- DOI: 10.1177/0394632017734459
Immunological effects of everolimus in patients with metastatic renal cell cancer
Abstract
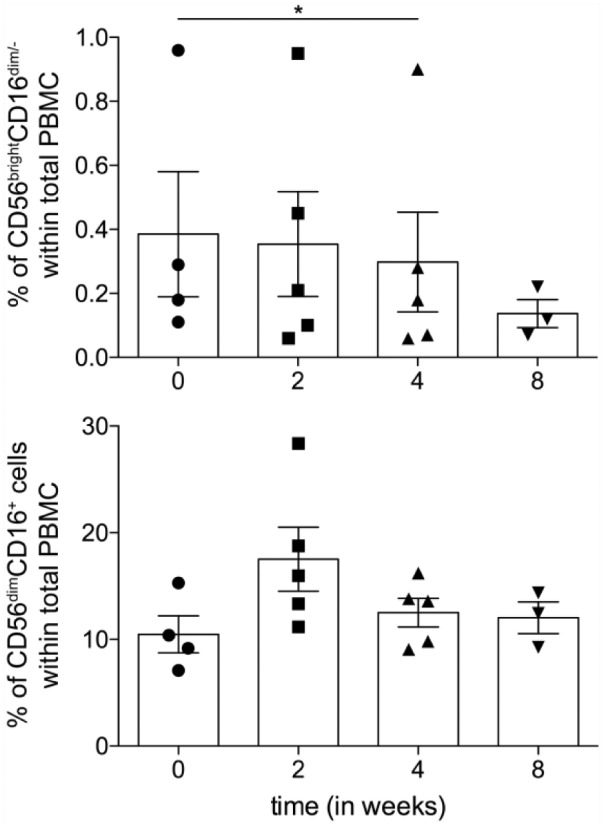
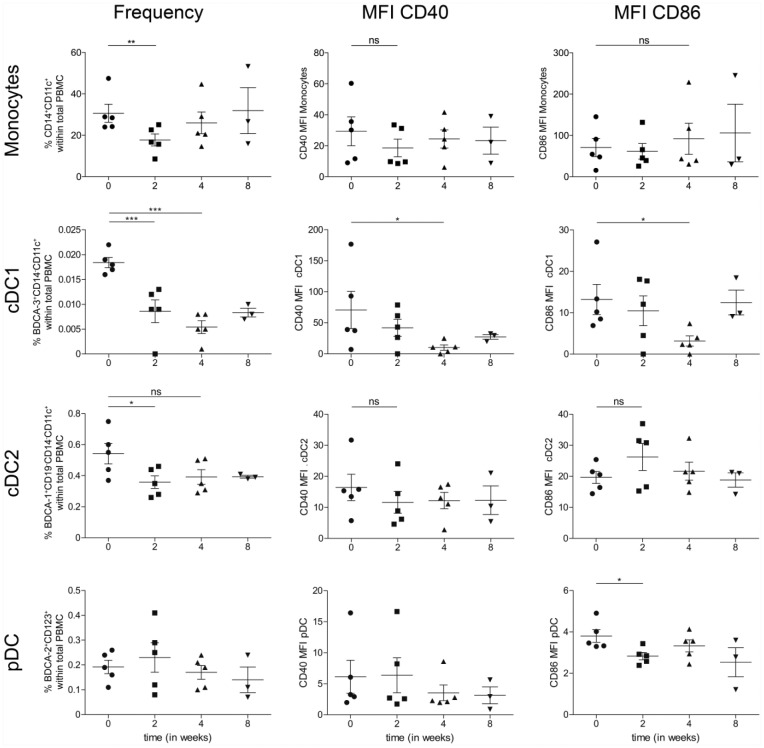
The mammalian target of rapamycin (mTOR) is a crucial kinase present in all cells. Besides its role in the regulation of cell-growth, proliferation, angiogenesis, and survival of malignant tumors, mTOR additionally plays an important role in immune regulation by controlling the balance between effector T cells and regulatory T cells (Tregs). This critically affects the suppressive state of the immune system. Here, the systemic immunological effects of everolimus treatment were comprehensively investigated in five patients with metastatic renal cell cancer. In this hypothesis generating study, the immunological alterations in circulating immune subsets induced by everolimus included a (non-significant) increase in the frequency of Tregs, a significant increase in monocytic myeloid-derived suppressor cells, a significant decrease in the frequency of immunoregulatory natural killer cells, classical CD141+ (cDC1) and CD1c+ (cDC2) dendritic cell subsets, as well as a decrease in the activation status of plasmacytoid dendritic cells and cDC1. These date indicate that the immunological effects of everolimus affect multiple immune cell subsets and altogether tip the balance in favor of immunosuppression, which can be considered a detrimental effect in the treatment of cancer, and may require combination treatment with agents able to negate immune suppression and boost T cell immunity.
Keywords: Treg; everolimus; immune monitoring; mTOR; suppression.
Conflict of interest statement
Figures


Similar articles
-
The effect of everolimus and low-dose cyclophosphamide on immune cell subsets in patients with metastatic renal cell carcinoma: results from a phase I clinical trial.Cancer Immunol Immunother. 2019 Mar;68(3):503-515. doi: 10.1007/s00262-018-2288-8. Epub 2019 Jan 17. Cancer Immunol Immunother. 2019. PMID: 30652208 Free PMC article. Clinical Trial.
-
Metronomic cyclophosphamide attenuates mTOR-mediated expansion of regulatory T cells, but does not impact clinical outcome in patients with metastatic renal cell cancer treated with everolimus.Cancer Immunol Immunother. 2019 May;68(5):787-798. doi: 10.1007/s00262-019-02313-z. Epub 2019 Feb 11. Cancer Immunol Immunother. 2019. PMID: 30756132 Free PMC article. Clinical Trial.
-
Phase I-II study of everolimus and low-dose oral cyclophosphamide in patients with metastatic renal cell cancer.BMC Cancer. 2011 Nov 30;11:505. doi: 10.1186/1471-2407-11-505. BMC Cancer. 2011. PMID: 22129044 Free PMC article. Clinical Trial.
-
Hypertension Caused by Lenvatinib and Everolimus in the Treatment of Metastatic Renal Cell Carcinoma.Int J Mol Sci. 2017 Aug 10;18(8):1736. doi: 10.3390/ijms18081736. Int J Mol Sci. 2017. PMID: 28796163 Free PMC article. Review.
-
Role of natural and adaptive immunity in renal cell carcinoma response to VEGFR-TKIs and mTOR inhibitor.Int J Cancer. 2014 Jun 15;134(12):2772-7. doi: 10.1002/ijc.28503. Epub 2013 Nov 18. Int J Cancer. 2014. PMID: 24114790 Review.
Cited by
-
Targeting mTOR and survivin concurrently potentiates radiation therapy in renal cell carcinoma by suppressing DNA damage repair and amplifying mitotic catastrophe.J Exp Clin Cancer Res. 2024 Jun 6;43(1):159. doi: 10.1186/s13046-024-03079-8. J Exp Clin Cancer Res. 2024. PMID: 38840237 Free PMC article.
-
Inhibition of androgen receptor enhanced the anticancer effects of everolimus through targeting glucose transporter 12.Int J Biol Sci. 2023 Jan 1;19(1):104-119. doi: 10.7150/ijbs.75106. eCollection 2023. Int J Biol Sci. 2023. PMID: 36594084 Free PMC article.
-
The effect of everolimus and low-dose cyclophosphamide on immune cell subsets in patients with metastatic renal cell carcinoma: results from a phase I clinical trial.Cancer Immunol Immunother. 2019 Mar;68(3):503-515. doi: 10.1007/s00262-018-2288-8. Epub 2019 Jan 17. Cancer Immunol Immunother. 2019. PMID: 30652208 Free PMC article. Clinical Trial.
-
Metronomic cyclophosphamide attenuates mTOR-mediated expansion of regulatory T cells, but does not impact clinical outcome in patients with metastatic renal cell cancer treated with everolimus.Cancer Immunol Immunother. 2019 May;68(5):787-798. doi: 10.1007/s00262-019-02313-z. Epub 2019 Feb 11. Cancer Immunol Immunother. 2019. PMID: 30756132 Free PMC article. Clinical Trial.
-
Preparation and study of two kinds of ophthalmic nano-preparations of everolimus.Drug Deliv. 2019 Dec;26(1):1235-1242. doi: 10.1080/10717544.2019.1692966. Drug Deliv. 2019. PMID: 31752553 Free PMC article.
References
-
- Siegel RL, Miller KD, Jemal A. (2016) Cancer statistics, 2016. CA: A Cancer Journal for Clinicians 66: 7–30. - PubMed
-
- Moch H, Cubilla AL, Humphrey PA, et al. (2016) The 2016 WHO classification of tumours of the urinary system and male genital organs-part A: Renal, penile, and testicular tumours. European Urology 70: 93–105. - PubMed
MeSH terms
Substances
LinkOut - more resources
Full Text Sources
Other Literature Sources
Medical
Miscellaneous
