. 2017 Sep 1;8(9):6508-6519.
doi: 10.1039/c7sc01974b. Epub 2017 Jul 21.

Rapid determination of medulloblastoma subgroup affiliation with mass spectrometry using a handheld picosecond infrared laser desorption probe

Affiliations

Rapid determination of medulloblastoma subgroup affiliation with mass spectrometry using a handheld picosecond infrared laser desorption probe

Michael Woolman et al. Chem Sci. .

Abstract

Medulloblastoma (MB), the most prevalent malignant childhood brain tumour, consists of at least 4 distinct subgroups each of which possesses a unique survival rate and response to treatment. To rapidly determine MB subgroup affiliation in a manner that would be actionable during surgery, we subjected murine xenograft tumours of two MB subgroups (SHH and Group 3) to Mass Spectrometry (MS) profiling using a handheld Picosecond InfraRed Laser (PIRL) desorption probe and interface developed by our group. This platform provides real time MS profiles of tissue based on laser desorbed lipids and small molecules with only 5-10 seconds of sampling. PIRL-MS analysis of ex vivo MB tumours offered a 98% success rate in subgroup determination, observed over 194 PIRL-MS datasets collected from 19 independent tumours (∼10 repetitions each) utilizing 6 different established MB cell lines. Robustness was verified by a 5%-leave-out-and-remodel test. PIRL ablated tissue material was collected on a filter paper and subjected to high resolution LC-MS to provide ion identity assignments for the m/z values that contribute most to the statistical discrimination between SHH and Group 3 MB. Based on this analysis, rapid classification of MB with PIRL-MS utilizes a variety of fatty acid chains, glycerophosphates, glycerophosphoglycerols and glycerophosphocholines rapidly extracted from the tumours. In this work, we provide evidence that 5-10 seconds of sampling from ex vivo MB tissue with PIRL-MS can allow robust tumour subgroup classification, and have identified several biomarker ions responsible for the statistical discrimination of MB Group 3 and the SHH subgroup. The existing PIRL-MS platform used herein offers capabilities for future in vivo use.


Figures

Fig. 1
Fig. 1. The PIRL-MS spectra of SHH and Group 3 MB tumours. We used DAOY and MED8A derived xenografts for this assessment as representatives for the SHH and Group 3 MB, respectively. These two particular tumours were chosen only on the basis of sample availability. The PIRL-MS spectra were collected for 10 seconds in the negative ion mode using the interface described previously. The differentiating m/z values in each of the spectra are labeled. As can be seen, the specificity of PIRL extracted lipids results in different PIRL-MS lipid profiles for MB subgroups. Table 1 provides a list of the m/z ratios characteristic to each MB subgroup.
Fig. 2
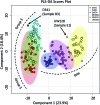
Fig. 2. Statistical discrimination of the SHH and Group 3 MB based on 5–10 second PIRL-MS analysis. PIRL-MS spectra collected in the negative ion mode in less than 10 seconds from 19 tumours comprised of murine xenografts from 6 established MB cell lines of D341, D458 and MED8A (for Group 3) and DAOY, ONS76 and UW228 (for SHH) with 10 repetitions from each tumour were processed as described and subjected to multivariate analysis using PLS-DA through the MetaboAnalyst portal. (A) PLS-DA scores plot. 194 data points, each comprised of a single 5–10 second PIRL-MS spectrum, are shown to be statistically grouped into their expected classes. The shaded ovals represent the 95% confidence interval. No data point from one class is found within the 95% confidence interval area of the other class (misclassification). Three outliers were detected outside the 95% confidence interval and are discussed in text. Internal sample name designation names are used. (B) The PLS-DA loading plot. The data points represent individual m/z values in the rank order that they contribute to the statistical discrimination between PIRL-MS profiles of the SHH and Group 3 MB tumours shown in the scores plot in (A). The m/z values that are located to the periphery (left and right), along the axis of separation shown in (A) of the loading plot space contribute most strongly to the statistical discrimination of the two MB subgroups examined in this work, and could be considered as univariate biomarker ions of each MB subgroup. The majority of the m/z values identified in PLS-DA loading plot were present in the single cell line representative PIRL-MS spectra shown in Fig. 1 using DAOY and MED8A tumours. The m/z values labeled in blue font are identified through PLS-DA but were not typical to MED8A or DAOY profiles that constituted the basis of our targeted assessment.
Fig. 3
Fig. 3. Specificity of PIRL-MS analysis allows statistical discrimination of some MB cell lines based on lipid content. The 194 PIRL-MS spectra of MB xenografts were first grouped based on their respective cell line origins and subjected to a 6-component Partial Least Squares Discriminant Analysis (PLS-DA). Shaded ovals represent the 95% confidence interval. Two outliers are noted that contained weaker than average MS signal. The outlier UW228 sample E1 had only 149 mass peaks identified in its PIRL-MS spectrum, and the weak signal associated with D341, sample B3 (TIC = 6.9 × 10⁴) resulted in only 105 identified peaks. These peak numbers are smaller than those expected for data points that classify well within the model (see ESI†).
Fig. 4
Fig. 4. Low complexity Partial Least Squares Discriminant Analysis (PLS-DA) suggests that the discovered biomarker ions are robust determinants of MB subgroup affiliation. Here we performed PLS-DA assessment of the statistical discrimination between Group 3 and SHH subgroups (A) as well as between the 6 MB cell lines of D341, D458, MED8A, DAOY, ONS76 and UW228 (B) using only ∼30 m/z values listed in Table 1 as biomarker ions for SHH and Group 3 MB. As illustrated here, in both cases, this reduced complexity assessment resulted in approximately the same pattern of statistical separation seen in both Fig. 2 and 3 using the full m/z range. This observation further suggests that the lower than 50% data utilization in components 1, 2 of the full m/z range PLS-DA shown in Fig. 2 and 3 is not due to harboring noise. This assessment used a mass tolerance of 25 mDa after post process correction of mass shift using internal mass lock, as described in the method section.

References

    1. Northcott P. A., Korshunov A., Witt H., Hielscher T., Eberhart C. G., Mack S., Bouffet E., Clifford S. C., Hawkins C. E., French P., Rutka J. T., Pfister S., Taylor M. D. J. Clin. Oncol. 2011;29:1408–1414. - PMC - PubMed
    1. Ramaswamy V., Remke M., Bouffet E., Bailey S., Clifford S. C., Doz F., Kool M., Dufour C., Vassal G., Milde T., Witt O., von Hoff K., Pietsch T., Northcott P. A., Gajjar A., Robinson G. W., Padovani L., Andre N., Massimino M., Pizer B., Packer R., Rutkowski S., Pfister S. M., Taylor M. D., Pomeroy S. L. Acta Neuropathol. 2016;131:821–831. - PMC - PubMed
    1. Sabha N., Knobbe C. B., Maganti M., Al Omar S., Bernstein M., Cairns R., Cako B., von Deimling A., Capper D., Mak T. W., Kiehl T. R., Carvalho P., Garrett E., Perry A., Zadeh G., Guha A., Sidney C. Neuro-Oncology. 2014;16:914–923. - PMC - PubMed
    1. Gottardo N. G., Hansford J. R., McGlade J. P., Alvaro F., Ashley D. M., Bailey S., Baker D. L., Bourdeaut F., Cho Y. J., Clay M., Clifford S. C., Cohn R. J., Cole C. H., Dallas P. B., Downie P., Doz F., Ellison D. W., Endersby R., Fisher P. G., Hassall T., Heath J. A., Hii H. L., Jones D. T., Junckerstorff R., Kellie S., Kool M., Kotecha R. S., Lichter P., Laughton S. J., Lee S., McCowage G., Northcott P. A., Olson J. M., Packer R. J., Pfister S. M., Pietsch T., Pizer B., Pomeroy S. L., Remke M., Robinson G. W., Rutkowski S., Schoep T., Shelat A. A., Stewart C. F., Sullivan M., Taylor M. D., Wainwright B., Walwyn T., Weiss W. A., Williamson D., Gajjar A. Acta Neuropathol. 2014;127:189–201. - PMC - PubMed
    1. Ifa D. R., Eberlin L. S. Clin. Chem. 2016;62:111–123. - PMC - PubMed

LinkOut - more resources