

Start-to-end simulation of single-particle imaging using ultra-short pulses at the European X-ray Free-Electron Laser
- PMID: 28989713
- PMCID: PMC5619849
- DOI: 10.1107/S2052252517009496
Start-to-end simulation of single-particle imaging using ultra-short pulses at the European X-ray Free-Electron Laser
Abstract
Single-particle imaging with X-ray free-electron lasers (XFELs) has the potential to provide structural information at atomic resolution for non-crystalline biomolecules. This potential exists because ultra-short intense pulses can produce interpretable diffraction data notwithstanding radiation damage. This paper explores the impact of pulse duration on the interpretability of diffraction data using comprehensive and realistic simulations of an imaging experiment at the European X-ray Free-Electron Laser. It is found that the optimal pulse duration for molecules with a few thousand atoms at 5 keV lies between 3 and 9 fs.
Keywords: X-ray free-electron lasers; diffraction; scattering; simulations; single-particle imaging.
Figures
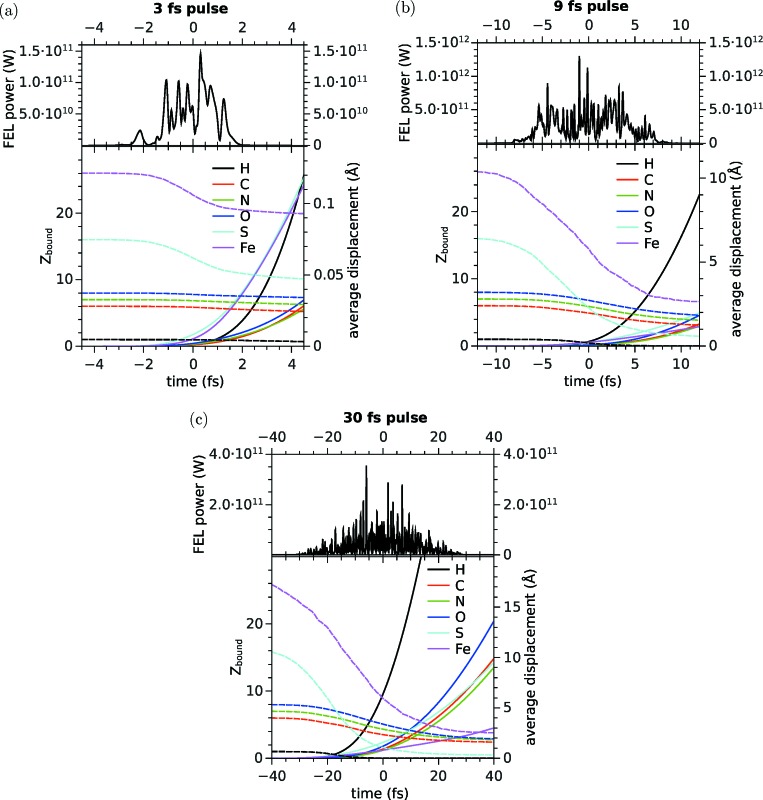
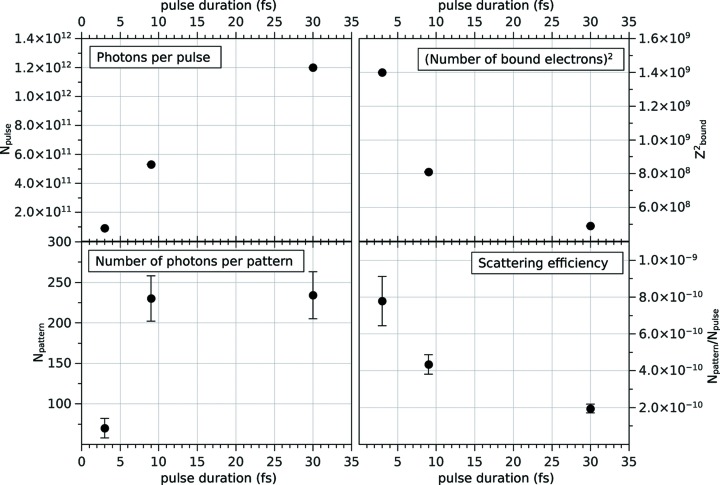
 ) in the middle of the pulse. (Bottom right) The scattering efficiency N
ph,det/N
ph,pulse. The decrease in N
e,bound as a consequence of ionization processes results in a reduced scattering efficiency with increasing pulse duration. Nevertheless, the total number of detected photons increases, since the longer pulses contain more photons.
) in the middle of the pulse. (Bottom right) The scattering efficiency N
ph,det/N
ph,pulse. The decrease in N
e,bound as a consequence of ionization processes results in a reduced scattering efficiency with increasing pulse duration. Nevertheless, the total number of detected photons increases, since the longer pulses contain more photons.
References
-
- Allahgholi, A. et al. (2015). J. Instrum. 10, C01023.
-
- Altarelli, M. (2015). High Power Laser Sci. Eng. 3, e18.
-
- Barty, A. (2016). Curr. Opin. Struct. Biol. 40, 186–194. - PubMed
LinkOut - more resources
Full Text Sources
Other Literature Sources
