

Experimental phase determination with selenomethionine or mercury-derivatization in serial femtosecond crystallography
- PMID: 28989719
- PMCID: PMC5619855
- DOI: 10.1107/S2052252517008557
Experimental phase determination with selenomethionine or mercury-derivatization in serial femtosecond crystallography
Abstract
Serial femtosecond crystallography (SFX) using X-ray free-electron lasers (XFELs) holds enormous potential for the structure determination of proteins for which it is difficult to produce large and high-quality crystals. SFX has been applied to various systems, but rarely to proteins that have previously unknown structures. Consequently, the majority of previously obtained SFX structures have been solved by the molecular replacement method. To facilitate protein structure determination by SFX, it is essential to establish phasing methods that work efficiently for SFX. Here, selenomethionine derivatization and mercury soaking have been investigated for SFX experiments using the high-energy XFEL at the SPring-8 Angstrom Compact Free-Electron Laser (SACLA), Hyogo, Japan. Three successful cases are reported of single-wavelength anomalous diffraction (SAD) phasing using X-rays of less than 1 Å wavelength with reasonable numbers of diffraction patterns (13 000, 60 000 and 11 000). It is demonstrated that the combination of high-energy X-rays from an XFEL and commonly used heavy-atom incorporation techniques will enable routine de novo structural determination of biomacromolecules.
Keywords: SAD phasing; XFELs; mercury soaking; selenomethionine derivatization; serial femtosecond crystallography.
Figures
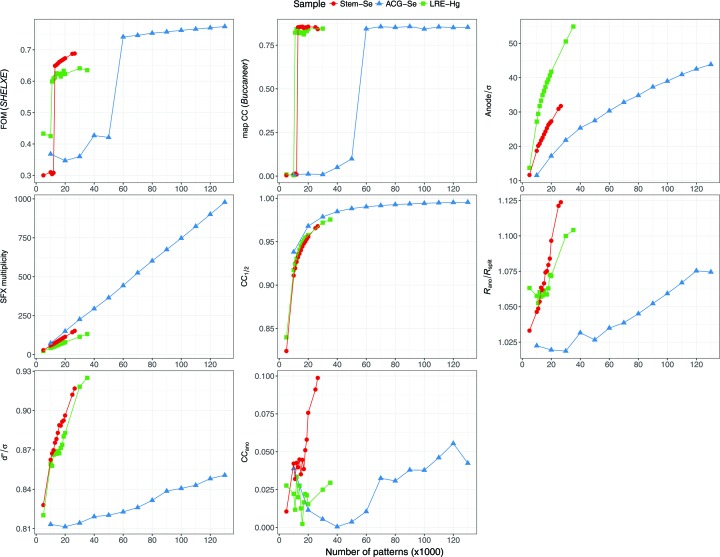
 was calculated with FA and σ(FA) in the output of SHELXC (Sheldrick, 2010 ▸). The high-resolution cutoffs for Stem-Se, ACG-Se and LRE-Hg are 1.4, 1.5 and 1.5 Å, respectively. Note that the reason why the overall multiplicities do not increase in the same way despite the same Laue symmetry (for Stem-Se and LRE-Hg) is (i) a different resolution cutoff, (ii) a per-pattern resolution cutoff in merging, and (iii) different reciprocal-lattice point sizes determined for each pattern. This figure was prepared using ggplot2 (Wickham, 2009 ▸) in R (R Development Core Team, 2008 ▸).
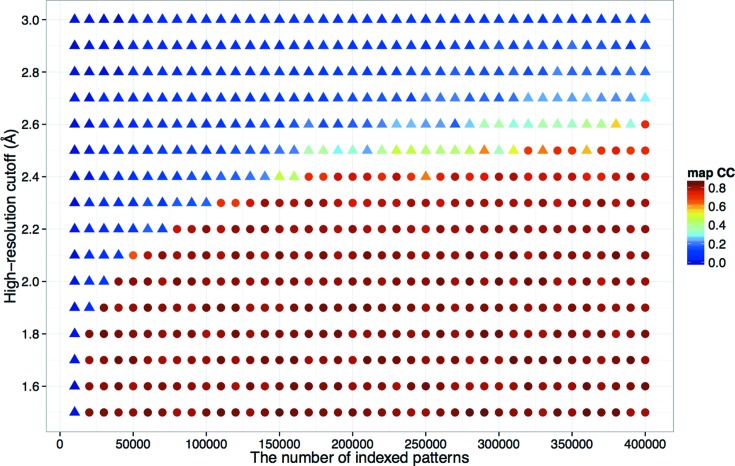
 0.65) and failure of phasing are represented as circular and triangular symbols, respectively. This figure was prepared using ggplot2 (Wickham, 2009 ▸) in R (R Development Core Team, 2008 ▸).
Similar articles
-
Serial femtosecond crystallography at the SACLA: breakthrough to dynamic structural biology.Biophys Rev. 2018 Apr;10(2):209-218. doi: 10.1007/s12551-017-0344-9. Epub 2017 Dec 1. Biophys Rev. 2018. PMID: 29196935 Free PMC article. Review.
-
Membrane protein structure determination by SAD, SIR, or SIRAS phasing in serial femtosecond crystallography using an iododetergent.Proc Natl Acad Sci U S A. 2016 Nov 15;113(46):13039-13044. doi: 10.1073/pnas.1602531113. Epub 2016 Oct 31. Proc Natl Acad Sci U S A. 2016. PMID: 27799539 Free PMC article.
-
An isomorphous replacement method for efficient de novo phasing for serial femtosecond crystallography.Sci Rep. 2015 Sep 11;5:14017. doi: 10.1038/srep14017. Sci Rep. 2015. PMID: 26360462 Free PMC article.
-
Protein structure determination by single-wavelength anomalous diffraction phasing of X-ray free-electron laser data.IUCrJ. 2016 Mar 9;3(Pt 3):180-91. doi: 10.1107/S2052252516002980. eCollection 2016 May 1. IUCrJ. 2016. PMID: 27158504 Free PMC article.
-
[What Kind of Measurements Can Be Made with an X-ray Free Electron Laser at SACLA?].Yakugaku Zasshi. 2022;142(5):479-485. doi: 10.1248/yakushi.21-00203-1. Yakugaku Zasshi. 2022. PMID: 35491153 Review. Japanese.
Cited by
-
Serial femtosecond crystallography at the SACLA: breakthrough to dynamic structural biology.Biophys Rev. 2018 Apr;10(2):209-218. doi: 10.1007/s12551-017-0344-9. Epub 2017 Dec 1. Biophys Rev. 2018. PMID: 29196935 Free PMC article. Review.
-
Synchrotron microcrystal native-SAD phasing at a low energy.IUCrJ. 2019 May 3;6(Pt 4):532-542. doi: 10.1107/S2052252519004536. eCollection 2019 Jul 1. IUCrJ. 2019. PMID: 31316798 Free PMC article.
-
Advances in long-wavelength native phasing at X-ray free-electron lasers.IUCrJ. 2020 Sep 9;7(Pt 6):965-975. doi: 10.1107/S2052252520011379. eCollection 2020 Nov 1. IUCrJ. 2020. PMID: 33209311 Free PMC article.
-
Crystal structure of CmABCB1 multi-drug exporter in lipidic mesophase revealed by LCP-SFX.IUCrJ. 2021 Dec 23;9(Pt 1):134-145. doi: 10.1107/S2052252521011611. eCollection 2022 Jan 1. IUCrJ. 2021. PMID: 35059217 Free PMC article.
-
Pink-beam serial femtosecond crystallography for accurate structure-factor determination at an X-ray free-electron laser.IUCrJ. 2021 Sep 23;8(Pt 6):905-920. doi: 10.1107/S2052252521008046. eCollection 2021 Nov 1. IUCrJ. 2021. PMID: 34804544 Free PMC article.
References
-
- Adams, P. D. et al. (2010). Acta Cryst. D66, 213–221. - PubMed
-
- Adams, P. D., Grosse-Kunstleve, R. W., Hung, L.-W., Ioerger, T. R., McCoy, A. J., Moriarty, N. W., Read, R. J., Sacchettini, J. C., Sauter, N. K. & Terwilliger, T. C. (2002). Acta Cryst. D58, 1948–1954. - PubMed
-
- Barends, T. R. M., Foucar, L., Botha, S., Doak, R. B., Shoeman, R. L., Nass, K., Koglin, J. E., Williams, G. J., Boutet, S., Messerschmidt, M. & Schlichting, I. (2014). Nature, 505, 244–247. - PubMed
LinkOut - more resources
Full Text Sources
Other Literature Sources
