

A marker of biological age explains individual variation in the strength of the adult stress response
- PMID: 28989794
- PMCID: PMC5627134
- DOI: 10.1098/rsos.171208
A marker of biological age explains individual variation in the strength of the adult stress response
Abstract
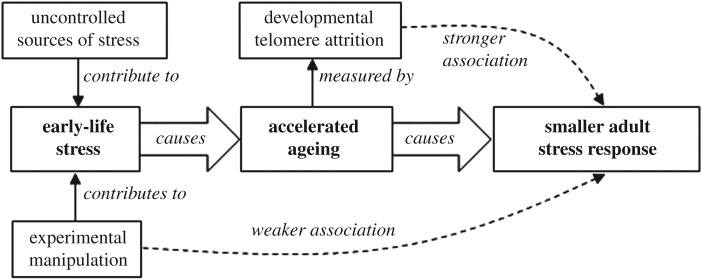
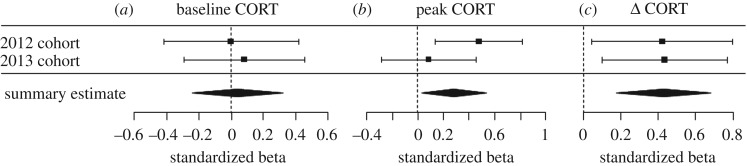
The acute stress response functions to prioritize behavioural and physiological processes that maximize survival in the face of immediate threat. There is variation between individuals in the strength of the adult stress response that is of interest in both evolutionary biology and medicine. Age is an established source of this variation-stress responsiveness diminishes with increasing age in a range of species-but unexplained variation remains. Since individuals of the same chronological age may differ markedly in their pace of biological ageing, we asked whether biological age-measured here via erythrocyte telomere length-predicts variation in stress responsiveness in adult animals of the same chronological age. We studied two cohorts of European starlings in which we had previously manipulated the rate of biological ageing by experimentally altering the competition experienced by chicks in the fortnight following hatching. We predicted that individuals with greater developmental telomere attrition, and hence greater biological age, would show an attenuated corticosterone (CORT) response to an acute stressor when tested as adults. In both cohorts, we found that birds with greater developmental telomere attrition had lower peak CORT levels and a more negative change in CORT levels between 15 and 30 min following stress exposure. Our results, therefore, provide strong evidence that a measure of biological age explains individual variation in stress responsiveness: birds that were biologically older were less stress responsive. Our results provide a novel explanation for the phenomenon of developmental programming of the stress response: observed changes in stress physiology as a result of exposure to early-life adversity may reflect changes in ageing.
Keywords: Sturnus vulgaris; biological age; corticosterone; early-life adversity; stress response; telomere.
Conflict of interest statement
We have no competing interests to declare.
Figures


Similar articles
-
Chronological age, biological age, and individual variation in the stress response in the European starling: a follow-up study.PeerJ. 2018 Oct 23;6:e5842. doi: 10.7717/peerj.5842. eCollection 2018. PeerJ. 2018. PMID: 30370189 Free PMC article.
-
Developmental history and stress responsiveness are related to response inhibition, but not judgement bias, in a cohort of European starlings (Sturnus vulgaris).Anim Cogn. 2019 Jan;22(1):99-111. doi: 10.1007/s10071-018-1226-7. Epub 2018 Nov 23. Anim Cogn. 2019. PMID: 30467655 Free PMC article.
-
Developmental telomere attrition predicts impulsive decision-making in adult starlings.Proc Biol Sci. 2015 Jan 22;282(1799):20142140. doi: 10.1098/rspb.2014.2140. Proc Biol Sci. 2015. PMID: 25473012 Free PMC article.
-
A marker of biological ageing predicts adult risk preference in European starlings, Sturnus vulgaris.Behav Ecol. 2018 May-Jun;29(3):589-597. doi: 10.1093/beheco/ary009. Epub 2018 Feb 24. Behav Ecol. 2018. PMID: 29769793 Free PMC article.
-
An experimental demonstration that early-life competitive disadvantage accelerates telomere loss.Proc Biol Sci. 2015 Jan 7;282(1798):20141610. doi: 10.1098/rspb.2014.1610. Proc Biol Sci. 2015. PMID: 25411450 Free PMC article.
Cited by
-
When do older birds better resist stress? A study of the corticosterone stress response in snow petrels.Biol Lett. 2020 Jan;16(1):20190733. doi: 10.1098/rsbl.2019.0733. Epub 2020 Jan 15. Biol Lett. 2020. PMID: 31937214 Free PMC article.
-
Chronological age, biological age, and individual variation in the stress response in the European starling: a follow-up study.PeerJ. 2018 Oct 23;6:e5842. doi: 10.7717/peerj.5842. eCollection 2018. PeerJ. 2018. PMID: 30370189 Free PMC article.
-
Why are there associations between telomere length and behaviour?Philos Trans R Soc Lond B Biol Sci. 2018 Mar 5;373(1741):20160438. doi: 10.1098/rstb.2016.0438. Philos Trans R Soc Lond B Biol Sci. 2018. PMID: 29335363 Free PMC article.
-
Developmental history and stress responsiveness are related to response inhibition, but not judgement bias, in a cohort of European starlings (Sturnus vulgaris).Anim Cogn. 2019 Jan;22(1):99-111. doi: 10.1007/s10071-018-1226-7. Epub 2018 Nov 23. Anim Cogn. 2019. PMID: 30467655 Free PMC article.
-
Temperature and telomeres: thermal treatment influences telomere dynamics through a complex interplay of cellular processes in a cold-climate skink.Oecologia. 2019 Dec;191(4):767-776. doi: 10.1007/s00442-019-04530-w. Epub 2019 Oct 16. Oecologia. 2019. PMID: 31620874
References
-
- Wingfield JC, Sapolsky RM. 2003. Reproduction and resistance to stress: when and how. J. Neuroendocrinol. 15, 711–724. (doi:10.1046/j.1365-2826.2003.01033.x) - DOI - PubMed
-
- Monaghan P, Spencer KA. 2014. Stress and life history. Curr. Biol. 24, R408–R412. (doi:10.1016/j.cub.2014.04.017) - DOI - PubMed
-
- Sapolsky RM, Romero LM, Munck AU. 2000. How do glucocorticoids influence stress responses? Integrating permissive, suppressive, stimulatory and preparative actions. Endocr. Rev. 21, 55–89. (doi:10.1210/er.21.1.55) - DOI - PubMed
-
- Lendvai Z, Giraudeau M, Bókony V, Angelier F, Chastel O. 2015. Within-individual plasticity explains age-related decrease in stress response in a short-lived bird. Biol. Lett. 11, 20150272 (doi:10.1098/rsbl.2015.0272) - DOI - PMC - PubMed
-
- Monaghan P. 2014. Organismal stress, telomeres and life histories. J. Exp. Biol. 217, 57–66. (doi:10.1242/jeb.090043) - DOI - PubMed
LinkOut - more resources
Full Text Sources
Other Literature Sources
