Review
. 2017 Aug 4;9(8):e1539.
doi: 10.7759/cureus.1539.

Magnetic Resonance Imaging of Primary Hepatic Malignancies in Patients With and Without Chronic Liver Disease: A Pictorial Review

Affiliations
Review

Magnetic Resonance Imaging of Primary Hepatic Malignancies in Patients With and Without Chronic Liver Disease: A Pictorial Review

Lauren F Alexander et al. Cureus. .

Abstract

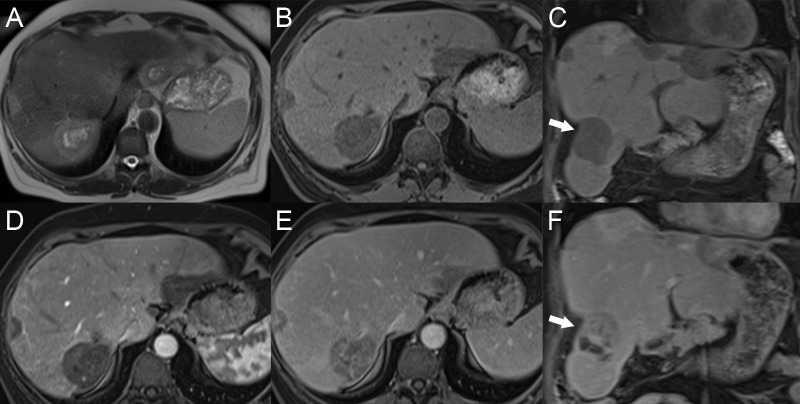
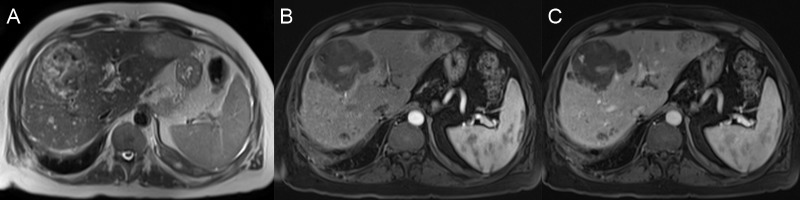
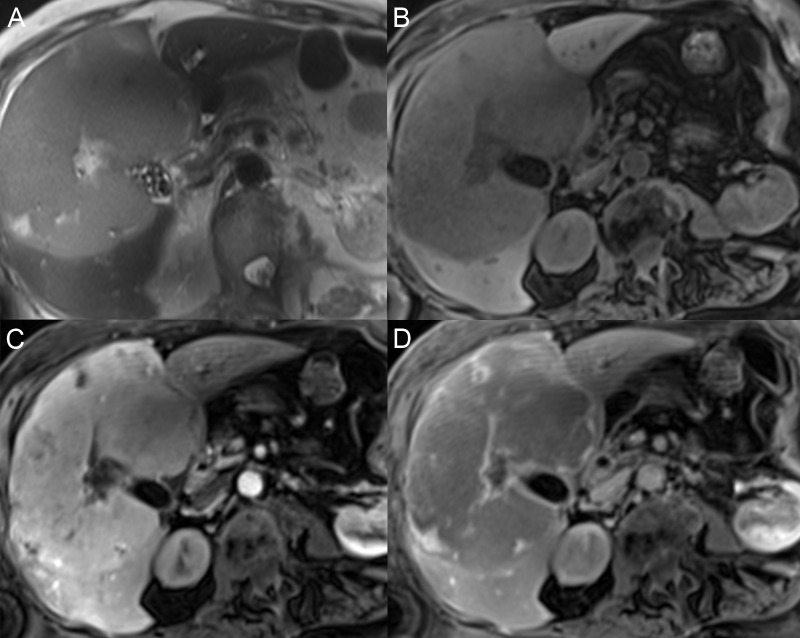
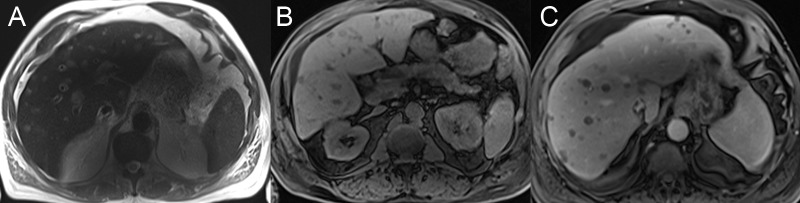
Primary hepatic malignancies are less common than metastatic diseases, but a recognition of these lesions is important for diagnosis and treatment planning. Magnetic resonance imaging (MRI) provides the most imaging information to diagnose lesions noninvasively and to narrow differential diagnoses. This paper reviews the imaging findings of chronic liver disease and primary hepatic malignancies, including hepatocellular carcinoma (HCC), intrahepatic cholangiocarcinoma (CCA), epithelioid hemangioendothelioma, hepatic angiosarcoma, and primary hepatic lymphoma. Clinical and MRI features are reviewed to improve the readers' recognition of these tumors, allowing for a narrower differential diagnosis when liver masses are encountered on abdominal imaging.

Keywords: bile duct neoplasms; carcinoma; cholangiocarcinoma; epithelioid; hemangioendothelioma; hemangiosarcoma; hepatocellular; liver neoplasms; lymphoma; magnetic resonance imaging.


Conflict of interest statement

The authors have declared that no competing interests exist.

Figures

Figure 1
Figure 1. Cirrhotic liver
The portal venous phase axial T1 fat saturation (FS) image shows hepatic surface nodularity (arrows) and a widening of the gallbladder fossa.
Figure 2
Figure 2. Hepatic fibrosis
A: The axial T2 image shows hyperintense bands in the hepatic dome. B: The axial T1 weighted image with fat saturation (FS) shows that the bands have a hypointense signal before contrast. C: Delayed post-contrast axial T1 FS shows a delayed enhancement of the fibrotic bands.
Figure 3
Figure 3. Imaging features of portal hypertension
A: Coronal T2 image shows hyperintense ascites around the nodular liver and around the enlarged spleen (S). B: Coronal T2 image shows an enlarged spleen (S) filling the left upper quadrant.
Figure 4
Figure 4. Regenerative nodules
A: The axial T1 fat saturation (FS) image shows multiple nodules throughout the liver that are hyperintense compared with the liver parenchyma. B: On the axial T2 image, the nodules have a T2 signal similar or slightly darker than the liver. C: On the axial T1 FS arterial phase, there is no nodule enhancement. D: Nodules are only seen on the axial T1 FS delayed phase due to the delayed enhancement of the surrounding fibrotic tissue bands.
Figure 5
Figure 5. Dysplastic nodule in a cirrhotic liver
A: The dysplastic nodule in the cirrhotic liver shows a hyperintesne signal on axial T2 (arrow). B: There is hypointense signal on axial T1 fat saturation (FS) (arrow). C: After contrast, the nodule has increased enhancement on arterial phase T1 FS (arrow). D: No washout in the nodule on delayed phase T1 FS (arrow).
Figure 6
Figure 6. Classic hepatocellular carcinoma
A: The lesion (arrows) is hypointense on axial T1 fat saturation. B: The lesion has a mildly hyperintense signal on axial T2. C: The lesion has avid enhancement on the T1 FS arterial phase. D: The lesions have washout on the T1 FS delayed phase with an enhancing pseudocapsule (arrowhead).
Figure 7
Figure 7. Hepatocellular carcinoma with microscopic fat
A: The mass in the right lobe of the liver (thin arrow) has avid enhancement on axial T1 fat saturation (FS) in the arterial phase. B: On the T1 FS delayed phase, the mass has washout and pseudocapsule (thin arrow). C, D: The axial dual gradient echo in phase (C) and opposed phase (D) show a signal change from bright on the in phase to dark on the opposed phase (thick arrows), confirming intralesional fat.
Figure 8
Figure 8. Infiltrative hepatocellular carcinoma with tumor thrombus
A. The infiltrative hepatocellular carcinoma in the right hepatic lobe has heterogeneous, patchy increased signal intensity on axial T2. B. The mass has heterogeneous dark signal intensity on axial T1 fat saturation (FS). C: The mass has heterogeneous enhancement on axial T1 FS arterial phase D: The axial T1 FS delayed phase shows washout in the mass. The main portal vein tumor thrombus (arrows) shows similar precontrast signal changes, arterial enhancement, and washout to the tumor.
Figure 9
Figure 9. Multifocal hepatocellular carcinoma
A: Numerous hyperintense lesions throughout the liver on axial T2. B: The lesions are hypointense on axial T1 fat saturation (FS). C, D: The lesions have avid arteial enhancement on axial T1 FS and washout on axial T1 FS delayed phase.
Figure 10
Figure 10. Fibrolamellar hepatocellular carcinoma
A: The left hepatic lobe mass is mildly hyperintense on axial T2. B: The mass is hypointense on axial T1 fat saturation (FS). C, D: After contrast, the mass has heterogeneous enhancement on the axial T1 FS arterial (C) and delayed (D) phases. The mass has a T2 hypointense, hypoenhancing scar (arrows).
Figure 11
Figure 11. Intrahepatic cholangiocarcinoma
A, B: The large mass in the right hepatic lobe has bright signal intensity on axial T2 and a dark signal on T1 fat saturation (FS) (B). C: The mass has a thick rind of peripheral avid enhancement on the axial T1 FS arterial phase. D: The mass enhancement is irregular and persistent on the axial T1 FS delayed phase.
Figure 12
Figure 12. Intrahepatic cholangiocarcinoma
A, B: The mass in the right hepatic lobe (arrows) has a dark signal intensity on axial T1 fat saturation (FS) (A) and a bright signal intensity on axial T2 FS (B). C: After contrast, the mass has avid enhancement on the axial T1 FS arterial phase. D: The mass enhancement persists on the axial T1 FS delayed phase (D).
Figure 13
Figure 13. Combined hepatocellular and cholangiocarcinoma
A: The large mass in the right hepatic lobe has a heterogneous bright signal on axial T2. B: The mass has a hypointense signal on axial T1 fat saturation (FS). C: After contrast, there is heterogeneous enhancement on the axial T1 FS arterial phase. D: The mass has progressive enhancement on axial T1 FS delayed images. Biopsy showed combined hepatocellular carcinoma and cholangiocarcinoma.
Figure 14
Figure 14. Epithelioid hemangioendothelioma
A, B, C: Epithelioid hemangioendothelioma presents as multifocal masses with a bright signal on axial T2 (A) and dark on axial T1 fat saturation (FS) (B) and coronal T1 FS (C). D: After contrast, the lesions are hypoenhancing on the axial T1 FS arterial phase. E, F: The masses have gradual delayed enhancement on the axial (E) and coronal (F) T1 FS delayed phase. The segment 6 mass has overlying capsular retraction (arrows).
Figure 15
Figure 15. Hepatic angiosarcoma
A: Large tumors in the right and left lobes have heterogeneous T2 signal with bright areas, but not as bright as hemangioma. B, C: After contrast, the masses have bizzare-appearing peripheral arterial enhancement on the axial T1 FS arterial phase (B) with gradual, heterogeneous enhancement on the axial T1 FS delayed phase (C).
Figure 16
Figure 16. Solitary hepatic lymphoma
A: The large mass filling the central liver has a mildly hyperintense signal on axial T2. B: The mass has a hypointense signal on axial T1 fat saturation (FS). C, D: After contrast, the mass has avid early enhancement on the axial T1 FS arterial phase (C) with washout on the axial T1 FS delayed phase (D). Biopsy confirmed the diagnosis of lymphoma.
Figure 17
Figure 17. Multifocal hepatic lymphoma
A: Multiple lesions throughout the liver with a hyperintense signal on axial T2. B: The masses have a hypointense signal on axial T1 fat saturation. C: After contrast, the masses have mild central targetoid enhancement on the axial T1 FS venous phase. Biopsy showed a B cell lymphoma.

Similar articles

Cited by

References

    1. Global cancer statistics, 2012. Torre LA, Bray F, Siegel RL, et al. CA Cancer J Clin. 2015;65:87–108. - PubMed
    1. Annual report to the nation on the status of cancer, 1975-2012, featuring the increasing incidence of liver cancer. Ryerson AB, Eheman CR, Altekruse SF, et al. Cancer. 2016;122:1312–1337. - PMC - PubMed
    1. CT and MR imaging diagnosis and staging of hepatocellular carcinoma: part II. Extracellular agents, hepatobiliary agents, and ancillary imaging features. Choi JY, Lee JM, Sirlin CB. Radiology. 2014;273:30–50. - PMC - PubMed
    1. Hepatocellular carcinoma: illustrated guide to systematic radiologic diagnosis and staging according to guidelines of the American Association for the study of liver diseases. McEvoy SH, McCarthy CJ, Lavelle LP, et al. RSNA. 2013;33:1653–1668. - PubMed
    1. ACR Manual on Contrast Media Version 10.2. [Jun;2017 ];ACR ACR. https://www.acr.org/Quality-Safety/Resources/Contrast-Manual Media. 2017

LinkOut - more resources