Hematopoietic Stem Cell-derived Adipocytes Promote Tumor Growth and Cancer Cell Migration
- PMID: 28989976
- PMCID: PMC5627654
- DOI: 10.16966/2381-3318.130
Hematopoietic Stem Cell-derived Adipocytes Promote Tumor Growth and Cancer Cell Migration
Abstract
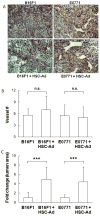
Adipocytes, apart from their critical role as the energy storage depots, contribute to the composition of the tumor microenvironment. Our previous studies based on a single hematopoietic stem cell (HSC) transplantation model, have revealed a novel source of adipocytes from HSCs via monocyte/macrophage progenitors. Herein, we extend these studies to examine the role of HSC-derived adipocytes (HSC-Ad) in tumor progression. When cultured under adipogenic conditions, bone marrow-derived monocytic progenitors differentiated into adipocytes that accumulated oil droplets containing triglyceride. The adipokine array and ELISAs confirmed secretion of multiple adipokines by HSC-Ad. These adipocytes underwent further development in vivo when injected subcutaneously into C57Bl/6 mice. When co-injected with melanoma B16F1 cells or breast cancer E0771 cells into syngeneic C57Bl/6 mice, HSC-Ad not only accelerated both melanoma and breast tumor growth, but also enhanced vascularization in both tumors. Conditioned media from HSC-Ad supported B16F1 and E0771 cell proliferation and enhanced cell migration in vitro. Among the HSC-Ad secreted adipokines, insulin-like growth factor 1 (IGF-1) played an important role in E0771 cell proliferation. Hepatocyte growth factor (HGF) was indispensable for B16F1 cell migration, whereas HGF and platelet-derived growth factor BB (PDGF-BB) collectively contributed to E0771 cell migration. Expression levels of receptors for IGF-1, HGF, and PDGF-BB correlated with their differential roles in B16F1 and E0771 cell proliferation and migration. Our data suggest that HSC-Ad differentially regulate tumor behavior through distinct mechanisms.
Keywords: Adipocyte; Breast cancer; Hematopoietic stem cell; Melanoma; Tumor microenvironment.
Conflict of interest statement
Conflict of Interest The authors declare that they have no conflicts of interest.
Figures


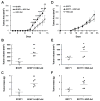
 ), HSC-Ad alone (
 ), or both (
 ) were injected orthotopically into C57Bl/6 mice. Tumor area was measured on a regular basis (A, D). At the end point when mice were euthanized, tumor volume (B, E) and mass (C, F) were measured. (A-C) B16F1 tumor growth. (D-F) E0771 tumor growth. *p≤0.05, **p<0.01, ***p<0.001.

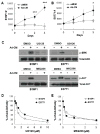
 )or Ad-CM (
 ) for 3 days and cell numbers (#) were quantified daily and averaged from multiple experiments. *p<0.05, ***p<0.001. (C) Tumor cells were pretreated with DMSO or the indicated inhibitors (UO126, 10 μM; MK2206, 1 μM) overnight, followed by the addition of Ad-CM at 37°C for 1h. Cell lysates were subject to SDS-PAGE and blotted with the indicated antibodies. (D) B16F1 (
 ) and E0771 (
 ) cells were cultured for 3 days in either Ad-CM or Ad-CM supplemented with different concentrations of UO126 or MK2206. Cell numbers were quantified on day 3. Data was averaged from two independent experiments and presented as percentage of Ad-CM.
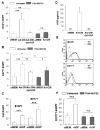
 ) and E0771 (
 ) cells were cultured for 3 days in either Ad-CM or Ad-CM supplemented with different concentrations of IGF-1R inhibitor OSI-906. Cell numbers were quantified on day 3 and averaged from three independent experiments. Data was presented as percentage of Ad-CM. *p<0.05. n.s., not significant.

References
-
- Carroll PA, Healy L, Lysaght J, Griffin M, Dunne B. Mammary adipose tissue and cancer cell growth: The role of adipose tissue in the tumor microenvironment. Journal of Clinical Oncology. 2009;27:e22009.
-
- Dirat B, Bochet L, Dabek M, Daviaud D, Dauvillier S, et al. Cancer-associated adipocytes exhibit an activated phenotype and contribute to breast cancer invasion. Cancer Res. 2011;71:2455–2465. - PubMed
-
- Tan J, Buache E, Chenard MP, Dali-Youcef N, Rio MC. Adipocyte is a non-trivial, dynamic partner of breast cancer cells. Int J Dev Biol. 2011;55:851–859. - PubMed
Grants and funding
LinkOut - more resources
Full Text Sources
Other Literature Sources
Miscellaneous
