Integrated microarray analysis provided novel insights to the pathogenesis of glaucoma
- PMID: 28990066
- PMCID: PMC5779953
- DOI: 10.3892/mmr.2017.7711
Integrated microarray analysis provided novel insights to the pathogenesis of glaucoma
Abstract
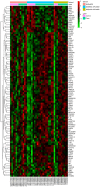
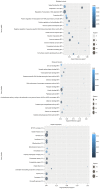
Glaucoma is characterized as a visual field defect, which is the second most common cause of blindness. The present study performed an integrated analysis of microarray studies of glaucoma derived from Gene Expression Omnibus (GEO). Following the identification of the differentially expressed genes (DEGs) in glaucoma compared with normal control (NC) tissues, the functional annotation, glaucoma‑specific protein‑protein interaction (PPI) network and transcriptional regulatory network constructions were performed. The acute intraocular pressure (IOP) elevation rat models were established and reverse transcription‑quantitative polymerase chain reaction (RT‑qPCR) was performed for DEGs expression confirmation. Three datasets were downloaded from GEO. A total of 97 DEGs, 82 upregulated and 15 downregulated were identified in glaucoma compared with NC groups with false discovery rate <0.05. Response to virus and immune response were two significantly enriched GO terms in glaucoma. Valine, leucine and isoleucine degradation was a significantly enriched pathway of DEGs in glaucoma. According to the PPI network, HDAC1, HBN, UBR4 and PDK1 were hub proteins in glaucoma. FOXD3, HNF‑4 and AP‑1 were the three transcription factors (TFs) derived from top 10 TFs which covered the majority of downstream DEGs in glaucoma. Based on the RT‑qPCR results, the expression levels of 3 DEGs, raftlin, lipid raft linker 1 (RFTN1), PBX homeobox 1 (PBX1), HDAC1 were significantly upregulated and the expression of GEM was significantly downregulated in acute IOP elevation rat model at the first and fifth day. These four DEGs had the same expression pattern with our integrated analysis. Therefore, the current study concluded that 6 DEGs, including HEPH, SELENBP1, RFTN1, ID1, HDAC‑1 and PBX1 and three TFs, including FOXD3, HNF‑4 and AP‑1 may be involved with the pathogenesis of glaucoma. The findings of the current study may improve diagnosis and drug design for glaucoma.
Figures


Similar articles
-
Bioinformatics analyses of significant genes, related pathways and candidate prognostic biomarkers in glioblastoma.Mol Med Rep. 2018 Nov;18(5):4185-4196. doi: 10.3892/mmr.2018.9411. Epub 2018 Aug 21. Mol Med Rep. 2018. PMID: 30132538 Free PMC article.
-
Bioinformatics analysis of fibroblasts exposed to TGF‑β at the early proliferation phase of wound repair.Mol Med Rep. 2017 Dec;16(6):8146-8154. doi: 10.3892/mmr.2017.7619. Epub 2017 Sep 26. Mol Med Rep. 2017. PMID: 28983581 Free PMC article.
-
Identification of pathogenic genes and transcription factors in glaucoma.Mol Med Rep. 2019 Jul;20(1):216-224. doi: 10.3892/mmr.2019.10236. Epub 2019 May 14. Mol Med Rep. 2019. PMID: 31115504
-
Key signaling pathways, genes and transcription factors associated with hepatocellular carcinoma.Mol Med Rep. 2018 Jun;17(6):8153-8160. doi: 10.3892/mmr.2018.8871. Epub 2018 Apr 12. Mol Med Rep. 2018. PMID: 29658607 Free PMC article.
-
A comprehensive map of disease networks and molecular drug discoveries for glaucoma.Sci Rep. 2020 Jun 16;10(1):9719. doi: 10.1038/s41598-020-66350-w. Sci Rep. 2020. PMID: 32546683 Free PMC article.
Cited by
-
Selenium-Binding Protein 1 in Human Health and Disease.Int J Mol Sci. 2018 Nov 2;19(11):3437. doi: 10.3390/ijms19113437. Int J Mol Sci. 2018. PMID: 30400135 Free PMC article. Review.
-
Cholinergic nervous system and glaucoma: From basic science to clinical applications.Prog Retin Eye Res. 2019 Sep;72:100767. doi: 10.1016/j.preteyeres.2019.06.003. Epub 2019 Jun 23. Prog Retin Eye Res. 2019. PMID: 31242454 Free PMC article. Review.
-
Diagnostic value of abnormal chromosome 3p genes in small-cell lung cancer.Oncol Lett. 2022 May 16;24(1):209. doi: 10.3892/ol.2022.13330. eCollection 2022 Jul. Oncol Lett. 2022. PMID: 35720498 Free PMC article.
-
PBX1 attenuates H2O2-induced oxidant stress in human trabecular meshwork cells via promoting NANOG-mediated PI3K/AKT signaling pathway.Cell Stress Chaperones. 2022 Nov;27(6):673-684. doi: 10.1007/s12192-022-01304-x. Epub 2022 Oct 18. Cell Stress Chaperones. 2022. PMID: 36253638 Free PMC article.
-
Screening of primary open-angle glaucoma diagnostic markers based on immune-related genes and immune infiltration.BMC Genom Data. 2022 Aug 24;23(1):67. doi: 10.1186/s12863-022-01072-8. BMC Genom Data. 2022. PMID: 36002796 Free PMC article.
References
-
- Moreno MC, Sande P, Marcos HA, de Zavalía N, Sarmiento MI Keller, Rosenstein RE. Effect of glaucoma on the retinal glutamate/glutamine cycle activity. FASEB J. 2005;19:1161–1162. - PubMed
MeSH terms
Substances
LinkOut - more resources
Full Text Sources
Other Literature Sources
Medical
Research Materials
Miscellaneous

