

Impact Evaluation of Malaria Control Interventions on Morbidity and All-Cause Child Mortality in Rwanda, 2000-2010
- PMID: 28990918
- PMCID: PMC5619936
- DOI: 10.4269/ajtmh.17-0281
Impact Evaluation of Malaria Control Interventions on Morbidity and All-Cause Child Mortality in Rwanda, 2000-2010
Abstract
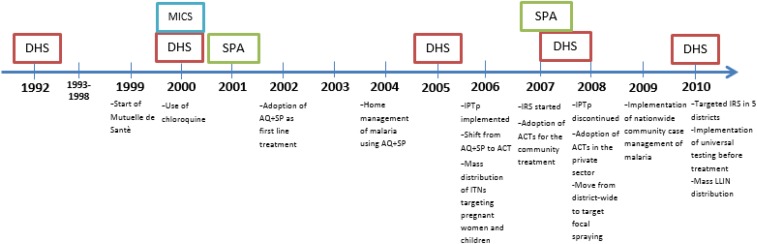
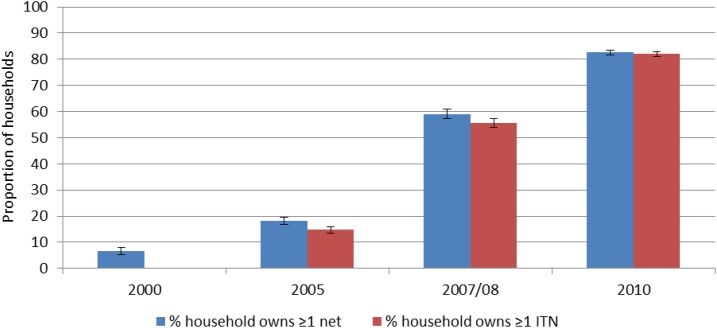
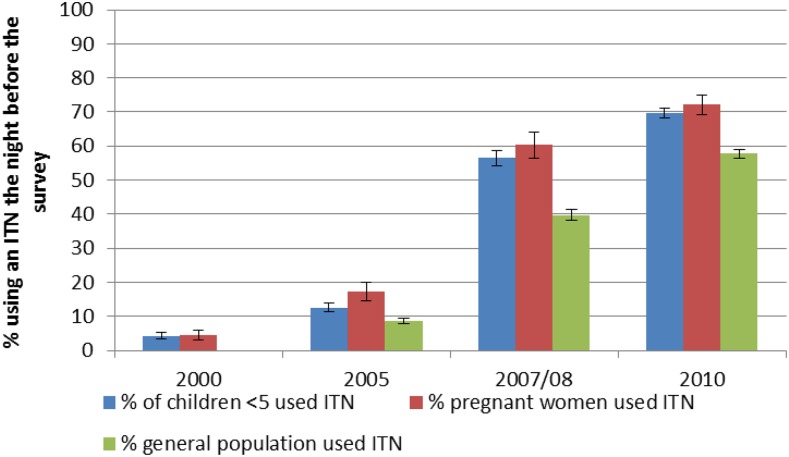
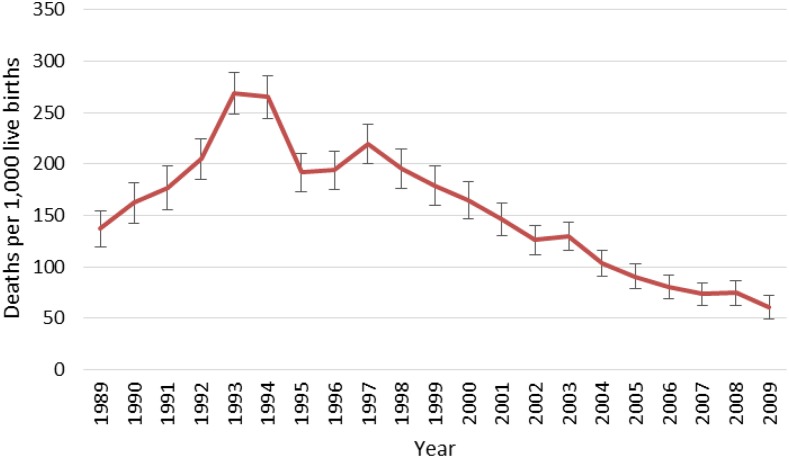
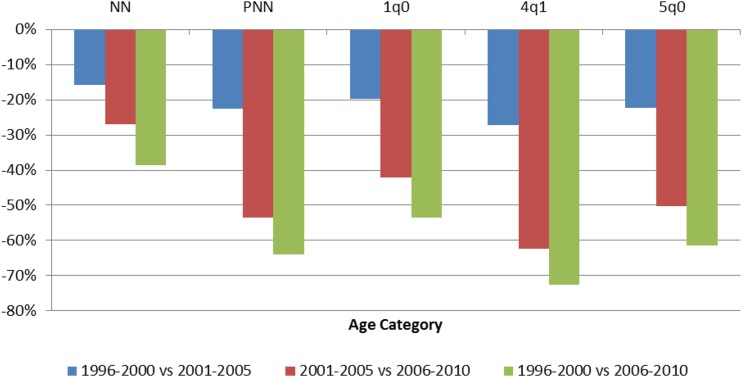
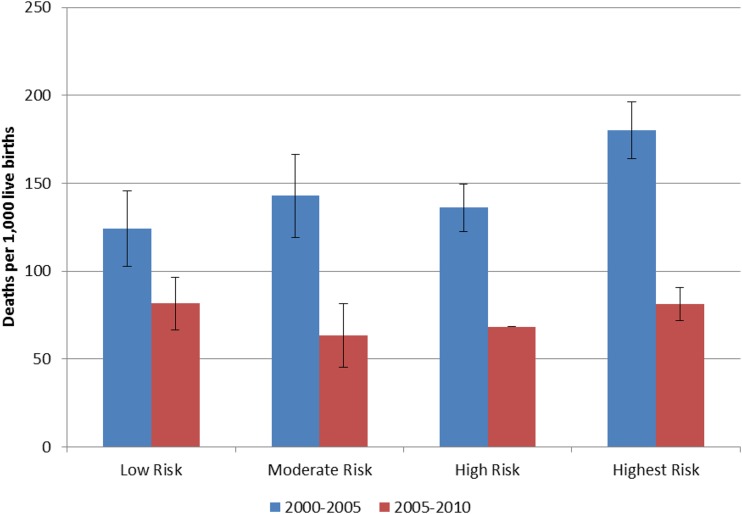
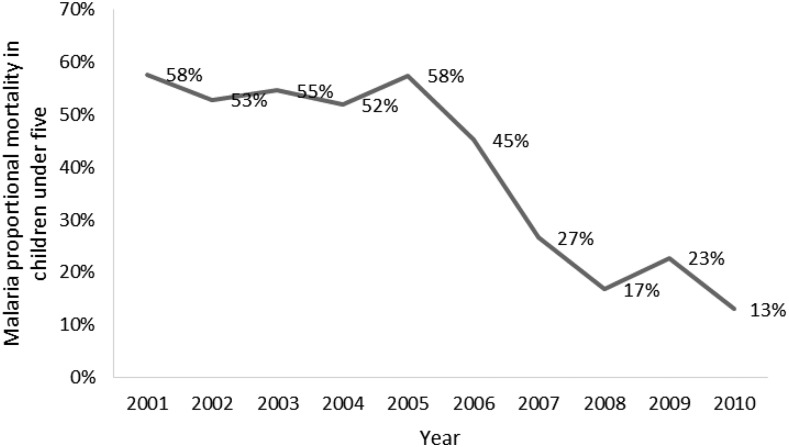
The impressive decline in child mortality that occurred in Rwanda from 1996-2000 to 2006-2010 coincided with a period of rapid increase of malaria control interventions such as indoor residual spraying (IRS); insecticide-treated net (ITN) distribution and use, and improved malaria case management. The impact of these interventions was examined through ecological correlation analysis, and robust decomposition analysis of contextual factors on all-cause child mortality. Child mortality fell 61% during the evaluation period and prevalence of severe anemia in children 6-23 months declined 71% between 2005 and 2010. These changes in malaria morbidity and mortality occurred concurrently with a substantial increase in vector control activities. ITN use increased among children under five, from 4% to 70%. The IRS program began in 2007 and covered 1.3 million people in the highest burden districts by 2010. At the same time, diagnosis and treatment with an effective antimalarial expanded nationally, and included making services available to children under the age of 5 at the community level. The percentage of children under 5 who sought care for a fever increased from 26% in 2000 to 48% in 2010. Multivariable models of the change in child mortality between 2000 and 2010 using nationally representative data reveal the importance of increasing ITN ownership in explaining the observed mortality declines. Taken as a whole, the evidence supports the conclusion that malaria control interventions contributed to the observed decline in child mortality in Rwanda from 2000 to 2010, even in a context of improving socioeconomic, maternal, and child health conditions.
Figures
References
-
- National Institute of Statistics of Rwanda (NISR), 2012. Population and Housing Census Available at: http://www.statistics.gov.rw/publication/rphc4-atlas. Accessed December 2016.
-
- National Institute of Statistics of Rwanda (NISR), 2011. Statistical Yearbook Available at: http://www.statistics.gov.rw/publication/statistical-yearbook-2011. Accessed December 2016.
-
- Lyon B, Barnston AG, 2005. ENSO and the spatial extent of interannual precipitation extremes in tropical land areas. J Clim 18: 5095–5109.
-
- President’s Malaria Initiative, 2015. Rwanda Malaria Operational Plan (MOP) Available at: www.pmi.gov. Accessed December 2016.
-
- President’s Malaria Initiative, 2009. Rwanda Malaria Operational Plan (MOP) Available at: www.pmi.gov. Accessed December 2016.
MeSH terms
Substances
LinkOut - more resources
Full Text Sources
Other Literature Sources
Medical
