. 2017 Sep;97(3_Suppl):76-88.
doi: 10.4269/ajtmh.17-0203.

Malaria Control Interventions Contributed to Declines in Malaria Parasitemia, Severe Anemia, and All-Cause Mortality in Children Less Than 5 Years of Age in Malawi, 2000-2010

Affiliations

Malaria Control Interventions Contributed to Declines in Malaria Parasitemia, Severe Anemia, and All-Cause Mortality in Children Less Than 5 Years of Age in Malawi, 2000-2010

Christine L Hershey et al. Am J Trop Med Hyg. 2017 Sep.

Abstract

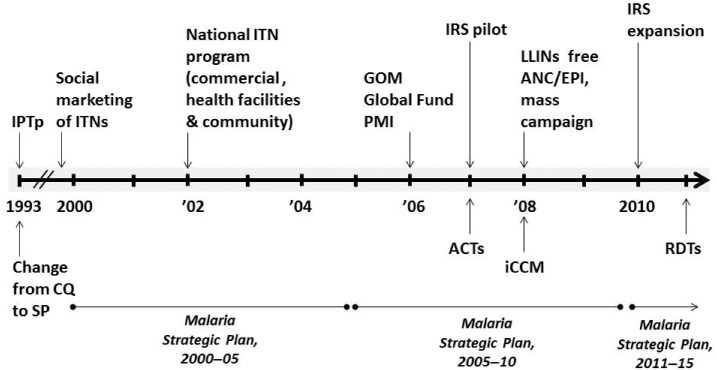
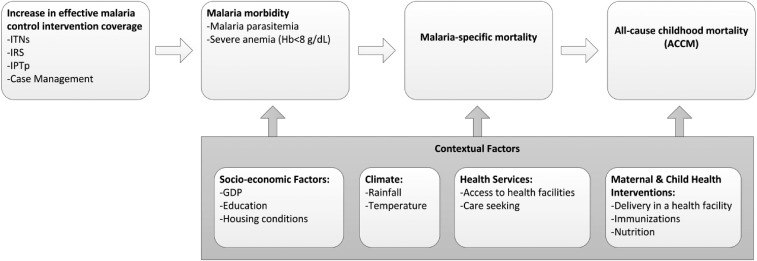
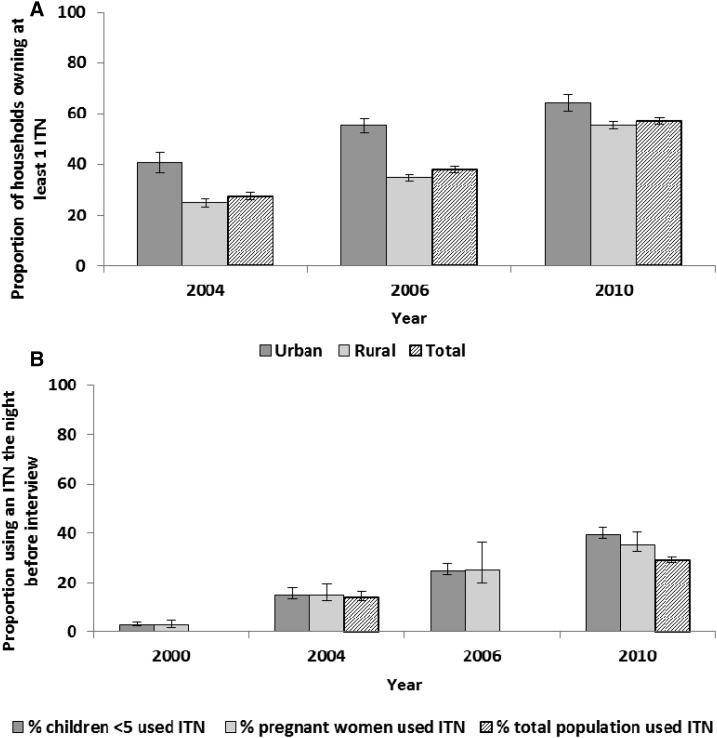
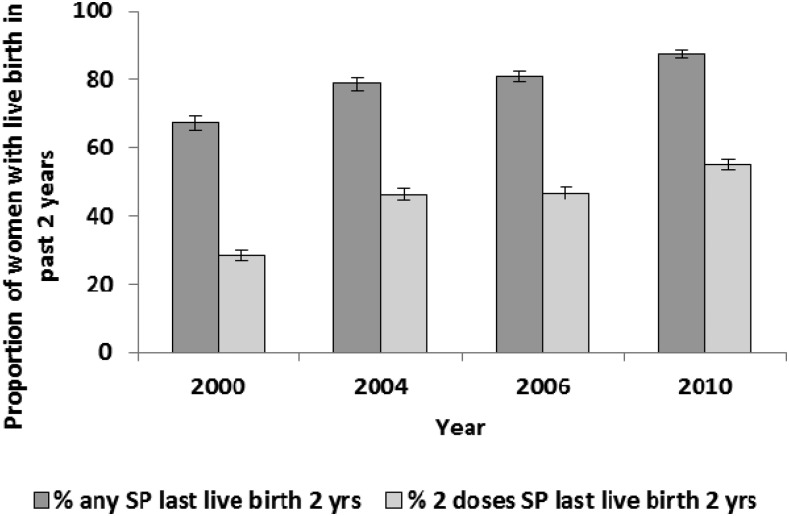
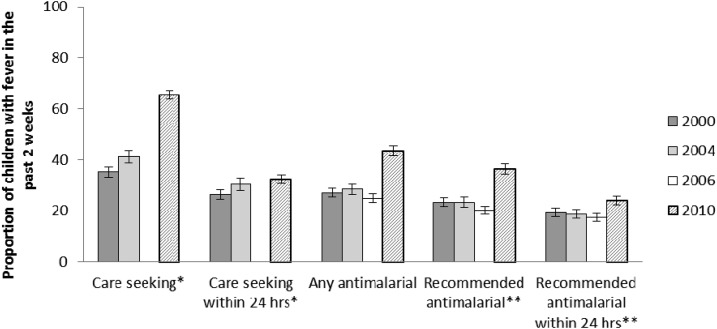
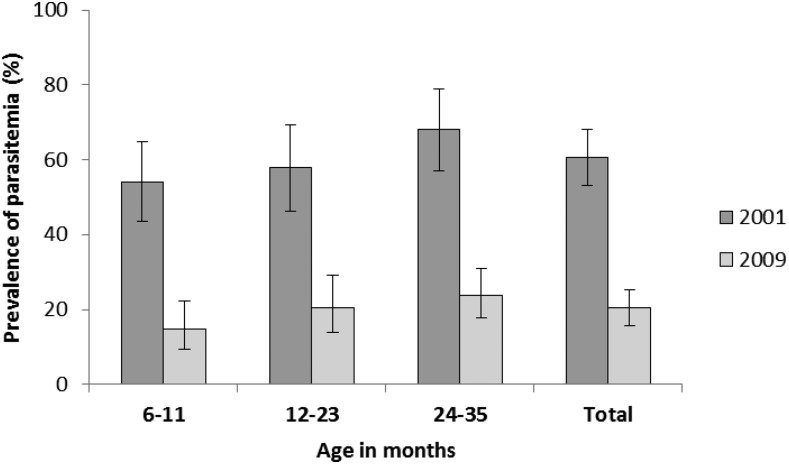
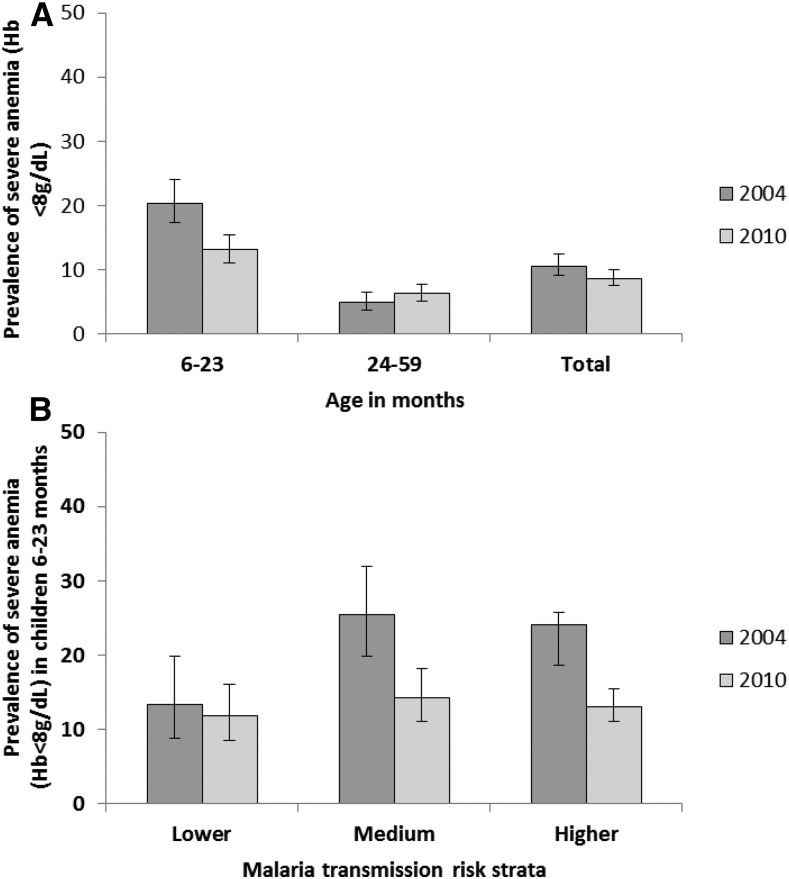
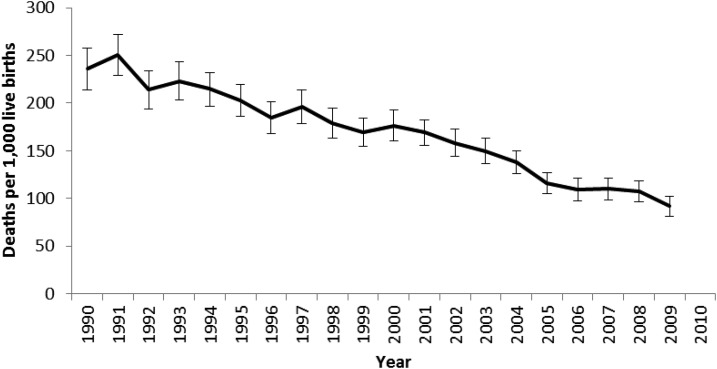
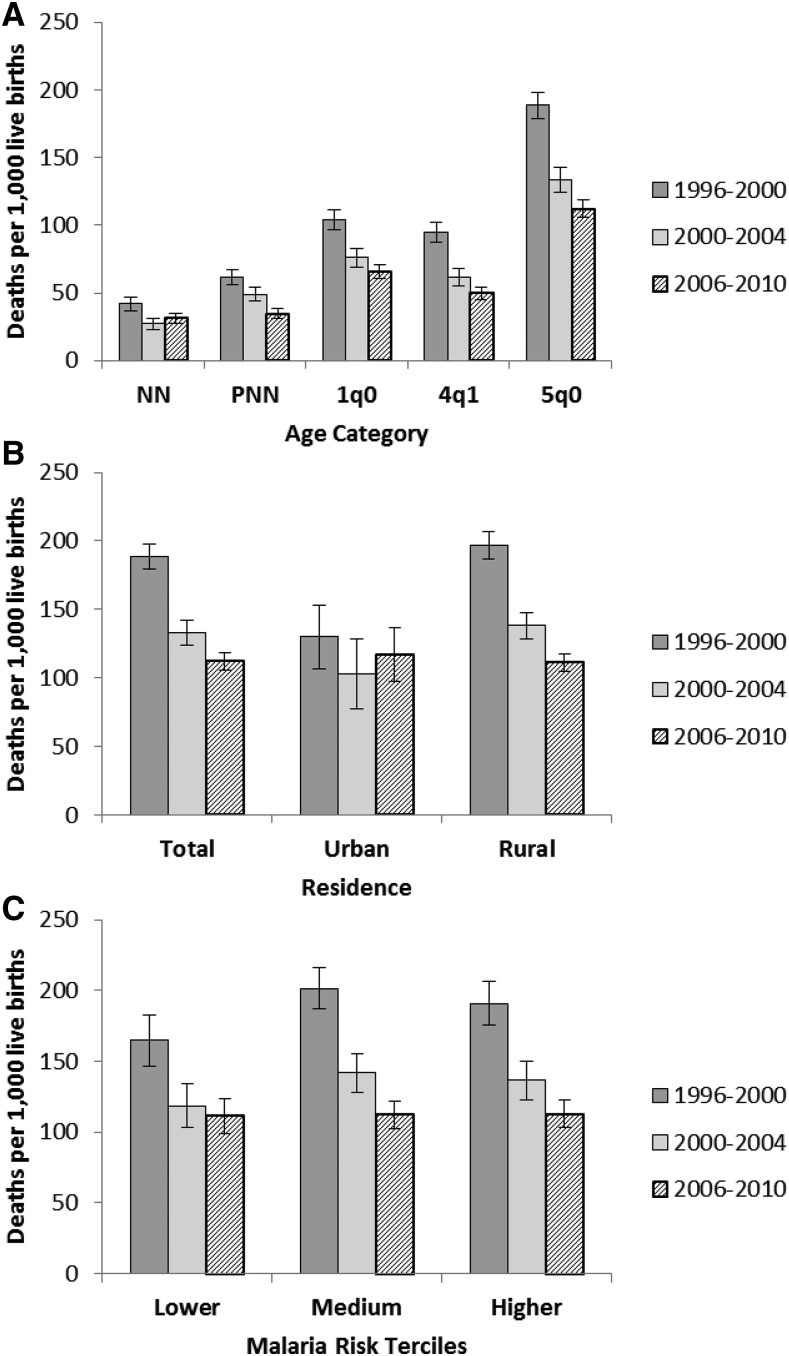
Malaria control intervention coverage increased nationwide in Malawi during 2000-2010. Trends in intervention coverage were assessed against trends in malaria parasite prevalence, severe anemia (hemoglobin < 8 g/dL), and all-cause mortality in children under 5 years of age (ACCM) using nationally representative household surveys. Associations between insecticide-treated net (ITN) ownership, malaria morbidity, and ACCM were also assessed. Household ITN ownership increased from 27.4% (95% confidence interval [CI] = 25.9-29.0) in 2004 to 56.8% (95% CI = 55.6-58.1) in 2010. Similarly intermittent preventive treatment during pregnancy coverage increased from 28.2% (95% CI = 26.7-29.8) in 2000 to 55.0% (95% CI = 53.4-56.6) in 2010. Malaria parasite prevalence decreased significantly from 60.5% (95% CI = 53.0-68.0) in 2001 to 20.4% (95% CI = 15.7-25.1) in 2009 in children aged 6-35 months. Severe anemia prevalence decreased from 20.4% (95% CI: 17.3-24.0) in 2004 to 13.1% (95% CI = 11.0-15.4) in 2010 in children aged 6-23 months. ACCM decreased 41%, from 188.6 deaths per 1,000 live births (95% CI = 179.1-198.0) during 1996-2000, to 112.1 deaths per 1,000 live births (95% CI = 105.8-118.5) during 2006-2010. When controlling for other covariates in random effects logistic regression models, household ITN ownership was protective against malaria parasitemia in children (odds ratio [OR] = 0.81, 95% CI = 0.72-0.92) and severe anemia (OR = 0.82, 95% CI = 0.72-0.94). After considering the magnitude of changes in malaria intervention coverage and nonmalaria factors, and given the contribution of malaria to all-cause mortality in malaria-endemic countries, the substantial increase in malaria control interventions likely improved child survival in Malawi during 2000-2010.


Figures

Figure 1.
Figure 1.
Timeline of milestones in Malawi’s malaria control program, 1993–2011. The periods covered by the three Malaria Strategic Plans are shown, along with changes in the first-line antimalarial drugs (CQ, SP and, ACTs) and implementation of malaria control interventions. iCCM was introduced in 2008 and expanded thereafter. Rapid diagnostic tests (RDTs) were introduced after the 2000–2010 evaluation period. CQ = chloroquine; SP = sulfadoxine-pyrimethamine; ACTs = artemisinin-based combination therapies; IPTp = intermittent preventive treatment in pregnancy; IRS = indoor residual spraying; ITNs = insecticide treated nets; ANC = antenatal care; EPI = expanded program on immunizations; iCCM = integrated community case management; GOM = Government of Malawi; PMI = President’s Malaria Initiative.
Figure 2.
Figure 2.
Conceptual framework. The plausibility analysis framework is based on an increase in coverage of effective malaria control interventions leading to lower malaria morbidity and lower malaria mortality, which in highly endemic settings would result in lowering ACCM. The analysis accounts for other contextual factors that may affect malaria morbidity, malaria mortality, or ACCM. See Yé and others for a more detailed explanation of the conceptual framework. Examples of contextual factors are shown, but this is not an exhaustive list. Hb = hemoglobin; ACCM = all-cause childhood mortality.
Figure 3.
Figure 3.
Household ownership of insecticide treated nets (ITNs) and use of ITNs, Malawi, 2000–2010. (A) Household ownership of at least one ITN is shown for all households and disaggregated by urban/rural residence. Questions on brand of net and on treatment of nets with insecticide were not included in the 2000 Demographic and Health Survey (DHS); thus, ITN ownership cannot be estimated for this survey. (B) Use of an ITN is estimated for children less than 5 years of age, pregnant women, and the entire population in the household the night before the survey. Questions on net use by the total population were not included in the 2000 DHS or the 2006 Multiple Indicator Cluster Survey (MICS). The 2006 MICS is only representative for pregnant women who have had a birth in the past 2 years.
Figure 4.
Figure 4.
Proportion of women receiving sulfadoxine-pyrimethamine (SP) for prevention of malaria in pregnancy, Malawi, 2000–2010. Estimates are shown for women (15–49 years) with a live birth in the last 2 years who took one or two doses of SP for malaria prevention during their last pregnancy, regardless of the source of the medication.
Figure 5.
Figure 5.
Percentage of children less than 5 years of age with fever who sought care and were treated with antimalarial drugs, Malawi, 2000–2010. Caregivers of children under five with a fever in the 2 weeks before the Demographic and Health Survey and Multiple Indicator Cluster Survey (MICS) interview were asked about the care seeking and treatment their child received for the fever. *Care seeking refers to seeking advice or treatment of fever from a public or private health professional or from a pharmacy, including health surveillance assistants/community health workers, but excluding shops and traditional healers. Care seeking was not included in the 2006 MICS. **The recommended first-line antimalarial was sulfadoxine-pyrimethamine in 2000, 2004, and 2006 and artemisinin-based combination therapy (artemether-lumefantrine) in 2010.
Figure 6.
Figure 6.
Malaria parasite prevalence in children 6–35 months by age, Malawi, 2001 and 2009. Parasitemia was measured via microscopy in the National Micronutrient Surveys in 2001 and 2009. The 2001 survey was conducted September to October and the 2009 survey was conducted July to August, both in the low malaria transmission season. Parasitemia estimates are shown for all children aged 6–35 months (total) and also disaggregated into smaller age categories: 6–11, 12–23, and 24–35 months.
Figure 7.
Figure 7.
Trends in severe anemia (hemoglobin [Hb] < 8 g/dL) prevalence by age and malaria risk areas, Malawi, 2004 and 2010. (A) Prevalence of severe anemia (Hb < 8 g/dL) was measured in children 6–59 months of age (total). This was also disaggregated into children 6–23 months of age and 24–59 months of age. (B) Severe anemia prevalence in children 6–23 months of age was further disaggregated by malaria transmission risk zones. (See Materials and Methods for a description of the risk stratification). Data are from the 2004 and 2010 Demographic and Health Surveys.
Figure 8.
Figure 8.
Disaggregated annual all-cause under-five mortality, Malawi, 1990–2010. Annual estimates were calculated for all-cause under-five mortality from 1990 to 2010 using the 2000 and 2010 Demographic and Health Surveys. For comparisons with the United Nations Interagency Group for Child Mortality Estimation and Institute for Health Metrics and Evaluation annual estimates of under-five mortality see Supplemental Figure 3.
Figure 9.
Figure 9.
Trends in age-specific childhood mortality and all-cause under five mortality (ACCM) stratified by residence and malaria transmission risk, Malawi, 1996–2000, 2000–2004, and 2006–2010. ACCM (5q0) was estimated from the 2000, 2004, and 2010 Demographic and Health Surveys using period estimates for the 5 years before the survey. This was further disaggregated into (A) smaller age groups and stratified by (B) urban/rural residence and (C) malaria transmission risk areas. NN = neonatal mortality (first month) per 1,000 live births; PNN = post-neonatal mortality (age 1–11 months) per 1,000 live births; 1q0 = infant mortality (first year) per 1,000 live births; 4q1 = child mortality between exact age 1 and exact age 5 per 1,000 children surviving to 12 months of age; 5q0 = under-five mortality per 1,000 live births.

References

    1. Kazembe LN, Kleinschmidt I, Sharp BL, 2006. Patterns of malaria-related hospital admissions and mortality among Malawian children: an example of spatial modelling of hospital register data. Malar J 5: 93. - PMC - PubMed
    1. Mathanga DP, Walker ED, Wilson ML, Ali D, Taylor TE, Laufer MK, 2012. Malaria control in Malawi: current status and directions for the future. Acta Trop 121: 212–217. - PMC - PubMed
    1. National Malaria Control Programme, 2001. Malaria Strategic Plan 2001–2005: Scaling up Malaria Control Interventions Malawi. Lilongwe, Malawi: Government of Malawi Ministry of Health.
    1. Malawi Malaria Impact Evaluation Group, 2016. Evaluation of the Impact of Malaria Control Interventions on All-Cause Mortality in Children Under-Five in Malawi. Washington, DC: President’s Malaria Intiative.
    1. World Health Organization (WHO), 2011. World Malaria Report 2011. Geneva, Switzerland: World Health Organization.

MeSH terms