. 2017 Nov 1;127(11):3954-3969.
doi: 10.1172/JCI93817. Epub 2017 Oct 9.

Uromodulin p.Cys147Trp mutation drives kidney disease by activating ER stress and apoptosis

Affiliations

Uromodulin p.Cys147Trp mutation drives kidney disease by activating ER stress and apoptosis

Bryce G Johnson et al. J Clin Invest. .

Abstract

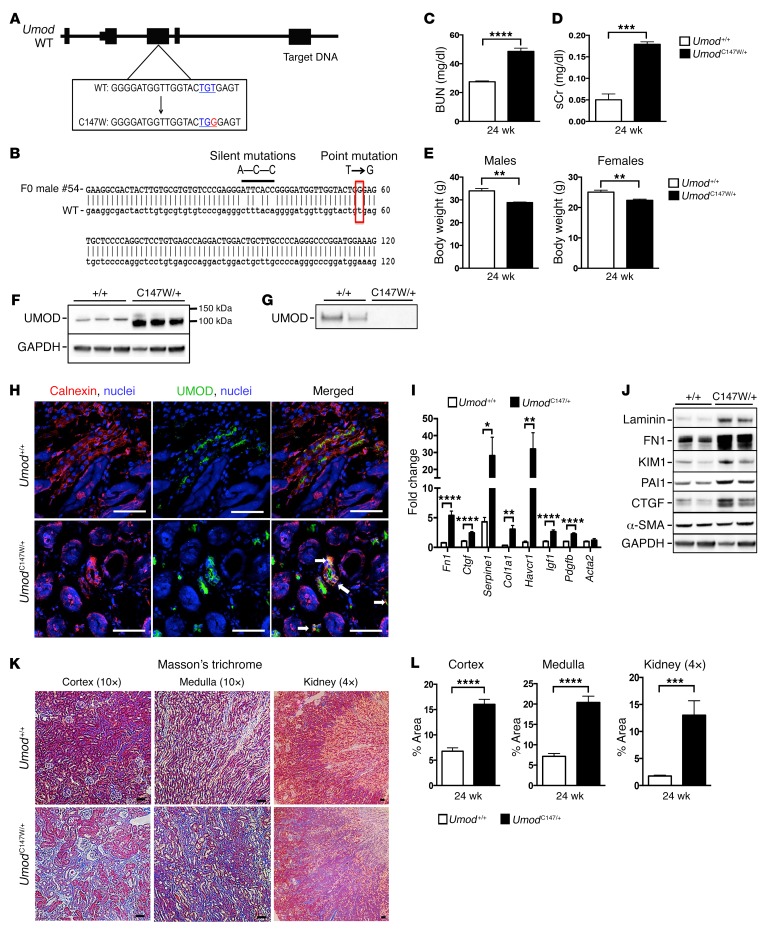
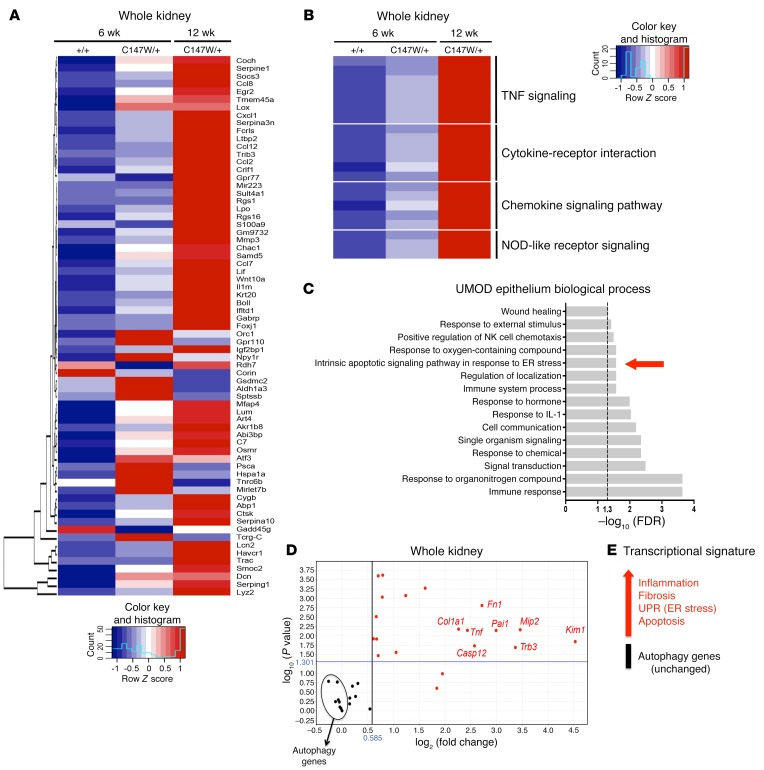
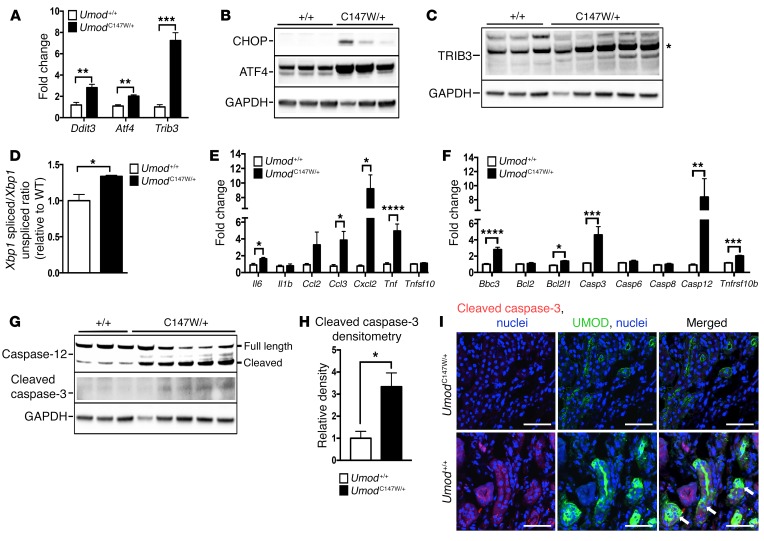
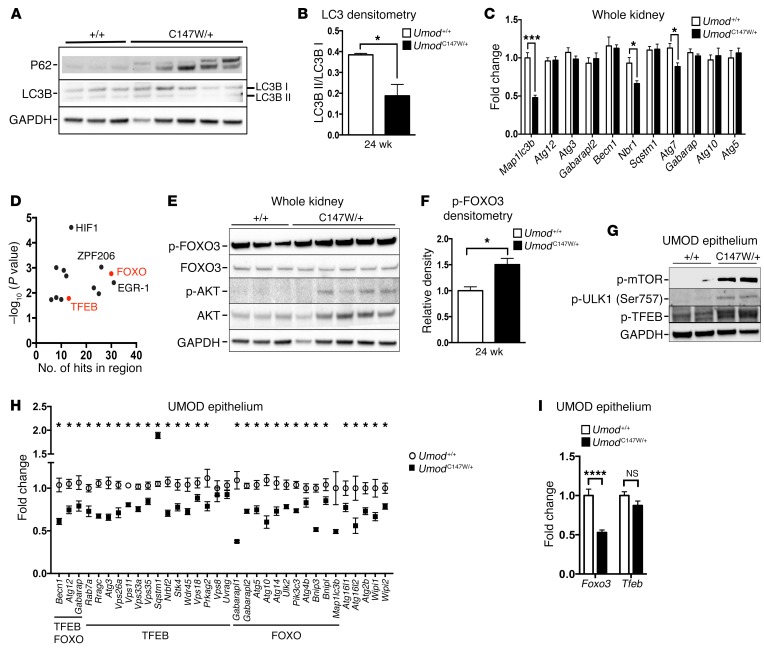
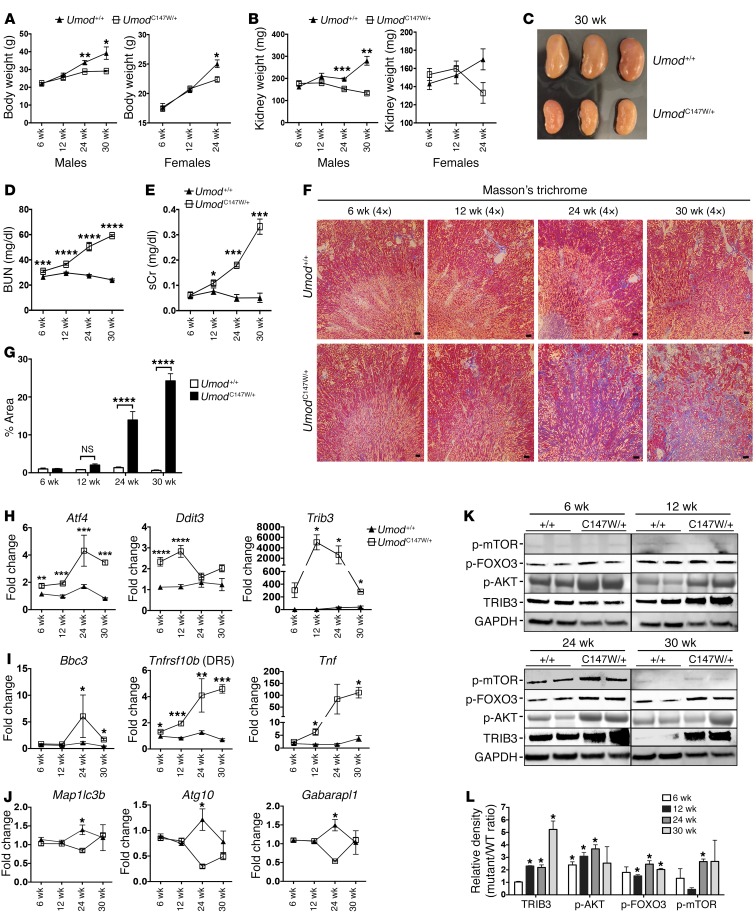
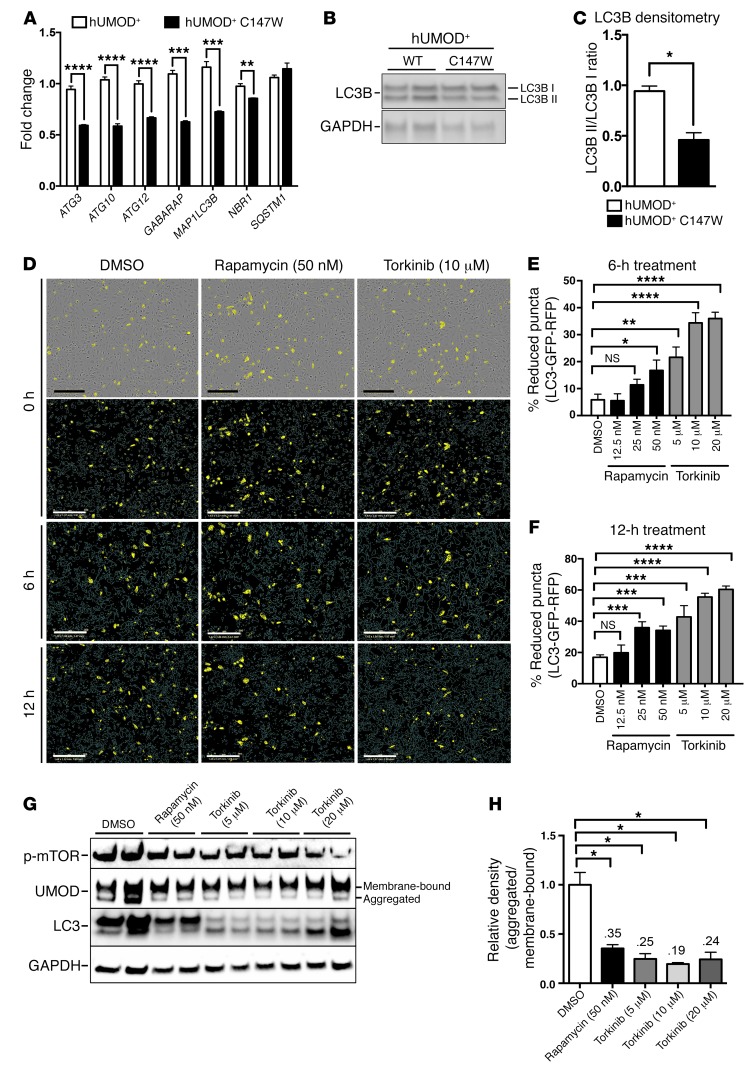
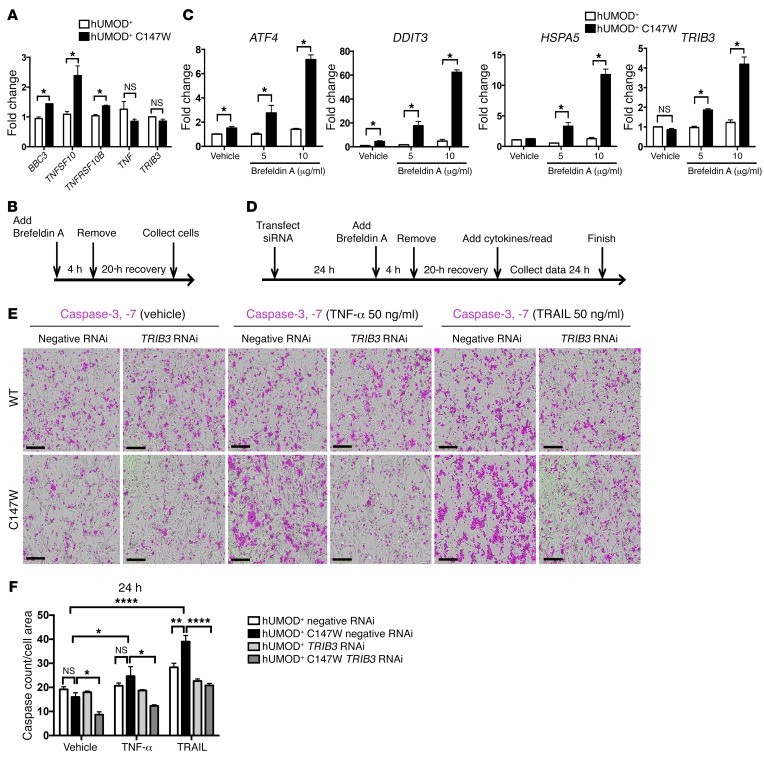
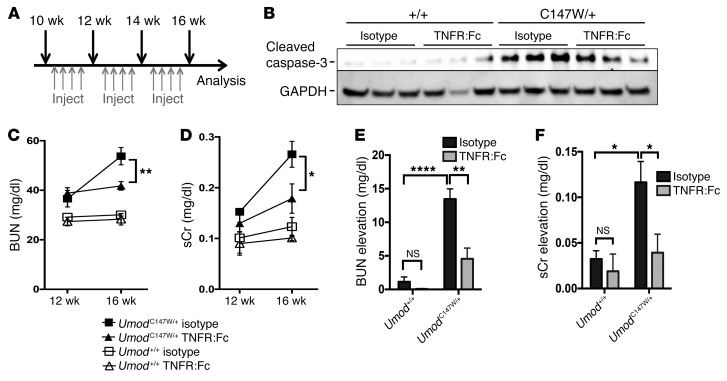
Uromodulin-associated kidney disease (UAKD) is caused by mutations in the uromodulin (UMOD) gene that result in a misfolded form of UMOD protein, which is normally secreted by nephrons. In UAKD patients, mutant UMOD is poorly secreted and accumulates in the ER of distal kidney epithelium, but its role in disease progression is largely unknown. Here, we modeled UMOD accumulation in mice by expressing the murine equivalent of the human UMOD p.Cys148Trp point mutation (UmodC147W/+ mice). Like affected humans, these UmodC147W/+ mice developed spontaneous and progressive kidney disease with organ failure over 24 weeks. Analysis of diseased kidneys and purified UMOD-producing cells revealed early activation of the PKR-like ER kinase/activating transcription factor 4 (PERK/ATF4) ER stress pathway, innate immune mediators, and increased apoptotic signaling, including caspase-3 activation. Unexpectedly, we also detected autophagy deficiency. Human cells expressing UMOD p.Cys147Trp recapitulated the findings in UmodC147W/+ mice, and autophagy activation with mTOR inhibitors stimulated the intracellular removal of aggregated mutant UMOD. Human cells producing mutant UMOD were susceptible to TNF-α- and TRAIL-mediated apoptosis due to increased expression of the ER stress mediator tribbles-3. Blocking TNF-α in vivo with the soluble recombinant fusion protein TNFR:Fc slowed disease progression in UmodC147W/+ mice by reducing active caspase-3, thereby preventing tubule cell death and loss of epithelial function. These findings reveal a targetable mechanism for disease processes involved in UAKD.


Conflict of interest statement

Conflict of interest: B.G. Johnson, L.T. Dang, G. Marsh, A.M. Roach, A. Monti, D. Reyon, L. Feigenbaum, and J.S. Duffield hold stock in Biogen.

Figures

Figure 1
Figure 1. UmodC147W/+ mice exhibit kidney failure at 24 weeks.
(A) Map of murine UMOD locus with annotated WT and mutant p.Cys147Trp sequences (relevant codons are indicated in blue and the point mutation in red). (B) Sequencing results of a representative F0 founder male with a correctly targeted point mutation (in red) and silent mutations (thick black line). (C) BUN results from blood of 24-week-old mice. (D) sCr results from blood of 24-week-old mice. (E) Body weight of 24-week-old male and female mice. (F) Western blot to detect UMOD protein from whole-kidney tissue; the glycosylated band runs larger than the mutant, nonglycosylated band. (G) Western blot to detect UMOD proteins precipitated from urine; levels were undetectable in the mutant urine samples. (H) Immunofluorescence images of kidney sections (7-μm-thick) labeled for the ER marker calnexin (red) and UMOD (green). Arrows indicate an overlap of calnexin and UMOD. Scale bars: 50 μm (original magnification, ×40). (I) Quantitative PCR results for fibrosis-related genes expressed in whole kidneys from 24-week-old mice. (J) Western blot analysis of proteins from whole-kidney tissue to detect markers of fibrosis at the 24-week time point. Note: The blot shown in F was stripped and reprobed for fibrosis markers. (K) Histological images of whole-kidney sections (4-μm-thick) stained with Masson’s trichrome preparation (connective tissue/collagens in blue). Scale bars: 50 μm (original magnification, ×10 [cortex and medulla] and ×4 [kidney]). (L) Quantification of Masson’s trichrome–stained images of collagens. Data represent the mean ± SEM. *P < 0.05, **P < 0.01, ***P < 0.001, and ****P < 0.0001, by 2-tailed Student’s t test. n = 6–8 per group. +/+, Umod+/+; C147W/+, UmodC147W/+.
Figure 2
Figure 2. Transcriptional analysis of UmodC147W/+ kidneys and UMOD-expressing epithelium.
(A) Heatmap of the 40 most DEGs with an adjusted P value of less than 0.05 and a log2 fold change of greater than 1. RNA was isolated from whole-kidney tissue from 12-week-old mice. Scale bar is in fragments per kilobase of transcript per million mapped reads (FPKM). (B) Heatmap of selected enriched terms (adjusted P < 0.05) from KEGG pathway analysis of the 40 most upregulated DEGs. RNA was isolated from whole-kidney tissue from 12-week-old mice. (C) GO enrichment analysis for biological process of the 40 most upregulated DEGs in RNA obtained from isolated UMOD-producing cells from 12-week-old mouse kidneys (adjusted P < 0.05). (D) Volcano plot of genes for inflammation, fibrosis, apoptosis, the UPR, and autophagy (performed with a fold-change cutoff of 1.5 and a P-value cutoff of 0.05). RNA was isolated from 24-week-old whole mouse kidney, and the fold change was assessed using quantitative PCR. (E) Transcriptional signature summary diagram for 24-week-old whole-kidney RNA isolate. n = 8–11 per group.
Figure 3
Figure 3. UmodC147W/+ kidneys activate ER stress, innate immune response, and apoptotic pathways.
(A) Quantitative PCR of whole-kidney tissue at 24 weeks for key ER stress response genes. (B) Western blot of whole-kidney tissue to detect key ER stress mediators. (C) Western blot of whole-kidney tissue to detect TRIB3. Note: The band with the correct size for the predicted molecular weight is marked with a single asterisk. (D) Quantitative PCR of cDNA from whole-kidney tissue for the ratio of spliced to unspliced Xbp1. (E) Quantitative PCR of cDNA from whole-kidney tissue for relevant innate immune mediators. (F) Quantitative PCR of cDNA from whole-kidney tissue for apoptotic mediators. (G) Western blot of whole-kidney tissue to detect cleaved caspase-3 and total caspase-12 (cleaved band runs below the full-length band). (H) Densitometric analysis for cleaved caspase-3 normalized to GAPDH. (I) Immunofluorescence images of kidney sections (7-μm-thick) labeled for active cleaved caspase-3 (red) and UMOD (green). Arrows indicate tubules positive for active caspase-3 and UMOD. Scale bars: 50 μm (original magnification, ×40). Data represent the mean ± SEM. *P < 0.05, **P < 0.01, ***P < 0.001, and ****P < 0.0001, by 2-tailed Student’s t test. n = 6–8 per group.
Figure 4
Figure 4. UmodC147W/+ kidneys are deficient in autophagy.
(A) Western blot of whole-kidney tissue at 24 weeks to detect the macroautophagy mediators p62 and LC3B (LC3B I inactive, LC3B II active). (B) Ratio of active to inactive LC3B by densitometric analysis. (C) Quantitative PCR of whole-kidney tissue at 24 weeks for autophagy-related genes. (D) Promoter analysis for overrepresented transcriptional factor binding sites of relevant autophagy-related genes (P-value cutoff: 0.02). (E) Western blot to detect the transcriptional regulator of autophagy genes FOXO3 and the upstream regulator AKT. Note: The blot from A was stripped and reprobed. (F) Densitometric analysis of p-FOXO3 (inactive). (G and H) Quantitative analysis of isolated UMOD-producing primary murine epithelial cells at 24 weeks for autophagy protein regulators and gene transcripts. (G) Western blot analysis of protein regulators of autophagy. (H) Quantitative PCR for a broad panel of autophagy-related genes, supplemented with additional data points from RNA-seq analysis of isolated UMOD-producing cells at 24 weeks. Gene expression was normalized to Gapdh. (I) Transcript analysis of Foxo3 and Tfeb from RNA-seq of isolated UMOD-producing cells at 24 weeks. Gene expression was normalized to Gapdh. Data represent the mean ± SEM. *P < 0.05, ***P < 0.001, and ****P < 0.0001, by 2-tailed Student’s t test or 2-way ANOVA with post-hoc testing. n = 6–9 per group.
Figure 5
Figure 5. Time course reveals a pattern of disease progression in UmodC147W/+ mice.
(A) Body weight over time in male and female mice. (B) Left kidney weight over time in male and female mice. (C) Image of 30-week-old kidneys showing a marked reduction the size of the kidneys with mutation. (D) BUN measurements over a 30-week period. (E) sCr over a 30-week period. (F) Masson’s trichrome–stained images from 6 to 30 weeks. Scale bars: 50 μm (original magnification, ×4). (G) Quantification of collagen area (blue stain) from Masson’s trichrome–stained images. (HJ) Quantitative PCR of directly isolated UMOD-producing primary murine tubular epithelial cells over time. (H) Time course showing levels of ER stress genes. (I) Time course showing levels of apoptosis/innate immune genes. (J) Time course showing levels of autophagy-related genes. (K) Representative Western blots to detect proteins in isolated UMOD-producing primary murine epithelial cells from 6 to 30 weeks showing TRIB3 and key autophagy regulators. (L) Densitometric analysis of TRIB3, p-AKT, p-FOXO3, and p-mTOR. Data represent the mean ± SEM. *P < 0.05, **P < 0.01, ***P < 0.001, and ****P < 0.0001, by 2-way ANOVA with post-hoc testing. n = 8 per group for 6 to 24 weeks; n = 3 per group for 30 weeks.
Figure 6
Figure 6. Autophagy enhancement degrades accumulated mutant UMOD in primary human kidney epithelial cells.
(A) Quantitative PCR of human UMOD-producing cell lines (hUMOD+) for key autophagy-related genes. (B) Western blot analysis to detect LC3B (LC3B I inactive, LC3B II active). (C) Ratio of active to inactive LC3B by densitometric analysis. (D) Images of LC3B-GFP-RFP puncta in hUMOD+ C147W-mutant cell line with either DMSO (0.1%), rapamycin (50 nM), or torkinib (10 μM) at 0, 6, and 12 hours. Scale bars: 300 μm (original magnification, ×10). Note the bright-field representation at the top with yellow puncta. Blue lines in the images indicate the cell outline. (E and F) Quantification of the percentage of reduction in the number of LC3B-GFP-RFP puncta from 0 to 6 hours and 0 to 12 hours. (G) Western blot analysis of p-mTOR, UMOD, and LC3B (LC3B I inactive, LC3B II active) in the hUMOD+ C147W-mutant cell line. Note the clearance of the lower, aggregate-sized band of UMOD with treatment of the autophagy enhancers rapamycin and torkinib. (H) Densitometric analysis of the ratio of aggregated to membrane-bound forms of UMOD. Representative data from 1 of 3 (AF) or 1 of 5 (G and H) experiments are shown. Data represent the mean ± SEM. *P < 0.05, **P < 0.01, ***P < 0.001, and ****P < 0.0001, by 2-tailed Student’s t test or 2-way ANOVA with post-hoc testing. n = 3–6 per group.
Figure 7
Figure 7. Silencing of TRIB3 in primary human renal epithelial cells rescues them from ER stress–induced sensitivity to TNF-α– and TRAIL–mediated apoptosis.
(A) Quantitative PCR of human UMOD-producing cell lines for the expression of genes related to ER stress–mediated apoptosis. (B and C) In vitro protocol for inducing mutant UMOD protein–mediated apoptosis. (B) Timeline diagram indicating the experimental setup for transient treatment of UMOD-producing cell lines with the ER stress inducer brefeldin A (5 and 10 μg/ml). (C) Quantitative PCR of human UMOD-producing cell lines treated as indicated in panel B for key genes related to ER stress. Note the dose responsiveness to increasing concentrations of brefeldin A. (DF) In vitro platform for assessing the role of TRIB3 in ER stress–mediated apoptosis in primary human UMOD-producing cell lines. (D) Schema of the experimental protocol for TRIB3 silencing, transient induction of ER stress with brefeldin A, recovery, stimulation with cytokines to induce apoptosis, and quantification of caspase-3 and caspase-7 activity. (E) Images of caspase-3, -7 activity (in purple) of human UMOD-producing cell lines after 24 hours of treatment with vehicle, TNF-α (50 ng/ml), or TRAIL (50 ng/ml). Scale bars: 300 μm. (F) Quantification of caspase-3, -7 activity normalized to the cell area. Note the marked reduction in response to TNF-α and TRAIL treatment in the mutant cell line with TRIB3 silencing. Representative data from 1 of 3 experiments are shown (A, C, E, and F). Data represent the mean ± SEM. *P < 0.05, **P < 0.01, and ****P < 0.0001, by 2-tailed Student’s t test or 2-way ANOVA with post-hoc testing. n = 3–6 per group.
Figure 8
Figure 8. TNF-α blockade prevents a functional decline in UmodC147W/+ mice.
(A) Schema showing the therapeutic protocol for delivery of TNFR:Fc (10 mg/kg/dose) and evaluation of disease. (B) Western blot analysis to detect cleaved caspase-3 (active form) in whole-kidney tissue from 16-week-old mice. Note the reduction of active caspase-3 with TNFR:Fc treatment. (C) BUN measurements from 12 to 16 weeks. (D) sCr levels from 12 to 16 weeks. (E) Quantification of longitudinal elevation in BUN per individual animal. (F) Quantification of longitudinal elevation in sCr per individual animal. Data represent the mean ± SEM. *P < 0.05, **P < 0.01, and ****P < 0.0001, by 2-way ANOVA with post-hoc testing. n = 4–6 per group.

Comment in

References

    1. Gast C, Marinaki T, Arenas-Hernandez M, Campbell S, Venkat-Raman G. SuO028 genetic testing reveals increased prevalence of uromodulin associated kidney disease. Nephrol Dial Transplant. 2015;30(suppl_3):iii56
    1. Gardner KD. Evolution of clinical signs in adult-onset cystic disease of the renal medulla. Ann Intern Med. 1971;74(1):47–54. doi: 10.7326/0003-4819-74-1-47. - DOI - PubMed
    1. Hart TC, et al. Mutations of the UMOD gene are responsible for medullary cystic kidney disease 2 and familial juvenile hyperuricaemic nephropathy. J Med Genet. 2002;39(12):882–892. doi: 10.1136/jmg.39.12.882. - DOI - PMC - PubMed
    1. Rampoldi L, et al. Allelism of MCKD, FJHN and GCKD caused by impairment of uromodulin export dynamics. Hum Mol Genet. 2003;12(24):3369–3384. doi: 10.1093/hmg/ddg353. - DOI - PubMed
    1. Dahan K, et al. A cluster of mutations in the UMOD gene causes familial juvenile hyperuricemic nephropathy with abnormal expression of uromodulin. J Am Soc Nephrol. 2003;14(11):2883–2893. doi: 10.1097/01.ASN.0000092147.83480.B5. - DOI - PubMed

MeSH terms