

Robust Regression Analysis of GCMS Data Reveals Differential Rewiring of Metabolic Networks in Hepatitis B and C Patients
- PMID: 28991180
- PMCID: PMC5746731
- DOI: 10.3390/metabo7040051
Robust Regression Analysis of GCMS Data Reveals Differential Rewiring of Metabolic Networks in Hepatitis B and C Patients
Abstract
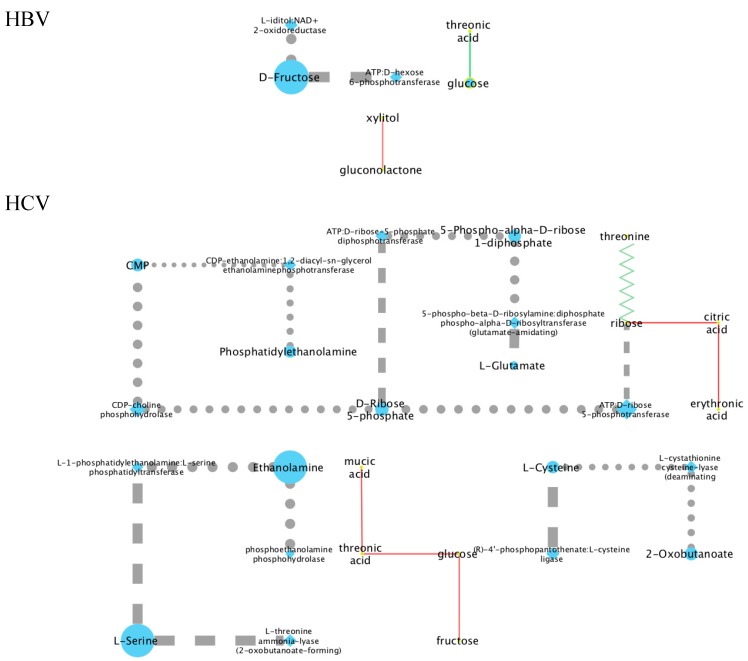
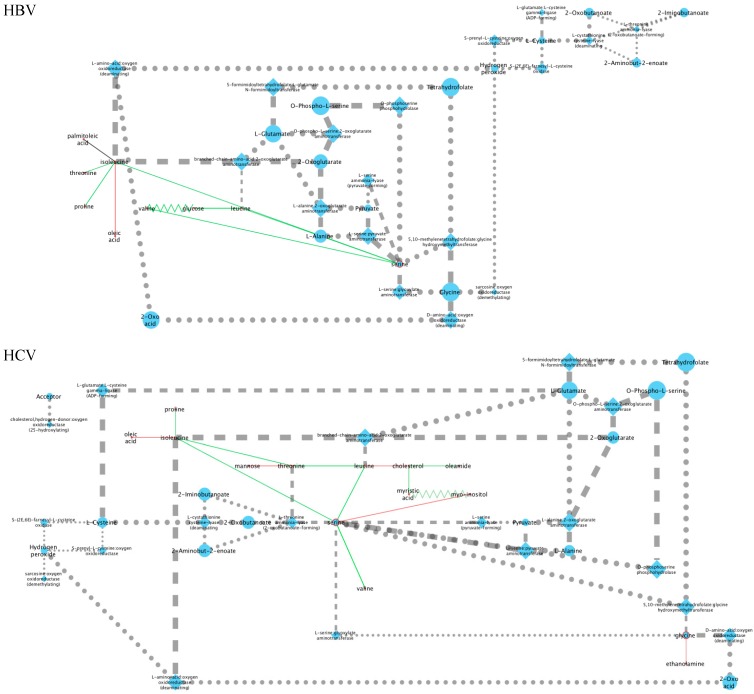
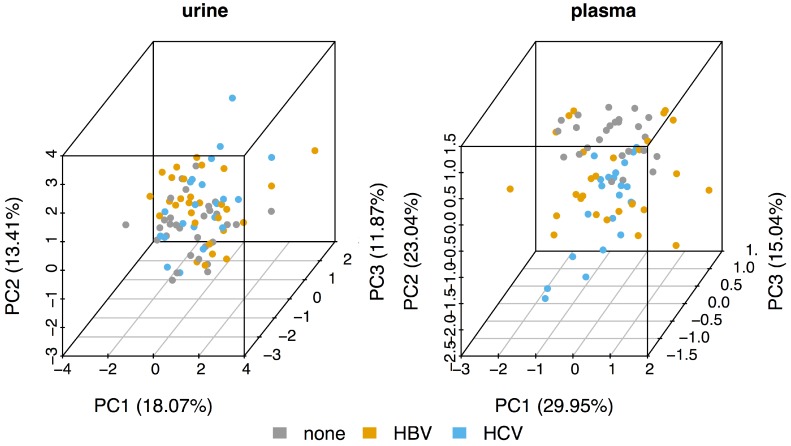
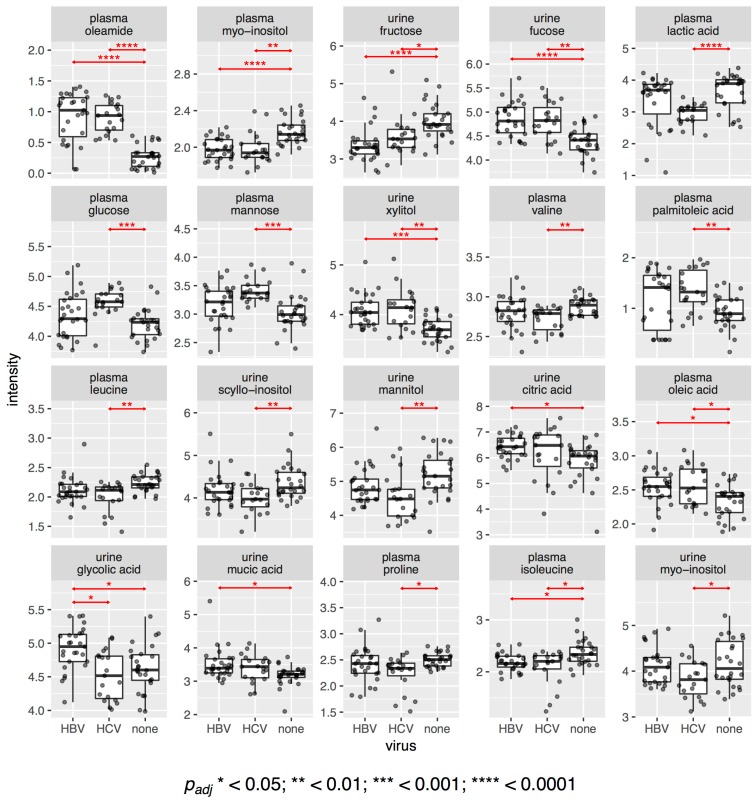
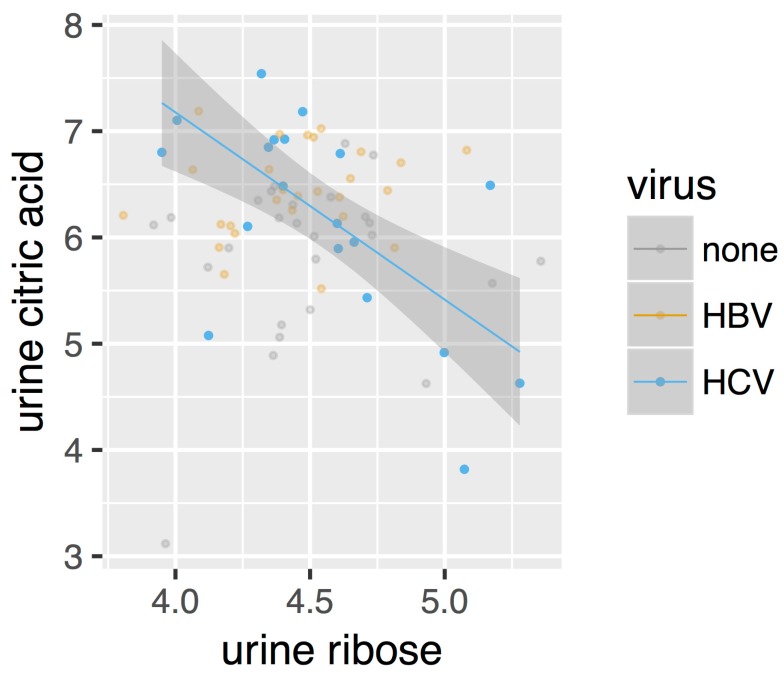
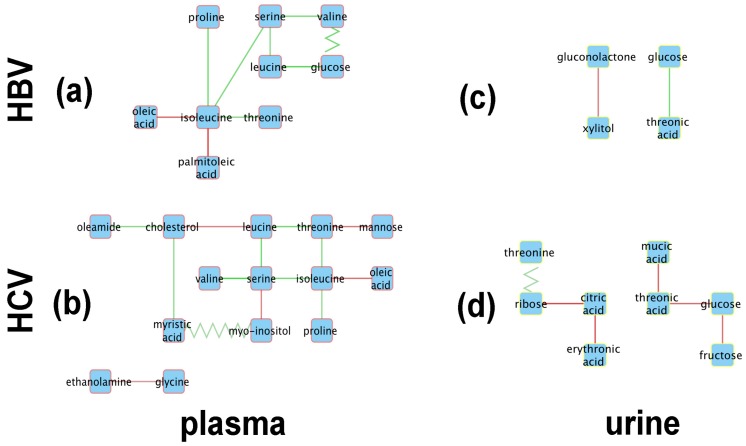
About one in 15 of the world's population is chronically infected with either hepatitis virus B (HBV) or C (HCV), with enormous public health consequences. The metabolic alterations caused by these infections have never been directly compared and contrasted. We investigated groups of HBV-positive, HCV-positive, and uninfected healthy controls using gas chromatography-mass spectrometry analyses of their plasma and urine. A robust regression analysis of the metabolite data was conducted to reveal correlations between metabolite pairs. Ten metabolite correlations appeared for HBV plasma and urine, with 18 for HCV plasma and urine, none of which were present in the controls. Metabolic perturbation networks were constructed, which permitted a differential view of the HBV- and HCV-infected liver. HBV hepatitis was consistent with enhanced glucose uptake, glycolysis, and pentose phosphate pathway metabolism, the latter using xylitol and producing threonic acid, which may also be imported by glucose transporters. HCV hepatitis was consistent with impaired glucose uptake, glycolysis, and pentose phosphate pathway metabolism, with the tricarboxylic acid pathway fueled by branched-chain amino acids feeding gluconeogenesis and the hepatocellular loss of glucose, which most probably contributed to hyperglycemia. It is concluded that robust regression analyses can uncover metabolic rewiring in disease states.
Keywords: TCA cycle; gluconeogenesis; glucose transporters; glycolysis; hepatitis B virus; hepatitis C virus; metabolic perturbation networks; metabolomics; pentose phosphate pathway; robust regression analysis.
Conflict of interest statement
The authors declare no conflicts of interest.
Figures
References
-
- Chang M., Cheng M., Chang S., Tang H., Chiu C., Yeh C., Shiao M. Recovery of pan-genotypic and genotype-specific amino acid alterations in chronic hepatitis C after viral clearance: transition at the crossroad of metabolism and immunity. Amino acids. 2017;49:291–302. doi: 10.1007/s00726-016-2360-7. - DOI - PubMed
-
- Elsemman I.E., Mardinoglu A., Shoaie S., Soliman T.H., Nielsen J. Systems biology analysis of hepatitis C virus infection reveals the role of copy number increases in regions of chromosome 1q in hepatocellular carcinoma metabolism. Mol. Biosyst. 2016;12:1496–1506. doi: 10.1039/C5MB00827A. - DOI - PubMed
LinkOut - more resources
Full Text Sources
Other Literature Sources
