Super-enhancers define a proliferative PGC-1α-expressing melanoma subgroup sensitive to BET inhibition
- PMID: 28991225
- PMCID: PMC5799712
- DOI: 10.1038/onc.2017.325
Super-enhancers define a proliferative PGC-1α-expressing melanoma subgroup sensitive to BET inhibition
Abstract
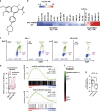
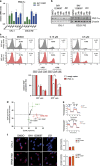
Metabolic changes are linked to epigenetic reprogramming and play important roles in several tumor types. PGC-1α is a transcriptional coactivator controlling mitochondrial biogenesis and is linked to oxidative phosphorylation. We provide evidence that melanoma models with elevated PGC-1α levels are characteristic of the proliferative phenotype and are sensitive to bromodomain and extra-terminal domain (BET) inhibitor treatment. A super-enhancer region highly occupied by the BET family member BRD4 was identified for the PGC-1α gene. BET inhibitor treatment prevented this interaction, leading to a dramatic reduction of PGC-1α expression. Accordingly, BET inhibition diminished respiration and mitochondrial function in cells. In vivo, melanoma models with high PGC-1α expression strongly responded to BET inhibition by reduction of PGC-1α and impaired tumor growth. Altogether, our findings identify epigenetic regulatory elements that define a subset of melanomas with high sensitivity to BET inhibition, which opens up the opportunity to define melanoma patients most likely to respond to this treatment, depending on their tumor characteristics.
Conflict of interest statement
All authors are or were employees of Bayer AG.
Figures


Similar articles
-
Response and resistance to BET bromodomain inhibitors in triple-negative breast cancer.Nature. 2016 Jan 21;529(7586):413-417. doi: 10.1038/nature16508. Epub 2016 Jan 6. Nature. 2016. PMID: 26735014 Free PMC article.
-
Disruption of BRD4 at H3K27Ac-enriched enhancer region correlates with decreased c-Myc expression in Merkel cell carcinoma.Epigenetics. 2015;10(6):460-6. doi: 10.1080/15592294.2015.1034416. Epub 2015 May 5. Epigenetics. 2015. PMID: 25941994 Free PMC article.
-
BET bromodomain inhibitors suppress EWS-FLI1-dependent transcription and the IGF1 autocrine mechanism in Ewing sarcoma.Oncotarget. 2016 Jul 12;7(28):43504-43517. doi: 10.18632/oncotarget.9762. Oncotarget. 2016. PMID: 27259270 Free PMC article.
-
BET bromodomain inhibitors--a novel epigenetic approach in castration-resistant prostate cancer.Cancer Biol Ther. 2014;15(12):1583-5. doi: 10.4161/15384047.2014.962297. Cancer Biol Ther. 2014. PMID: 25535892 Free PMC article. Review.
-
Bromodomains: Structure, function and pharmacology of inhibition.Biochem Pharmacol. 2016 Apr 15;106:1-18. doi: 10.1016/j.bcp.2015.12.005. Epub 2015 Dec 18. Biochem Pharmacol. 2016. PMID: 26707800 Review.
Cited by
-
Darolutamide antagonizes androgen signaling by blocking enhancer and super-enhancer activation.Mol Oncol. 2020 Sep;14(9):2022-2039. doi: 10.1002/1878-0261.12693. Epub 2020 Jun 5. Mol Oncol. 2020. PMID: 32333502 Free PMC article.
-
From metabolism to malignancy: the multifaceted role of PGC1α in cancer.Front Oncol. 2024 May 7;14:1383809. doi: 10.3389/fonc.2024.1383809. eCollection 2024. Front Oncol. 2024. PMID: 38774408 Free PMC article. Review.
-
The emerging role of BET inhibitors in breast cancer.Breast. 2020 Oct;53:152-163. doi: 10.1016/j.breast.2020.08.005. Epub 2020 Aug 13. Breast. 2020. PMID: 32827765 Free PMC article. Review.
-
Super-enhancers and the super-enhancer reader BRD4: tumorigenic factors and therapeutic targets.Cell Death Discov. 2023 Dec 22;9(1):470. doi: 10.1038/s41420-023-01775-6. Cell Death Discov. 2023. PMID: 38135679 Free PMC article. Review.
-
Targeting Super-Enhancers as a Therapeutic Strategy for Cancer Treatment.Front Pharmacol. 2019 Apr 11;10:361. doi: 10.3389/fphar.2019.00361. eCollection 2019. Front Pharmacol. 2019. PMID: 31105558 Free PMC article. Review.
References
MeSH terms
Substances
LinkOut - more resources
Full Text Sources
Other Literature Sources
Medical
Molecular Biology Databases

