. 2018 Feb 1;37(5):651-662.
doi: 10.1038/onc.2017.372. Epub 2017 Oct 9.

Hypoxia activates cadherin-22 synthesis via eIF4E2 to drive cancer cell migration, invasion and adhesion

Affiliations

Hypoxia activates cadherin-22 synthesis via eIF4E2 to drive cancer cell migration, invasion and adhesion

N J Kelly et al. Oncogene. .

Abstract

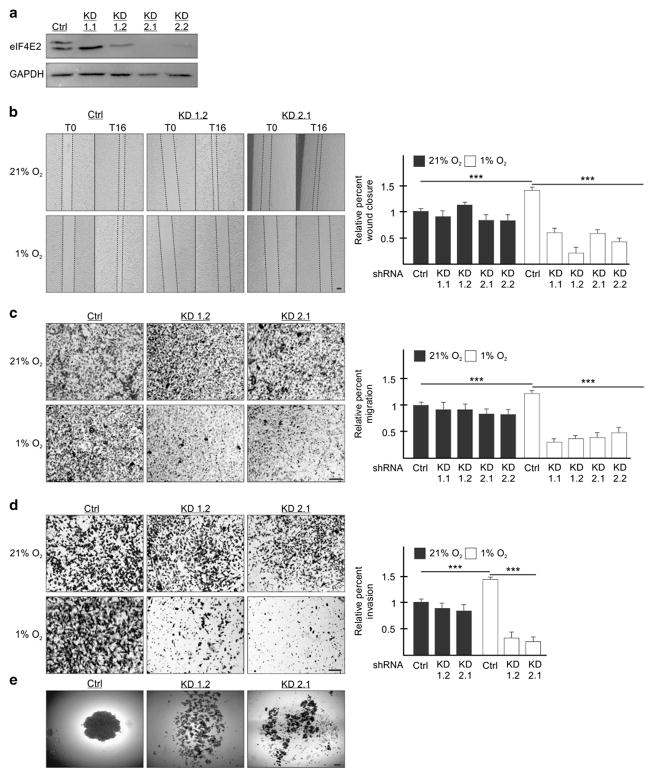
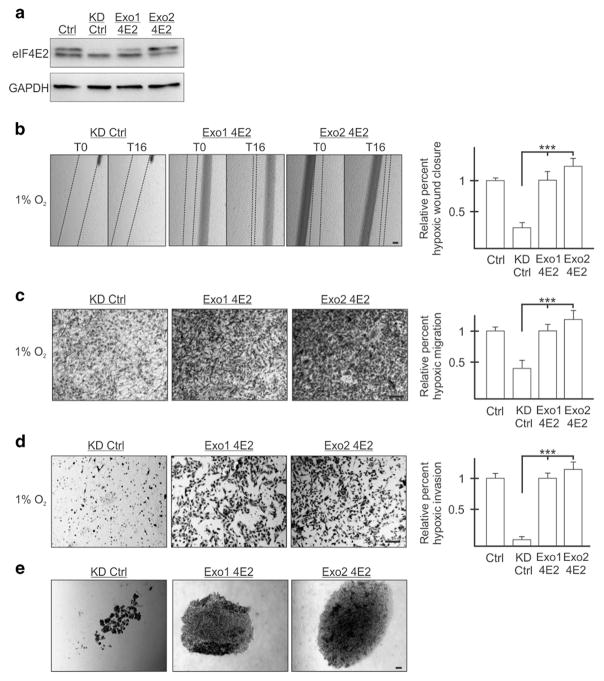
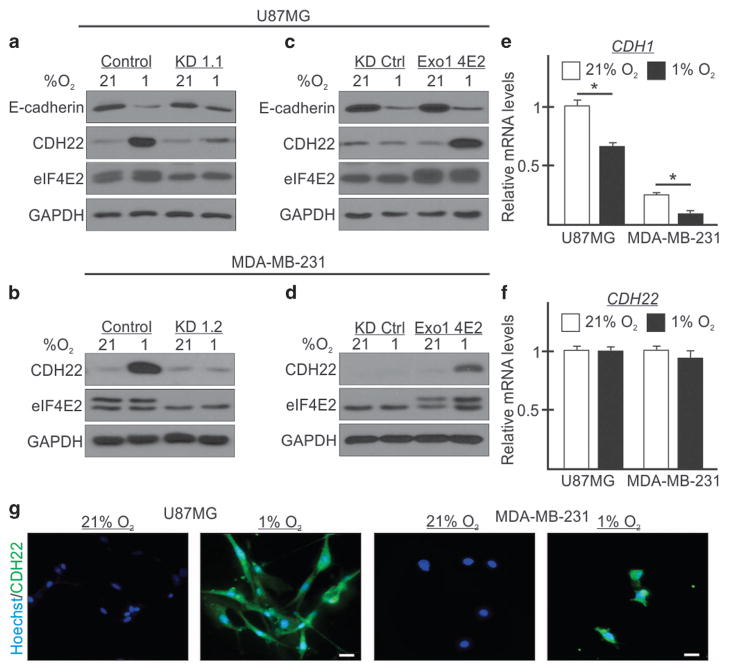
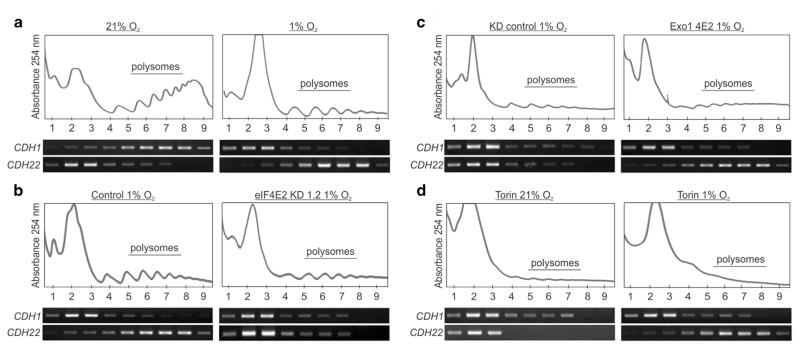
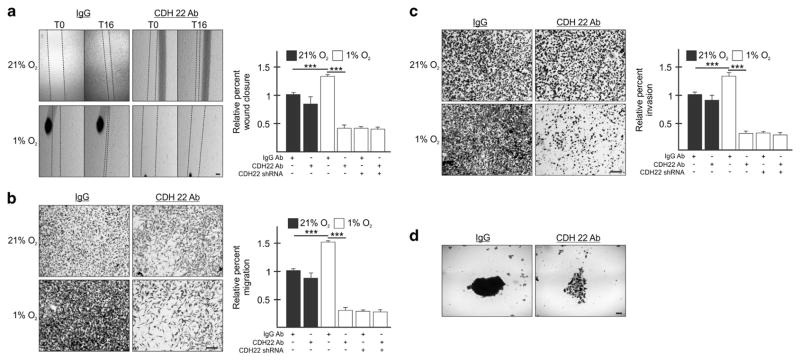
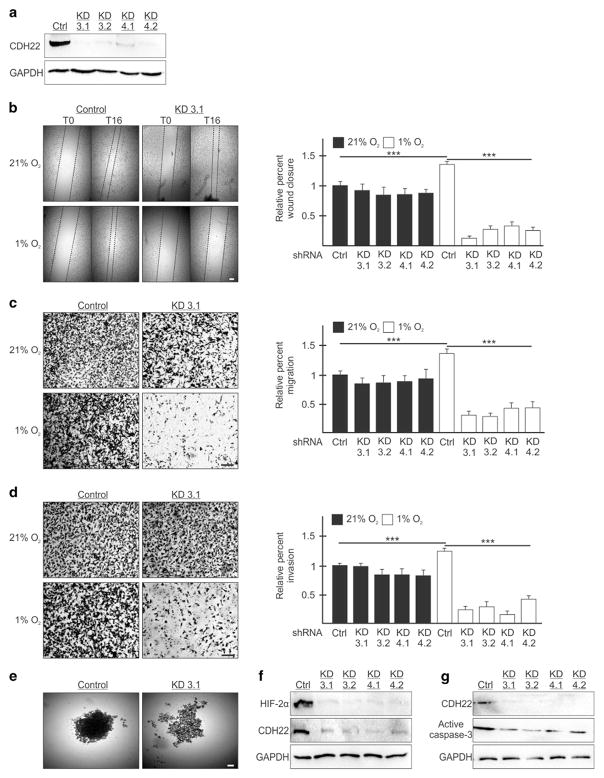
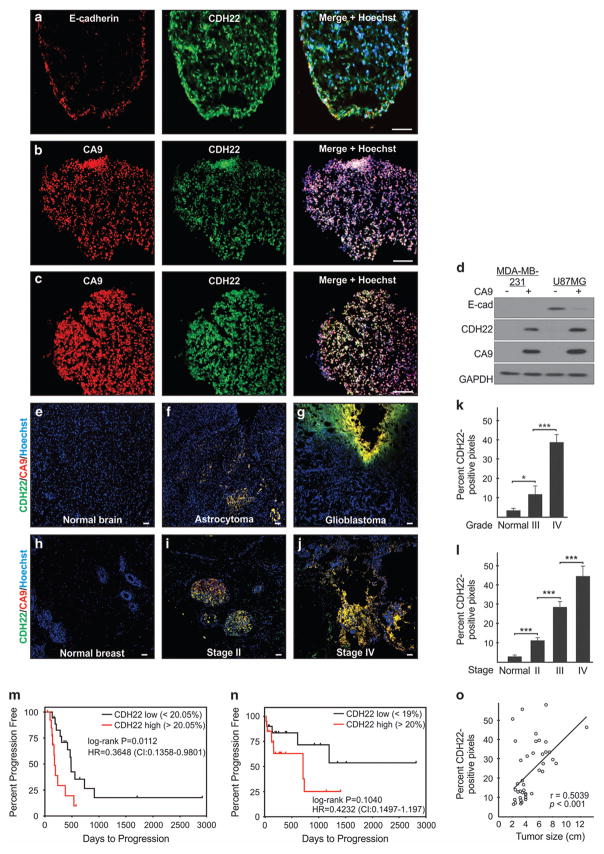
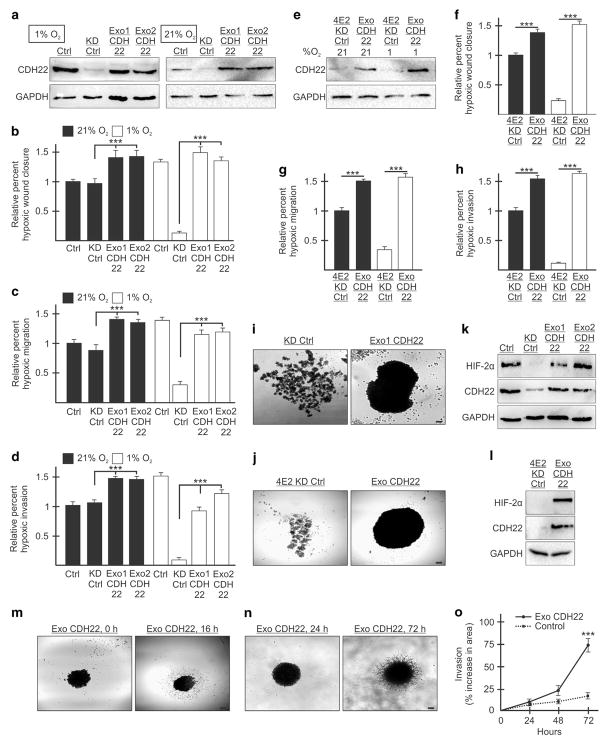
Hypoxia is a driver of cell movement in processes such as development and tumor progression. The cellular response to hypoxia involves a transcriptional program mediated by hypoxia-inducible factors, but translational control has emerged as a significant contributor. In this study, we demonstrate that a cell-cell adhesion molecule, cadherin-22, is upregulated in hypoxia via mTORC1-independent translational control by the initiation factor eIF4E2. We identify new functions of cadherin-22 as a hypoxia-specific cell-surface molecule involved in cancer cell migration, invasion and adhesion. Silencing eIF4E2 or cadherin-22 significantly impaired MDA-MB-231 breast carcinoma and U87MG glioblastoma cell migration and invasion only in hypoxia, while reintroduction of the respective exogenous gene restored the normal phenotype. Cadherin-22 was evenly distributed throughout spheroids and required for their formation and support of a hypoxic core. Conversely, E-cadherin translation was repressed by hypoxia and only expressed in the oxygenated cells of U87MG spheroids. Furthermore, immunofluorescence on paraffin-embedded human tissue from 40 glioma and 40 invasive ductal breast carcinoma patient specimens revealed that cadherin-22 expression colocalized with areas of hypoxia and significantly correlated with tumor grade and progression-free survival or stage and tumor size, respectively. This study broadens our understanding of tumor progression and metastasis by highlighting cadherin-22 as a potential new target of cancer therapy to disable hypoxic cancer cell motility and adhesion.


Conflict of interest statement

CONFLICT OF INTEREST

The authors declare no conflict of interest.

Figures

Figure 1
Figure 1
eIF4E2 is required for MDA-MB-231 cell migration, invasion and spheroid formation in hypoxia. (a) Western blot of eIF4E2 protein levels in control (Ctrl) cells stably expressing a non-targeting shRNA or in cells stably expressing one of two shRNAs targeting eIF4E2 mRNA: Knockdown (KD) 1 and KD2. Two clones of each stable cell line were generated: KD1.1, KD1.2, KD2.1 and KD2.2. GAPDH used as a loading control. (b) Control and eIF4E2 KD cells exposed to normoxia (21% O2) or hypoxia (1% O2) for 24 h followed by wound generation. Representative images at 0 h (T0) and 16 h (T16) after wound generation. (c, d) Transwell migration (c) and invasion (d) assays of control and eIF4E2 KD cells exposed to normoxia or hypoxia for 24 h. Representative images of transwell inserts 16 h after seeding and stained with crystal violet. (e) Light micrographs of spheroids composed of control cells or eIF4E2-depleted cells (KD1.2 and 2.1). Data are presented relative to normoxic Ctrl as mean ±s.e.m., n ≥3, ***P<0.001, using a one-way ANOVA followed by Tukey’s HSD test. Scale bar, 100 μm.
Figure 2
Figure 2
Reintroduction of exogenous eIF4E2 restores the ability of MDA-MB-231 cells to migrate, invade and adhere to one another in hypoxia. (a) Western blot of eIF4E2 protein levels in control (Ctrl) cells stably expressing a non-targeting shRNA, eIF4E2 knockdown control (KD Ctrl) cells stably expressing shRNA targeting eIF4E2 mRNA and an exogenous empty vector or the eIF4E2 coding sequence (Exo1 4E2 and Exo2 4E2). GAPDH used as a loading control. (b) KD Ctrl, Exo1 4E2 and Exo2 4E2 cells exposed to hypoxia (1% O2) for 24 h followed by wound generation. Representative images at 0 h (T0) and 16 h (T16) after wound generation. (c and d) Transwell migration (c) and invasion (d) assays of KD Ctrl, Exo1 4E2 and Exo2 4E2 cells exposed to hypoxia for 24 h. Representative images of transwell inserts 16 h after seeding and stained with crystal violet. (e) Light micrographs of spheroids composed of KD Ctrl, Exo1 4E2 and Exo2 4E2 cells. Data are presented as mean ±s.e.m., n ≥3, ***P<0.001, using a one-way ANOVA followed by Tukey’s HSD test. Scale bar, 100 μm.
Figure 3
Figure 3
Hypoxia causes CDH22 protein accumulation in an eIF4E2-dependent manner independent of its transcript abundance. (ad) Western blot of CDH22 and eIF4E2 protein levels in normoxic (21% O2) and hypoxic (1% O2) U87MG (a, c) and MDA-MB-231 (b, d) control cells stably expressing a non-targeting shRNA, in cells stably expressing shRNA targeting eIF4E2 mRNA (KD1.1 or 1.2), KD cells stably expressing an exogenous empty vector (KD Ctrl) or the eIF4E2 coding sequence (Exo1 4E2). GAPDH used as a loading control. (e, f) CDH1 (e) and CDH22 (f) mRNA levels measured by quantitative reverse transcriptase–PCR in U87MG and MDA-MB-231 control cells stably expressing a non-targeting shRNA exposed to normoxia or hypoxia. Data are presented as mean ±s.e.m., n =3, *P<0.05 (Student’s t-test). (g) Immunofluorescence of CDH22 in U87MG and MDA-MB-231 cells exposed to normoxia and hypoxia. Scale bar, 10 μm.
Figure 4
Figure 4
Hypoxia represses CDH1 mRNA translation and activates CDH22 synthesis in an eIF4E2-dependent manner. (ac) The polysomal association of CDH1 and CDH22 mRNAs was observed by reverse transcriptase (RT)–PCR in parental (a), control cells stably expressing a non-targeting shRNA (b), or shRNA targeting eIF4E2 mRNA (KD1.2) (b), KD cells stably expressing an exogenous empty vector (KD Ctrl) (c), or the exogenous eIF4E2 coding sequence (Exo1 4E2) (c) under the indicated oxygen conditions. (d) The polysomal association of CDH1 and CDH22 mRNAs was observed by RT–PCR in parental cells exposed to normoxia or hypoxia and the mTORC1 inhibitor Torin 1 for 2 h. Images are representative of at least three biological replicates. All experiments performed in MDA-MB-231 breast carcinoma.
Figure 5
Figure 5
Blocking CDH22 impairs hypoxic MDA-MB-231 cell migration, invasion and spheroid formation. (a) Parental cells or cells stably expressing shRNA targeting CDH22 (clone KD3.1) incubated with a control non-targeting antibody (IgG) or an antibody targeting the extracellular domain of CDH22 were exposed to normoxia (21% O2) or hypoxia (1% O2) for 24 h followed by wound generation. Representative images at 0 h (T0) and 16 h (T16) after wound generation. (b, c) Transwell migration (b) and invasion (c) assays of parental cells or cells stably expressing shRNA targeting CDH22 incubated with control or anti-CDH22 antibodies and exposed to normoxia or hypoxia for 24 h. Representative images of transwell inserts 16 h after seeding and stained with crystal violet. (d) Light micrographs of spheroids composed of parental cells incubated with control or anti-CDH22 antibodies. Data are presented relative to normoxic Ctrl as mean ±s.e.m., n ≥3, ***P<0.001, using a one-way ANOVA followed by Tukey’s HSD test. Scale bar, 100 μm.
Figure 6
Figure 6
Silencing CDH22 impairs hypoxic MDA-MB-231 cell migration, invasion and spheroid formation. (a) Western blot of CDH22 hypoxic protein levels in control (Ctrl) cells stably expressing a non-targeting shRNA or in cells stably expressing one of two shRNAs targeting CDH22 mRNA: Knockdown (KD) 3 and KD4. Two clones of each were generated: KD3.1, KD3.2, KD4.1 and KD4.2. GAPDH used as a loading control. (b) Control and CDH22 KD cells exposed to normoxia (21% O2) or hypoxia (1% O2) for 24 h followed by wound generation. Representative images at 0 h (T0) and 16 h (T16) after wound generation. (c, d) Transwell migration (c) and invasion (d) assays of control and CDH22 KD cells exposed to normoxia or hypoxia for 24 h. Representative images of transwell inserts 16 h after seeding and stained with crystal violet. (e) Light micrographs of spheroids composed of control cells or CDH22-depleted cells (KD3.1). (f, g) Western blot of hypoxia-inducible factor-2α (f) and active caspase-3 (g) protein levels in lysates of spheroids composed of control cells or CDH22-depleted cells. Data are presented relative to normoxic Ctrl as mean ±s.e.m., n ≥3, ***P<0.001, using a one-way ANOVA followed by Tukey’s HSD test. Scale bar, 100 μm.
Figure 7
Figure 7
CDH22 expression colocalizes with hypoxia and correlates with clinical parameters in human glioma and invasive ductal breast carcinoma. (a) Immunofluorescence of E-cadherin and CDH22 in U87MG spheroids. (b, c) Immunofluorescence of CDH22 and CA9 (hypoxia) in MDA-MB-231 (b) and U87MG (c) spheroids. (d) Sorting of CA9-positive and CA9-negative spheroid cells followed by western blot. (ej) Immunofluorescence at × 100 magnification of CDH22 and CA9 on tissue sections from human normal brain (e), WHO grade III astrocytoma (f), WHO grade IV glioblastoma (g), normal breast (h), stage II (i) and stage IV breast carcinoma (j). Scale bar, 100 μm. Hoechst was used as a marker of cells (nuclei). (k) Quantification of CDH22 expression in WHO grade III glioma (n =20), WHO grade IV glioma (n =20) and normal brain tissue (n =10). (l) Quantification of CDH22 expression in stage II (n =19), stage III (n =11) and stage IV breast carcinoma (n =9), and normal breast tissue (n =10). *P<0.05, ***P<0.001, using a one-way ANOVA followed by Tukey’s HSD test. (m, n) Kaplan–Meier plots (univariate analysis) assessing the progression-free survival of glioma (m; n =36, HR =0.3648, P =0.0112) and breast carcinoma (n; n = 40, HR =0.4232, P =0.1040) patients grouped into high and low CDH22 expression using the median expression as threshold. P<0.05 was considered statistically significant using the log-rank test. In a multivariate Cox proportional hazards model (adjusted for CDH22 and CA9 expression, grade or stage, and tumor size), CDH22 expression remained a statistically significant, or favorable, independent predictor of poor prognosis in glioma (HR =0.1537, 95% CI =0.0075–0.2999, P =0.0394) and breast carcinoma (HR =0.4551, 95% CI =0.1816–1.2289, P =0.156). (o) CDH22 expression positively correlates with breast carcinoma tumor size (n =40; Pearson’s correlation coefficient =0.5039, P<0.001). Images are representative of three biological replicates (spheroids) or 40 patient cases each of glioma and breast carcinoma summarized in Supplementary Tables S1 and S2. CI, confidence interval; HR, hazard ratio.
Figure 8
Figure 8
Reintroduction of exogenous CDH22 restores the ability of MDA-MB-231 cells to migrate, invade and adhere to one another in hypoxia. (a) Western blot of control (Ctrl) cells stably expressing a non-targeting shRNA, CDH22 knockdown control (KD Ctrl) cells stably expressing shRNA targeting CDH22 mRNA and an exogenous empty vector or CDH22 codon-optimized coding sequence (clones Exo1 CDH22 and Exo2 CDH22) in hypoxia and normoxia. GAPDH used as a loading control. (bd) Cells in (a) exposed to normoxia or hypoxia for 24 h followed by wound generation (b), or transwell migration (c) and invasion (d) assays. (e) Western blot of cells stably expressing shRNA targeting eIF4E2 and either an empty vector (4E2KD Ctrl) or exogenous CDH22 (Exo CDH22). (fh) Cells in (e) exposed to normoxia or hypoxia for 24 h followed by wound generation (f), or transwell migration (g) and invasion (h) assays. (i, j) Spheroids composed of CDH22-depleted (i) or eIF4E2-depleted (j) control cells expressing empty vector or exogenous CDH22. (k, l) Western blot of hypoxia-inducible factor-2α protein in lysates of spheroids from (i) (k) and j (l). (m, n) Spheroid migration assay (m) and three-dimensional (3D) spheroid invasion assay (n) of spheroids composed of cells stably expressing exogenous CDH22. (o) Percent increase in spheroid area (invasion) in 3D invasion assay of spheroids stably expressing exogenous CDH22 compared with controls stably expressing non-targeting shRNA. Data are presented as mean ±s.e.m., n ≥3, ***P<0.001, using a one-way ANOVA followed by Tukey’s HSD test. Scale bar, 100 μm.

Similar articles

Cited by

References

    1. Gebauer F, Hentze MW. Molecular mechanisms of translational control. Nat Rev Mol Cell Biol. 2004;5:827–835. - PMC - PubMed
    1. Lin TA, Kong X, Haystead TA, Pause A, Belsham G, Sonenberg N, et al. PHAS-I as a link between mitogen-activated protein kinase and translation initiation. Science. 1994;266:653–656. - PubMed
    1. Uniacke J, Holterman CE, Lachance G, Franovic A, Jacob MD, Fabian MR, et al. An oxygen-regulated switch in the protein synthesis machinery. Nature. 2012;486:126–129. - PMC - PubMed
    1. Ho JJ, Wang M, Audas TE, Kwon D, Carlsson SK, Timpano S, et al. Systemic reprogramming of translation efficiencies on oxygen stimulus. Cell Rep. 2016;14:1293–1300. - PMC - PubMed
    1. Rom E, Kim HC, Gingras AC, Marcotrigiano J, Favre D, Olsen H, et al. Cloning and characterization of 4EHP, a novel mammalian eIF4E-related cap-binding protein. J Biol Chem. 1998;273:13104–13109. - PubMed

Publication types

MeSH terms

LinkOut - more resources