. 2017 Dec;13(12):1222-1231.
doi: 10.1038/nchembio.2489. Epub 2017 Oct 9.

Polypharmacology-based ceritinib repurposing using integrated functional proteomics

Affiliations

Polypharmacology-based ceritinib repurposing using integrated functional proteomics

Brent M Kuenzi et al. Nat Chem Biol. 2017 Dec.

Abstract

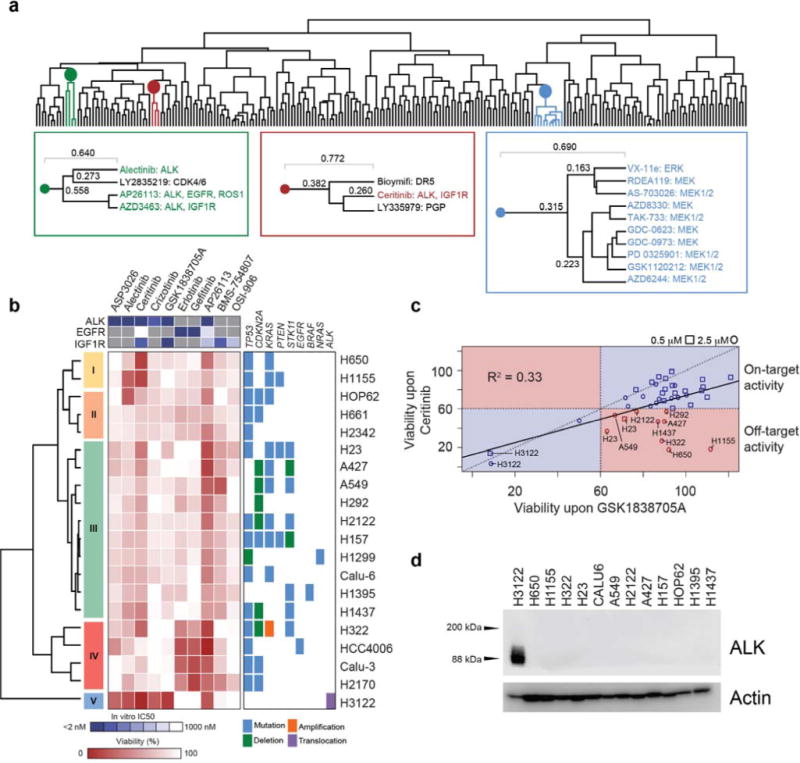
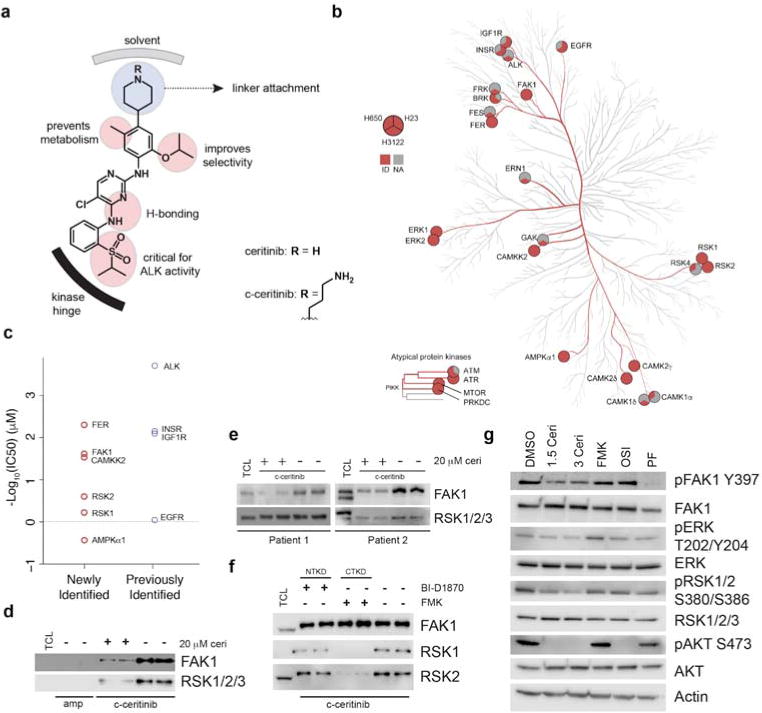
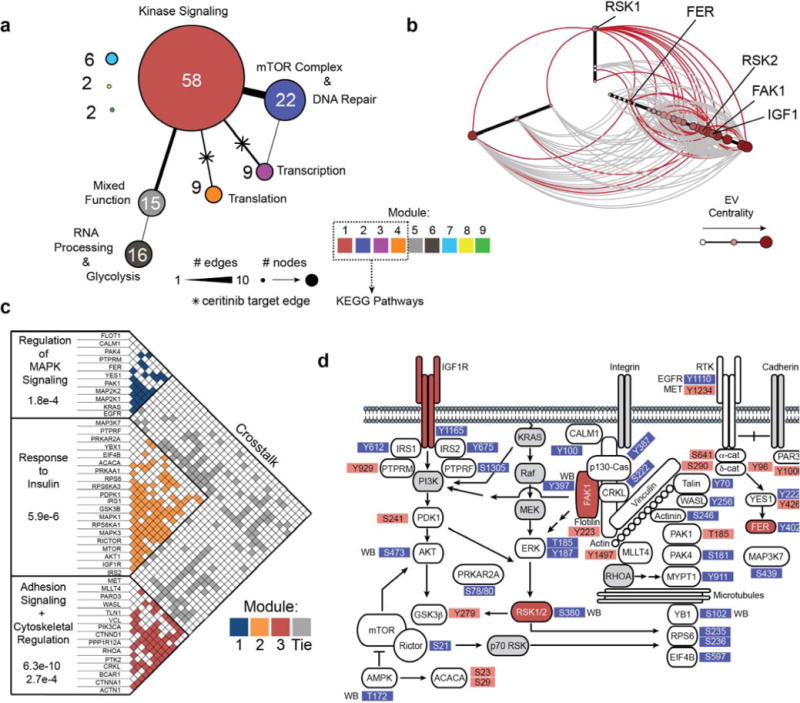
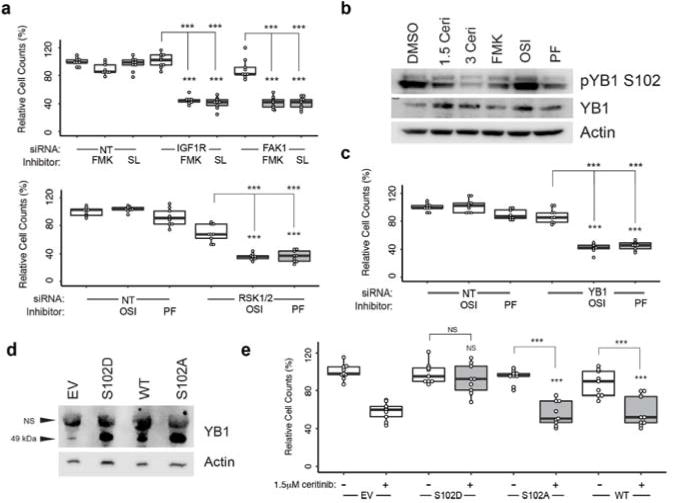
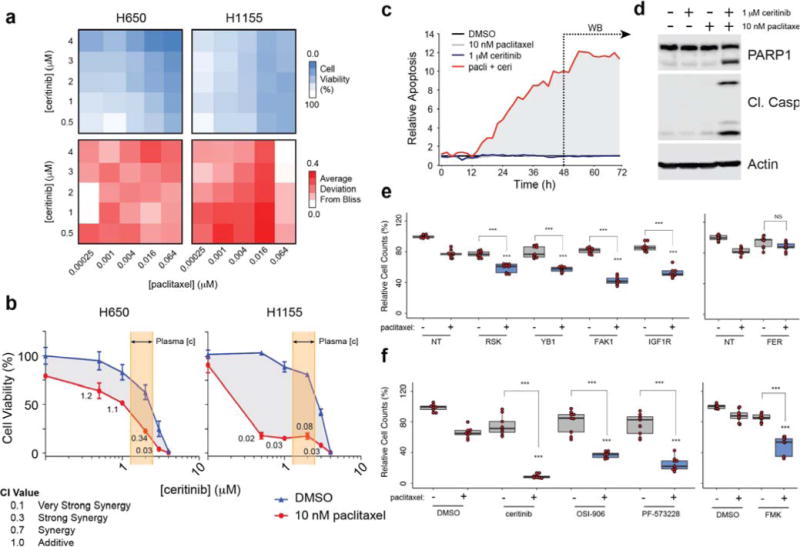
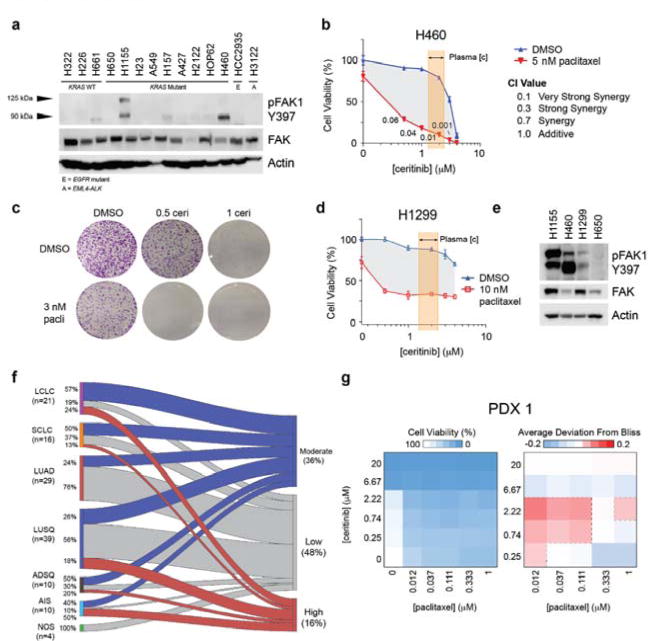
Targeted drugs are effective when they directly inhibit strong disease drivers, but only a small fraction of diseases feature defined actionable drivers. Alternatively, network-based approaches can uncover new therapeutic opportunities. Applying an integrated phenotypic screening, chemical and phosphoproteomics strategy, here we describe the anaplastic lymphoma kinase (ALK) inhibitor ceritinib as having activity across several ALK-negative lung cancer cell lines and identify new targets and network-wide signaling effects. Combining pharmacological inhibitors and RNA interference revealed a polypharmacology mechanism involving the noncanonical targets IGF1R, FAK1, RSK1 and RSK2. Mutating the downstream signaling hub YB1 protected cells from ceritinib. Consistent with YB1 signaling being known to cause taxol resistance, combination of ceritinib with paclitaxel displayed strong synergy, particularly in cells expressing high FAK autophosphorylation, which we show to be prevalent in lung cancer. Together, we present a systems chemical biology platform for elucidating multikinase inhibitor polypharmacology mechanisms, subsequent design of synergistic drug combinations, and identification of mechanistic biomarker candidates.


Conflict of interest statement

Competing Financial Interests

The authors declare no competing financial interests.

Figures

Figure 1
Figure 1. Ceritinib has beneficial off-target activity in ALK-negative NSCLC cells
(a) Dendrogram from unsupervised hierarchical clustering of the phenotypic drug screen of 240 compounds in 20 NSCLC cell lines. Cells were treated for 72 h at 0.5 μM and 2.5 μM of each compound in biological duplicate and viability was determined using CellTiterGlo. Colors highlight individual clusters. Left box (green) highlights ALK inhibitor cluster, middle box (red) shows ceritinib cluster, right box (blue) highlights MAPK pathway inhibitor cluster. (b) Subset of drug screening data containing ALK, IGF1R and EGFR inhibitors at 2.5 μM. Points reflect the mean of two biological replicates. Individual clusters were manually chosen and numbered. Right box represents accompanying mutational data for these cell lines. The top box shows the in vitro IC50 values for these drugs against ALK, EGFR and IGF1R. (c) Correlation of relative cell viability values for all cell lines for ceritinib and GSK1838705A. Cell lines highlighted in red represent cell lines displaying off-target activity with < 60% viability with ceritinib treatment and > 60% viability with GSK1838705A treatment. (d) Western blot of ALK across 13 cell lines (n = 2). For full gel images see Supplementary Figure 9.
Figure 2
Figure 2. Ceritinib inhibits multiple previously unknown targets including FAK1, RSK1/2, FER and CAMKK2
(a) Ceritinib modification strategy. Amino-propyl linker is attached to terminal piperidine moiety. (b) Kinome tree representing kinases identified in chemical proteomics experiments with > 2 exclusive unique spectra. Circles consist of 3 sections representing identification in H650, H23, and H3122 cells, respectively. Kinase phylogenetic tree adapted courtesy of Cell Signaling Technology, Inc. (www.cellsignal.com). (c) Average in vitro IC50 values for newly identified and previously known targets of ceritinib identified in chemical proteomics experiments. Average is reflective of mean of the combined Reaction Biology (technical duplicate) and Eurofins (technical duplicate) datasets. (d) Western blot of eluates from c-ceritinib pulldowns in H650 cells ± 20 μM unmodified ceritinib (n = 2). Ceritinib is able to compete FAK1 and RSK1/2/3 from the affinity matrix. TCL = total cell lysate, ceri = ceritinib, amp = ampicillin. (e) Western blot of eluates from c-ceritinib pulldowns in 2 lung cancer patient samples performed in biological duplicate. (f) Western blot of eluates from c-ceritinib pulldowns in H650 cells ± 20 μM BI-D1870 or FMK. Biological duplicates are displayed (n = 2). CTKD = C-terminal kinase domain, NTKD = N-terminal kinase domain. (g) Western blot of ceritinib targets and downstream signals following 3 h treatment in H23 cells (n = 3). Ceri = ceritinib, FMK = 20 μM FMK, OSI = 1.5 μM OSI-906, PF = 1.5 μM PF-573228. For full gel images see Supplementary Figure 9.
Figure 3
Figure 3. Integrated analysis of chemical and phosphoproteomics data sets
(a) Reduced view of the resulting network from merging kinases identified in chemical proteomics with altered phosphoproteins. Edges were queried using STRING. Colors represent community modules. Edge and node size represent the number of connecting edges between modules and number of nodes within a module. Biological function annotations were assigned based on manual inspection. (b) Hive plot of proteins in adherens junction, insulin, mTOR, focal adhesion and KRAS pathways. Red edges represent edges connected to ceritinib targets. Node size, color and position on axes represent eigenvector centrality. (c) Adjacency matrix of network represented in (b). Box color represent edges within optimal community modules. Gray boxes represent edges linking separate modules. Biological processes were queried from GeneGO. (d) Simplified topological pathway map of ceritinib-modulated network. Ceritinib targets are highlighted in red. Grey nodes were not observed, but manually added to complement signaling pathway connectivity. Red phosphosites were upregulated and blue phosphosites were downregulated following ceritinib treatment. WB = identified by Western blotting.
Figure 4
Figure 4. Ceritinib inhibits cell viability through inhibition of IGF1R, FAK1, RSK1 and RSK2
(a) Relative cell counts following 96 h knockdown of IGF1R or PTK2 and 72 h treatment with 20 μM of FMK or SL0101, or knockdown of RPS6KA1/3 and treatment with 1.5 μM OSI-906 or PF-573228 in H650 cells. Data is reflective of biological triplicates each performed in technical triplicate (median ± SD). Knockdown efficiencies were determined by immunoblotting (Supplementary Figure 5c). (b) Immunoblot of YB1 phosphorylation following 3 h of treatment. FMK = 20 μM, OSI = 1.5 μM OSI-906, PF = 1.5 μM PF-573228. (c) Relative cell counts following 96 h knockdown of YBX1 and 72 h treatment with 1.5 μM OSI-906 or 1.5 μM PF-573228 in H650 cells. Data is reflective of biological triplicates each performed in technical triplicate (median ± SD). Knockdown efficiencies were determined by immunoblotting (Supplementary Figure 5j). (d) Western blot of YB1 levels following overexpression of YB1 WT, as well as S102D and S102A mutants. EV = empty vector, NS: non-specific, WT: wild-type. (n = 2) (e) Relative cell counts following 96 h overexpression of YB1 WT, YB1 S102D and YB1 S102A and 72 h treatment with 1.5 μM ceritinib. Data is reflective of biological triplicates each performed in technical triplicate (median ± SD). Asterisks indicate p-value cut-offs (* : 0.05; **: 0.01; *** : 0.001) from Wilcoxon Rank Sum test. Asterisks without bars indicate comparison to NT/EV. For full gel images see Supplementary Figure 9.
Figure 5
Figure 5. Ceritinib strongly synergizes with the microtubule inhibitor paclitaxel
(a) Heatmap of cell viability (top) and deviation from Bliss (bottom) in H650 and H1155 cells following 72 h treatment with ceritinib and paclitaxel. (n = 3) (b) Dose response curve of ceritinib ± paclitaxel in H650 and H1155 cells (n = 3, SD). CI values were calculated using CompuSyn. Highlighted area reflects reported ceritinib concentration range in patient plasma. (c) Relative apoptosis following treatment at the indicated concentrations of ceritinib and paclitaxel as determined by caspase 3/7 cleavage (n = 3). Data were recorded every 2 h for 72 h using an Incucyte Live Cell Analysis System. (d) Western blot of PARP1 and cleaved caspase 3 following 48 h of treatment (n = 3). (e) Relative cell count following 96 h siRNA mediated knockdown of RPS6KA1/3, YBX1, PTK2, IGF1R, or FER and 72 h treatment with 10 nM paclitaxel in H1155 cells. Data is reflective of biological and technical triplicate (median ± SD). (f) Relative cell viability following 72 h co-treatment with 1.5 μM ceritinib, 1.5 μM OSI-906, 1.5 μM PF-573228, or 20 μM FMK with 10 nM paclitaxel. Data is reflective of biological triplicates each performed in technical triplicate (median ± SD). All samples received the same overall amount of DMSO and RNA. Asterisks indicate p-value cut-offs (* : 0.05; ** : 0.01; *** : 0.001) from Wilcoxon Rank Sum test. Asterisks without bars indicate comparison to NT/DMSO + paclitaxel. For full gel images see Supplementary Figure 9.
Figure 6
Figure 6. FAK1 autophosphorylation may be predictive of synergistic response to ceritinib and paclitaxel
(a) Western blot of pFAK1 Y397 and FAK1 across 14 cell lines with indicated genetic status (WT: wild-type; E: EGFR-mutant; A: EML4-ALK translocation) (n = 4) (b) Dose response curves of ceritinib ± paclitaxel in H460 cells (n = 3, SD). CI values were calculated using CompuSyn. Highlighted area reflects reported maximum range of ceritinib concentration in patient plasma (1.4 – 2.3 μM). (c) Crystal violet stain of clonogenic assay for H460 cells following 7 days of ceritinib and paclitaxel treatment at the indicated concentrations (μM) (n = 3). (d) Dose response curves of ceritinib ± paclitaxel in H1299 cells (n = 3, SD). (e) Western blot of pFAK1 in H1155, H460, H1299 and H650 cells (n = 3). (f) Sankey diagram of pFAK1 staining across lung tumor histologies for TMA1 and TMA2. Chord area is proportional to the number of tumors. Percentage of each tumor type is represented on the left. (g) Heatmap of cell viability (left) and deviation from Bliss (right) in PDX1 tumors grown in 3D ex vivo culture following treatment with ceritinib and paclitaxel at the indicated concentrations (n = 2). LCLC = large cell lung carcinoma, SCLC = small cell lung carcinoma, LUAD = lung adenocarcinoma, LUSQ = lung squamous cell carcinoma, ADSQ = adenosquamous carcinoma, AIS = adenocarcinoma in situ, NOS = not otherwise specified. For full gel images see Supplementary Figure 9.

Comment in

References

    1. Sawyers CL, et al. Imatinib induces hematologic and cytogenetic responses in patients with chronic myelogenous leukemia in myeloid blast crisis: results of a phase II study. Blood. 2002;99:3530–3539. - PubMed
    1. Kwak EL, et al. Anaplastic lymphoma kinase inhibition in non-small-cell lung cancer. N Engl J Med. 2010;363:1693–1703. - PMC - PubMed
    1. Flanagan ME, et al. Discovery of CP-690,550: a potent and selective Janus kinase (JAK) inhibitor for the treatment of autoimmune diseases and organ transplant rejection. J Med Chem. 2010;53:8468–8484. - PubMed
    1. Palla G, Derényi I, Farkas I, Vicsek T. Uncovering the overlapping community structure of complex networks in nature and society. Nature. 2005;435:814–818. - PubMed
    1. Farkas IJ, et al. Network-Based Tools for the Identification of Novel Drug Targets. Sci Signal. 2011;4:pt3–pt3. - PubMed

MeSH terms