. 2017 Nov;49(11):1567-1575.
doi: 10.1038/ng.3967. Epub 2017 Oct 9.

Patient-derived xenografts undergo mouse-specific tumor evolution

Affiliations

Patient-derived xenografts undergo mouse-specific tumor evolution

Uri Ben-David et al. Nat Genet. 2017 Nov.

Abstract

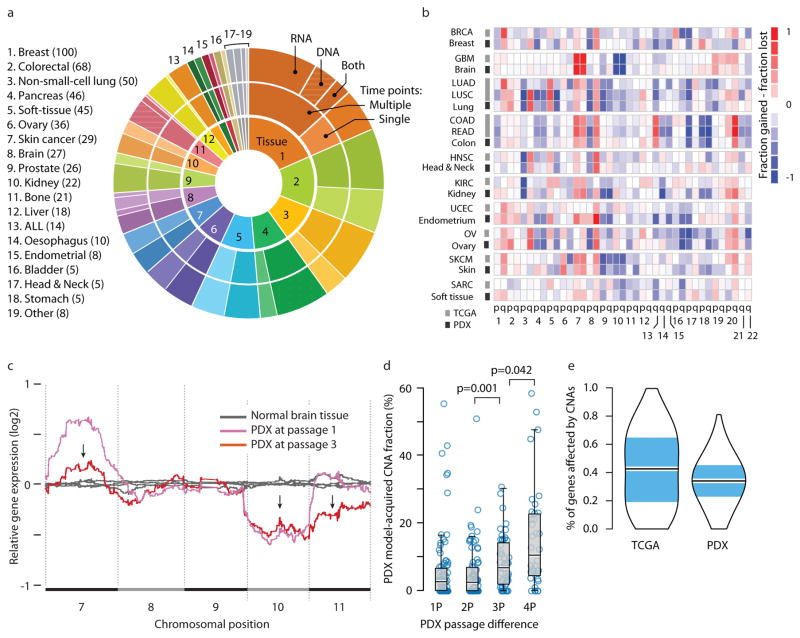
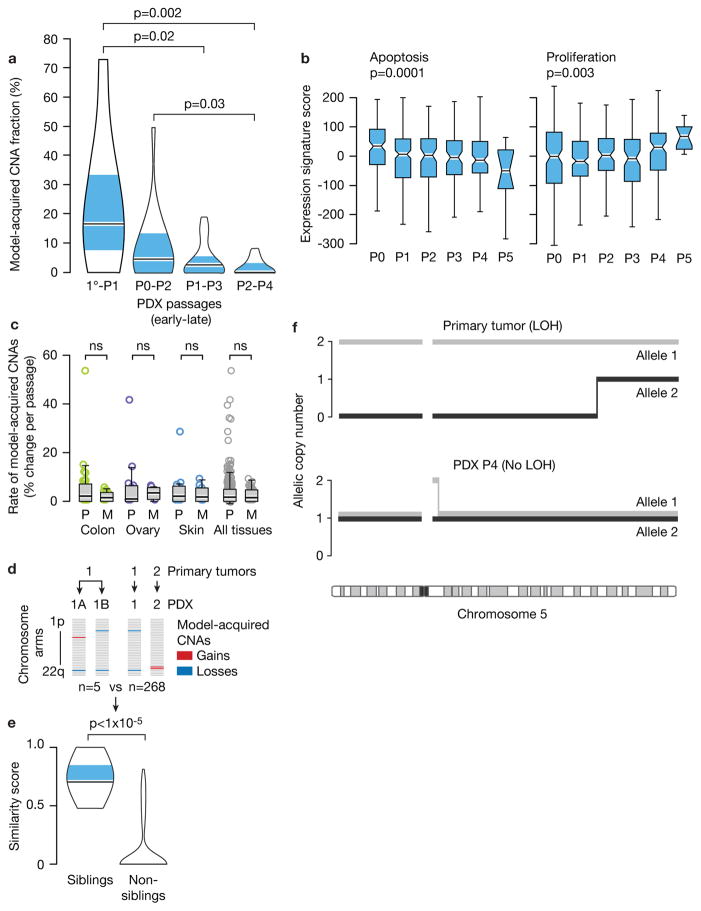
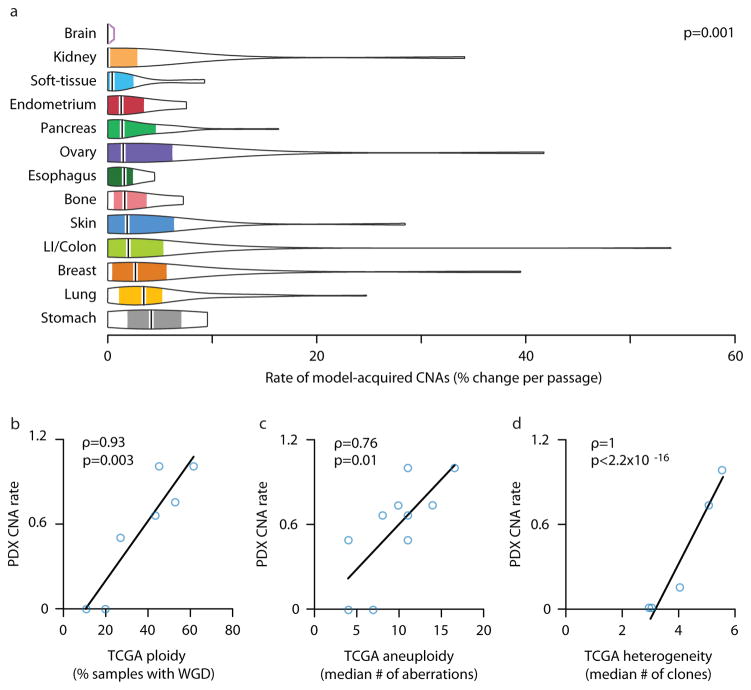
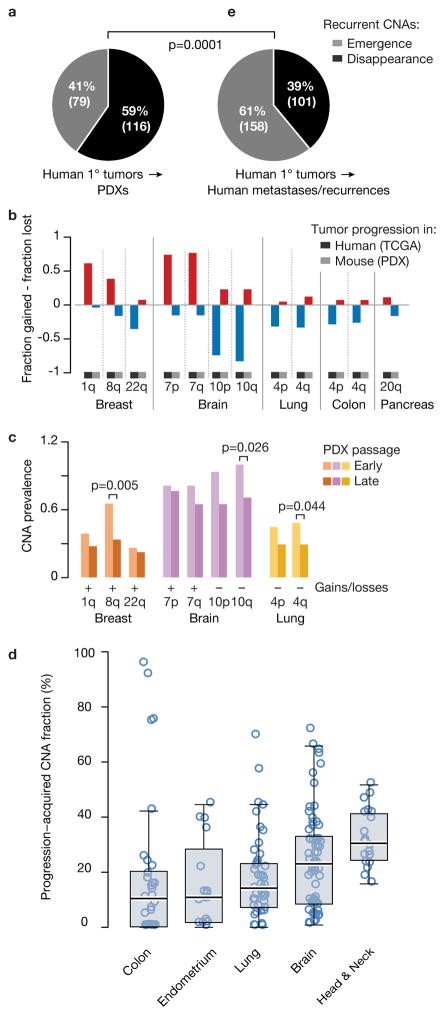
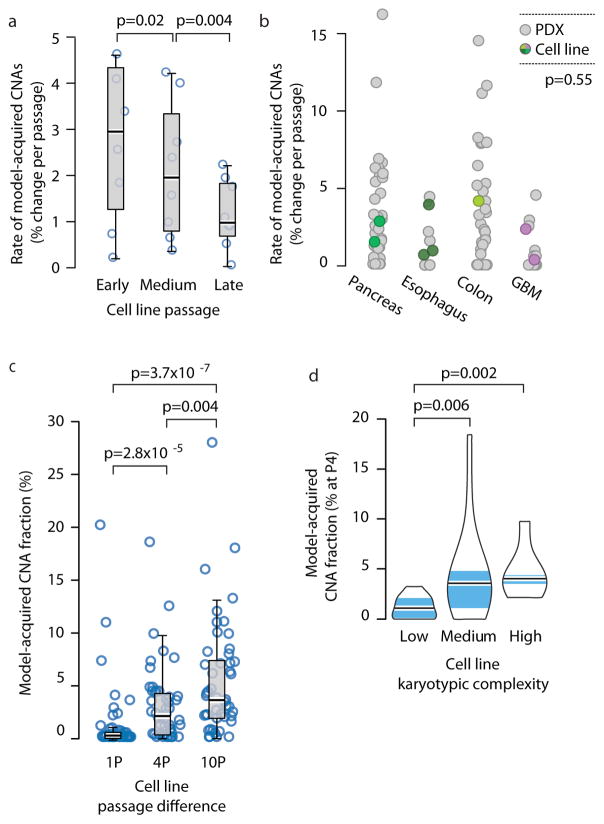
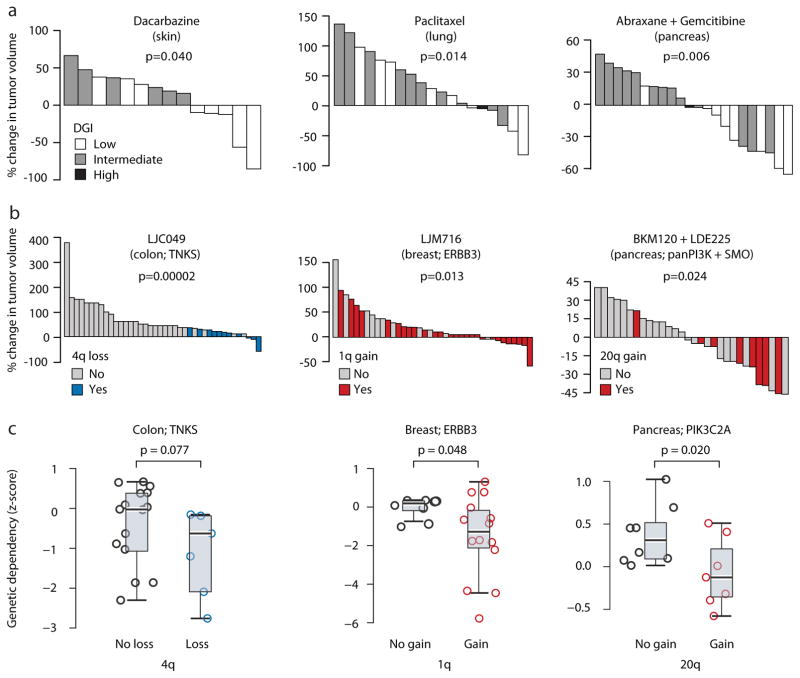
Patient-derived xenografts (PDXs) have become a prominent cancer model system, as they are presumed to faithfully represent the genomic features of primary tumors. Here we monitored the dynamics of copy number alterations (CNAs) in 1,110 PDX samples across 24 cancer types. We observed rapid accumulation of CNAs during PDX passaging, often due to selection of preexisting minor clones. CNA acquisition in PDXs was correlated with the tissue-specific levels of aneuploidy and genetic heterogeneity observed in primary tumors. However, the particular CNAs acquired during PDX passaging differed from those acquired during tumor evolution in patients. Several CNAs recurrently observed in primary tumors gradually disappeared in PDXs, indicating that events undergoing positive selection in humans can become dispensable during propagation in mice. Notably, the genomic stability of PDXs was associated with their response to chemotherapy and targeted drugs. These findings have major implications for PDX-based modeling of human cancer.


Conflict of interest statement

Competing financial interests

The authors declare no competing financial interests.

Figures

Figure 1
Figure 1. The landscape of aneuploidy and copy number alterations in PDXs
(a) Distribution of cancer types in our PDX dataset (n=543 unique models). In the inner circle models are divided by their lineage: each cancer type is denoted by a color and a number. In the middle circle models are divided by the number of time points analyzed: multiple time points are denoted by a darker color, and enable to follow PDX evolution throughout in vivo propagation. In the outer circle models are divided by the biological material from which CNAs were inferred: DNA (stripes), RNA (dots) or both (stripes and dots). (b) A heatmap comparing the landscapes of lineage-matched arm-level CNAs of PDXs and of primary TCGA tumors, showing an overall high degree of concordance (mean Pearson’s r = 0.79). The color of each chromosome arm represents the fraction difference between gains and losses of that arm. (c) A representative example of PDX model evolution. Shown are gene expression moving average plots of normal brain tissue (gray), GBM PDX model at p1 (pink) and GBM model at p3 (red), revealing the disappearance of trisomy 7, the retention of monosomy 10, and the emergence of monosomy 11, within two in vivo passages. (d) Gradual evolution of CNA landscapes throughout PDX passaging. Box plots present model-acquired CNA fraction as a function of the number of passages between measurements. Bar, median; box, 25th and 75th percentiles; whiskers, data within 1.5*IQR of lower or upper quartile; circles: all data points. P-values indicate significance from a Wilcoxon rank-sum test. (e) Violin plots present the proportion of genes affected by CNAs in TCGA and in PDX tumor samples (all tissue types combined), showing an overall similarity between both datasets. Bar, median; colored rectangle, 25th and 75th percentiles; width of the violin indicates frequency at that CNA fraction level.
Figure 2
Figure 2. Selection of pre-existing subclones underlies CNA dynamics
(a). The rate of model-acquired CNAs decreases with PDX passaging. Violin plots present the fraction of CNAs acquired within two in vivo passages as a function of passage number. P-value indicates significance from a Wilcoxon rank-sum test. 1°, primary tumor. (b) Apoptosis decreases and proliferation increases with PDX passaging. Box plots present the apoptosis (left panel) and proliferation (right panel) gene expression signature scores as a function of passage number. P-values indicate significance from a Kruskal-Wallis test. (c) Similar CNA acquisition rates in PDXs from primary tumors and from metastases. Box plots present the rate of model-acquired CNAs as a function of tumor source (P=primary, M=metastasis), across three available tissue types. n.s., non-significant (Wilcoxon rank-sum test). (d) Schematics showing the calculation of pair-wise similarity scores for PDX models coming from the same primary tumor but propagated independently in the mouse (“sibling” PDXs; n=5) and for PDX models coming from distinct primary tumors (“non-sibling” PDXs; n=268). (e) “Sibling” PDXs tend to acquire more similar aberrations than lineage-matched “non-sibling” PDXs. Violin plots present the similarity scores of “sibling” and “non-sibling” PDXs. P-value indicates significance from a lineage-controlled permutation test. (f) Alleles that seem to have been lost in primary tumors can “re-appear” in PDXs, demonstrating expansion of rare pre-existing subclones throughout PDX propagation. Plots present the copy number of both of chromosome 5 alleles in a primary tumor and its derived PDX. Loss of heterozygosity (LOH) is identified in the primary tumor along most of chromosome 5, but both alleles are detected in a 1:1 ratio in the PDX derived from that primary tumor.
Figure 3
Figure 3. Genomic instability of PDXs mirrors that of primary tumors
(a) The degree of genomic instability (DGI) of PDXs is cancer type-specific. Violin plots present the rate of CNA acquisition throughout PDX propagation of 13 cancer types, for which data were available from at least three PDX models. P-value indicates significance from a Wilcoxon rank-sum test. (b) The DGI of PDXs and that of primary tumors correlate extremely well. In PDXs, tissue DGI was defined as the median number of CNAs per passage. In TCGA tumors, tissue DGI was defined as the fraction of samples with whole-genome duplication (WGD). (c) This correlation holds when the tissue DGI is defined, both for PDXs and for TCGA tumors, by the median number of arm-level CNAs. (d) The DGI of PDXs also correlates extremely well with intra-tumor heterogeneity (ITH) of primary tumors (excluding the skin tissue). The DGI of PDXs was defined as the median number of arm-level CNAs per passage. The heterogeneity of primary tumors was defined as the median number of clones per tumor. Spearman’s rho values and p-values indicate the strength and significance of the correlations, respectively.
Figure 4
Figure 4. Tumor evolution of PDXs diverges from that of primary tumors
(a) Recurrent arm-level TCGA CNAs tend to disappear throughout PDX passaging. Pie chart presents the number of model-acquired events that were in the opposite direction to the recurrent TCGA CNAs vs. the number of events in the same direction. (b) Opposite propensities to gains and losses in human tumors and PDX models. Bar plots present the fraction difference between gains and losses of 12 recurrent TCGA arm-level CNAs. The PDX fractions represent the model-acquired CNAs, rather than the absolute prevalence of these events. (c) Recurrent TCGA arm-level CNAs are more common in early passage PDXs than in late passage PDXs. Bar plots present the absolute prevalence of each event in the relevant cancer type. P-values indicate significance from a Fisher’s exact test. (d) Evolution of CNA landscapes during tumor progression to advanced disease. Box plots present progression-acquired CNA fraction in the five tumor types analyzed. Bar, median; box, 25th and 75th percentiles; whiskers, data within 1.5*IQR of lower or upper quartile; circles: all data points. (e) Recurrent arm-level TCGA CNAs tend to emerge throughout tumor progression in patients. Pie chart presents the number of progression-acquired events that were in the opposite direction to the recurrent TCGA CNAs vs. the number of events in the same direction. P-value indicates significance from a Chi-squared test.
Figure 5
Figure 5. Genomic instability of PDXs is comparable to that of cell lines and CLDXs
(a) The rate of CNA acquisition decreases with cell line passaging. Box plots present the rate of CNA acquisition as a function of in vitro passage number. P-values indicate significance from a Wilcoxon rank-sum test. (b) Similar rates of CNA acquisition in PDXs and in newly-derived cell lines. Dot plots present the distribution of model-acquired CNA rates across four available cancer types. P-value indicates lack of significance from a lineage-controlled permutation test. (c) Gradual evolution of CNA landscapes throughout CLDX passaging. Box plots present model-acquired CNA fraction as a function of the number of passages between measurements. P-values indicate significance from a Wilcoxon rank-sum test. (d) The CNA acquisition rate of CLDXs is associated with the numerical karyotypic complexity of the parental cell lines. Violin plots present the fraction of CNAs acquired by passage 4 as a function of numerical karyotypic complexity. P-values indicate significance from a Wilcoxon rank-sum test.
Figure 6
Figure 6. CNA dynamics affect PDX drug response
(a) Extreme levels of genomic instability are associated with better therapeutic response to chemotherapies. Waterfall plots present the response to dacarbazine (n=14), paclitaxel (n=19), and the combination of abraxane and gemcitabine (n=22) in skin, lung and pancreas PDXs, respectively. DGI, degree of genomic instability. P-values indicate significance from a Wilcoxon rank-sum test. (b) The status of recurrent arm-level CNAs is associated with response to targeted therapies. Waterfall plots present the response to the TNKS inhibitor LCJ049 (n=40), the ERBB3 inhibitor LJM716 (n=38), and the combination of the PI3K inhibitor BKM120 and the SMO inhibitor LDE225 (n=31). P-values indicate significance from a Wilcoxon rank-sum test. (c). The status of recurrent arm-level CNAs is associated with the genetic depletion of the genes targeted by the identified drugs. Box plots present the dependency scores to RNAi-mediated knockdown of the indicated genes. Colon cancer cell lines with chromosome 4q loss are more sensitive to knockdown of TNKS, breast cancer cell lines with chromosome 1q gain are more sensitive to knockdown of ERBB3, and pancreatic cancer cell lines with chromosome 20q are more sensitive to knockdown of multiple PI3K genes, including PIK3C2A. P-values indicate significance from a Wilcoxon rank-sum test. -

Similar articles

Cited by

References

    1. Tentler JJ, et al. Patient-derived tumour xenografts as models for oncology drug development. Nature reviews. Clinical Oncol. 2012;9:338–350. doi: 10.1038/nrclinonc.2012.61. - DOI - PMC - PubMed
    1. Siolas D, Hannon GJ. Patient-derived tumor xenografts: transforming clinical samples into mouse models. Cancer Res. 2013;73:5315–5319. doi: 10.1158/0008-5472.CAN-13-1069. - DOI - PMC - PubMed
    1. Gao H, et al. High-throughput screening using patient-derived tumor xenografts to predict clinical trial drug response. Nat Med. 2015;21:1318–1325. doi: 10.1038/nm.3954. - DOI - PubMed
    1. Hidalgo M, et al. Patient-derived xenograft models: an emerging platform for translational cancer research. Cancer Discov. 2014;4:998–1013. doi: 10.1158/2159-8290.CD-14-0001. - DOI - PMC - PubMed
    1. Zhang X, et al. A renewable tissue resource of phenotypically stable, biologically and ethnically diverse, patient-derived human breast cancer xenograft models. Cancer Res. 2013;73:4885–4897. doi: 10.1158/0008-5472.CAN-12-4081. - DOI - PMC - PubMed

MeSH terms