. 2017 Nov;24(11):931-943.
doi: 10.1038/nsmb.3483. Epub 2017 Oct 9.

A structural model for microtubule minus-end recognition and protection by CAMSAP proteins

Affiliations

A structural model for microtubule minus-end recognition and protection by CAMSAP proteins

Joseph Atherton et al. Nat Struct Mol Biol. 2017 Nov.

Erratum in

Abstract

CAMSAP and Patronin family members regulate microtubule minus-end stability and localization and thus organize noncentrosomal microtubule networks, which are essential for cell division, polarization and differentiation. Here, we found that the CAMSAP C-terminal CKK domain is widely present among eukaryotes and autonomously recognizes microtubule minus ends. Through a combination of structural approaches, we uncovered how mammalian CKK binds between two tubulin dimers at the interprotofilament interface on the outer microtubule surface. In vitro reconstitution assays combined with high-resolution fluorescence microscopy and cryo-electron tomography suggested that CKK preferentially associates with the transition zone between curved protofilaments and the regular microtubule lattice. We propose that minus-end-specific features of the interprotofilament interface at this site serve as the basis for CKK's minus-end preference. The steric clash between microtubule-bound CKK and kinesin motors explains how CKK protects microtubule minus ends against kinesin-13-induced depolymerization and thus controls the stability of free microtubule minus ends.


Conflict of interest statement

The authors have no competing financial interests.

Figures

Figure 1.
Figure 1.. The CKK is a highly conserved MT minus-end tracking domain.
(a) Schematic of the CAMSAP1 domain organization and the constructs used. (b-f) Total Internal Reflection Fluorescence Microscopy (TIRFM) images, corresponding kymographs and quantification of localization of GFP-CAMSAP1 fragments to MT minus ends and lattice. The intensity is normalized to the average minus-end intensity of the C4 fragment. Scale bars, vertical 2 min; horizontal 2 µm. Data represent mean ± SD. (d, f), n=30 MTs. (g) TIRFM images and kymographs of GFP-tagged CKK domains from human (CAMSAP1), fly (D. melanogaster), worm (C. elegans), T. thermophila and T. vaginalis. Scale bars: horizontal, 1 μm; vertical, 30 sec. See also Supplementary Fig.1 and 2, and Supplementary Table 2.
Figure 2.
Figure 2.. The unique MT binding site of CAMSAP CKK domains.
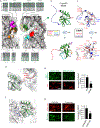
(a) Fourier filtered images of 13pf MTs. Left, filtering of a CAMSAP3-CKK decorated 13pf MT shows density corresponding to the CAMSAP3 CKK domain every tubulin dimer; centre, filtering highlights the MT moiré pattern and the presence of protofilament skew. Right, filtering of a kinesin-1 decorated 13pf MT highlights a comparative lack of skew. (b) Schematic of three sets of three protofilaments depicting the skew detected in the CKK 13pf MT data sets (left) compared to kinesin-bound 13pf (middle) and 14pf paclitaxel-stabilized MTs (right). Skew angle size is exaggerated here for ease of depiction. (c) The asymmetric reconstruction of the CAMSAP3-CKK decorated 13pf paclitaxel-stabilized MT low-pass filtered to 15Å resolution shows extra densities (green) every 8nm corresponding to the CAMSAP3-CKK domain, which are absent at the seam (arrow). (d) The averaged reconstruction of the CAMSAP3-CKK domain viewed from the MT surface contacting two β-tubulins and two α-tubulins at the intra-dimer, inter-protofilament interface. The CKK is colored as in X-ray structure figure (see Supplementary Fig. 3) except for the N-terminus (red) and loop1 (magenta) that are missing in our crystal structure but visible in our EM density. α-tubulin is shown in light grey and β-tubulin is shown in dark grey. Above, schematic. (e) The averaged reconstruction of the MT-bound CAMSAP3-CKK domain viewed from the MT lumen showing density corresponding to paclitaxel bound to β-tubulin (yellow). Along with the distinctive appearance of the H1-S2 and S9-S10 loops (arrowheads and arrows), this allows differentiation between β- and α-tubulin, and thus identification of the CKK binding site at the intradimer interface. Above, schematic; Ta indicates the paclitaxel binding site. See also Supplementary Fig. 3 and 4.
Figure 3.
Figure 3.. The interaction with four tubulin monomers is distributed across the CKK domain.
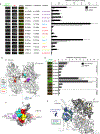
(a) CKK interaction surface of the MT with cryo-EM density colored according to CKK contacts (<6Å distance, coloring consistent with Fig. 2d). Sequence alignments for contact regions in β-tubulin (top) and α-tubulin (bottom) indicate sequence differences between human α1a tubulin and β3 tubulins (*) that could contribute to CKK binding the intra- vs the inter-dimer site. Comparison between H. sapiens β3 tubulin, α1a tubulin (most common isoforms in mammalian brain), C. elegans (β1 tubulin, α3 tubulin), D. melanogaster (β1 tubulin, α at 84B tubulin). Residues contacting the CKK are within green boundaries. (b) 180° rotations of the CKK domain with loop coloring referring to MT contact sites in panel a. (c) CKK views as (b), showing ssNMR data on [13C,15N] labeled CKK decorated MTs relative to free CKK. Red: residues with significant chemical-shift or intensity changes, blue: no change. White: not analysed. The unresolved N- and C-termini are represented as dashed lines with each dash depicting a single residue. (d) CAMSAP3-CKK-MT cryo-EM density at lower threshold shows the CKK N-terminus. (e) TIRFM experiments show the importance of CKK N-terminal extension in MT binding. Intensity normalized to average CKK lattice intensity. Scale bar, 2 μm. CKK, n=104 MTs; CKKΔN, n=118. Data represent mean ± SD. ***, p<0.001, two-tailed Mann-Whitney U test. (f) CAMSAP3-CKK-MT cryo-EM density that likely corresponds to interaction between the CKK flexible C-terminus (blue dotted line) and β-tubulin C-terminus (grey dotted line), not usually seen in MT reconstructions. (g). X-Rhodamine labeled paclitaxel-stabilized MTs (red), either untreated or treated with subtilisin to remove their C-terminal tails, incubated with 200 nM GFP-CAMSAP3-CKK and imaged using TIRFM. Scale bar, 4 μm. The intensity of MT labelling, normalized to wild type, was quantified; n=100 MTs. Data represent mean ± SD. ***, p<0.001, two-tailed Mann-Whitney U test. See also Supplementary Fig. 5 and Supplementary Table 2.
Figure 4.
Figure 4.. Validation of CKK-MT contact sites using in vitro assays and structure of a mutant CKK bound to MTs.
(a) Left, TIRFM images of GFP-CAMSAP1mini wild type and mutants binding to the minus ends of dynamic MTs. The corresponding residues in CAMSAP3 and their location are indicated. Scale bar, 1 μm. Right, quantification of GFP-CAMSAP1mini intensities at MT minus ends and on MT lattice. The intensity is normalized to the average minus-end intensity of wild type. n ranged from 17 to 87 MTs; individual data points are provided in Supplementary Table 2. Data represent mean ± SD. (b) View of the CKK interaction surface of the MT cryo-EM density with mutated CKK residues mapped (<8Å distance) and colored according to the % change in minus-end fluorescence signal relative to wild type of corresponding mutants (panel a). (c) Surface representation of the tubulin-interacting face of the CAMSAP1 CKK domain. Mutated CKK residues are colored according to the % change in minus-end fluorescence signal of corresponding mutants relative to wild type in our TIRF assays (as in panel a). (d) Left, TIRFM images of GFP-CAMSAP1mini N1492 mutants; Scale bar, 1 μm. Right, quantification of GFP-CAMSAP1mini intensities at MT minus ends and on MT lattice. The intensity is normalized to the average minus-end intensity of wild type. n=30 MTs. Scale bar, 1 μm (e) The N1492A CAMSAP1 CKK binds at the intra-dimer, inter-protofilament MT binding site but in a subtly different orientation compared to wild type. Ribbon representation comparing the position of N1492A CAMSAP1 CKK with wild type CAMSAP1 CK relative to the tubulin-binding surface. N1492A CAMSAP1 CKK (shown in blue) is rotated 5° (around the indicated axis) and translated 1.9Å into the inter-protofilament binding site compared to wild type CAMSAP1 CKK (green). Arrowhead depicts position of N1492. See also Supplementary Fig. 7 and 8, and Supplementary Table 2.
Figure 5.
Figure 5.. Examining CKK’s preferred tubulin conformation.
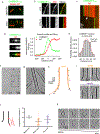
(a) TIRFM images of the minus-end localization of GFP-CAMSAP1mini on GMPCPP or taxol-stabilized MTs. Scale bar, 1 μm. (b) Kymographs showing that GFP-CAMSAP1mini tracks growing MT minus ends whether MTs are polymerized in the presence of GTP or GTPγS, while mCherry-EB3 decorates the whole lattice of GTPγS MTs. Scale bars: horizontal, 1 μm; vertical, 30 sec. (c) Kymograph showing that GFP-CAMSAP1mini tracks a growing but not a depolymerizing MT minus end (white arrow). Scale bars: horizontal, 1 μm; vertical, 5 sec. (d) A TIRFM image of Rhodamine-labeled stable GMPCPP MT and CAMSAP1mini-GFP. Normalized one-dimensional intensity profiles of CAMSAP1mini-GFP and MT and corresponding fitting of point spread function-convoluted models (see Methods for details). To reduce the error introduced by the flexible linker between CKK and GFP, GFP was inserted at the CKK C-terminus. Scale bar, 200 nm. (e) Distribution of the position of CAMSAP1mini-GFP relative to the MT minus end (mean±SEM). N=163 MTs. (f) Projection image from a cryo-ET tilt-series showing in vitro GMPCPP-MTs including several ends. The moiré patterns were used to determine MT polarity (see Supplementary Fig. 9). The black dots are gold fiducials for tilt series alignment. (g) Longitudinal slice through MTs in the tomographic volume corresponding to the boxed region in panel f. (h) 2D graphical representation of an exemplar minus end, plotting 3D pf trajectories. In this 14 pf MT, 7 pfs are plotted on either side, numbered around the circumference (pf14 is adjacent to pf1). (i) Sagittal slices through tomographic volumes showing a range of curvatures and lengths at both ends. Some pfs terminate in the lattice before curvature is observed. (j) Longitudinal curvature of ends. Only curved end regions > one dimer long are plotted. Inset; schematic of longitudinal curvature A-B. Model End (Supplementary Fig. 9c), n=14 protofilaments; Plus End, n=32 protofilaments (5 MTs), Minus End, n=38 protofilaments (5 MTs). Data represent mean ± SD. Minus End vs Plus End not significant; model vs data, statistically significant (p<0.01) Kolmogorov-Smirnov test. (k) Series of transverse sections through a MT from lattice to end. Lower panels show traced pf positions. See also Supplementary Fig. 9 and Supplementary Table 2.
Figure 6.
Figure 6.. CAMSAP CKKs protect MT minus ends from MCAK-induced depolymerization via steric inhibition.
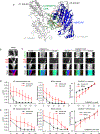
(a) A MT tubulin dimer-pair bound to CAMSAP3-CKK (green) is shown with the expected position of an MD of human MCAK (in complex with ADP; PDB ID 4UBF) by alignment with MT-bound kinesin-1 in Chimera. b) Kymographs of MT depolymerization assay with GMPCPP-stabilized MTs (blue) and GFP-MCAK (red). MT polarity was determined based on the movement of the SNAP-Alexa647-tagged plus-end directed motor kinesin-1 KIF5B (green, residues 1–560). Scale bars: horizontal, 1 μm; vertical, upper panel, 1 sec, lower panels, 1 min. c) Kymographs of MT depolymerization assays with GMPCPP-stabilized MTs (blue), GFP-MCAK (red) and different concentrations of SNAP-Alexa 647 CAMSAP1mini or CKK (green). Scale bars: horizontal, 1 μm; vertical, 1 min. In panels (b) and (c), MT minus (−) ends are shown on the left and plus (+) ends on the right. d-e) Quantification of MT depolymerization rate, MCAK intensity and CAMSAP1 intensity at different concentrations of CAMSAP1mini (d) or CKK (e). n ranged from 17 to 31 MTs; individual data points are provided in Supplementary Table 2. Data represent mean ± SD. See also Supplementary Table 2.
Figure 7.
Figure 7.. Proposed mechanisms of MT minus end binding and protection from MCAK-induced depolymerization by the CKK domain.
(a) Towards the ends of stable or growing MTs there is a transition from the regular lattice to sheet-like regions, with increasing longitudinal curvature and decreasing lateral curvature. Protofilaments retain lateral connectivity, and thus inter-protofilament CKK binding sites are preserved. Given the polar nature of MTs, these lattice-sheet transitions create unique conformations of B-lattice tubulin dimer-pairs at either end of the MT: at the minus end, α-tubulins in dimer-pairs are more flattened compared to β-tubulins, with the opposite being true at the plus end. In this way, we propose that the unique dimer-pair conformation at the minus end favors CKK binding when compared to dimer pair conformations in the lattice or at the plus end. (b) Model of minus end (-end) specific protection from MCAK-induced depolymerization by the CKK domains. CKKs (green circles) bind specifically to a curved minus end region, preventing the association of MCAK motor domains (red triangles) to the same region via steric inhibition. As the CKKs do not bind to the corresponding region of the plus end (+end), MCAK is free to bind and depolymerise from the plus end.

References

    1. Howard J & Hyman AA Dynamics and mechanics of the microtubule plus end. Nature 422, 753–758. (2003). - PubMed
    1. Akhmanova A & Steinmetz MO Control of microtubule organization and dynamics: two ends in the limelight. Nat Rev Mol Cell Biol 16, 711–726 (2015). - PubMed
    1. Dammermann A, Desai A & Oegema K The minus end in sight. Curr Biol 13, R614–624 (2003). - PubMed
    1. Akhmanova A & Hoogenraad CC Microtubule minus-end-targeting proteins. Curr Biol 25, R162–171 (2015). - PubMed
    1. Kollman JM, Merdes A, Mourey L & Agard DA Microtubule nucleation by gamma-tubulin complexes. Nat Rev Mol Cell Biol 12, 709–721 (2011). - PMC - PubMed

MeSH terms