

Pathway Analysis with Signaling Hypergraphs
- PMID: 28991726
- PMCID: PMC5810418
- DOI: 10.1109/TCBB.2015.2459681
Pathway Analysis with Signaling Hypergraphs
Abstract
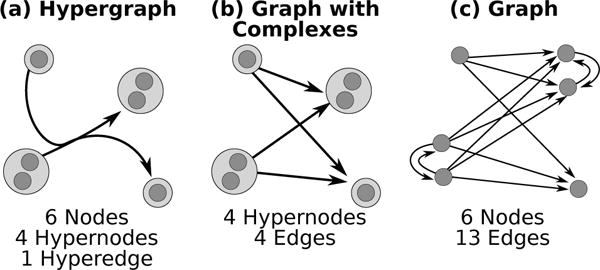
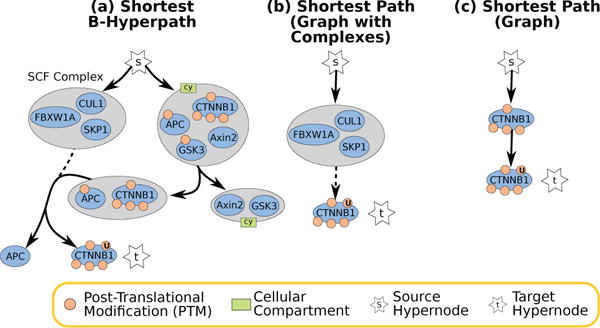
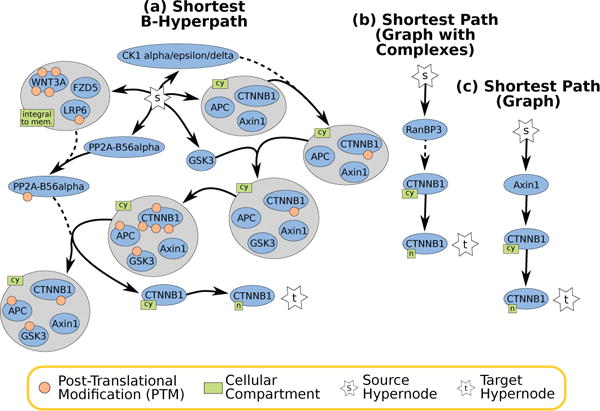
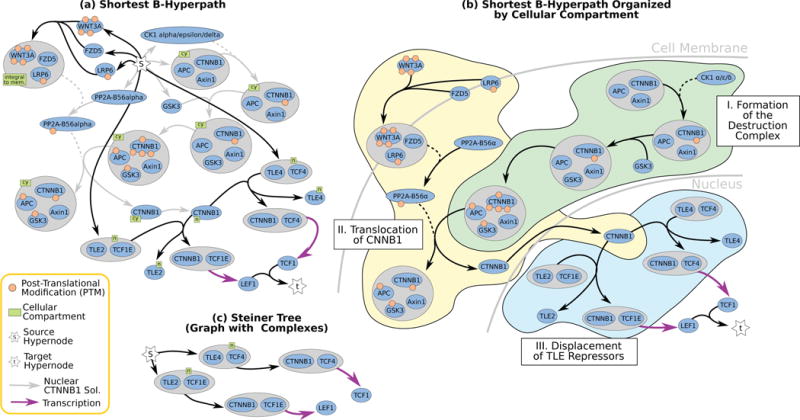
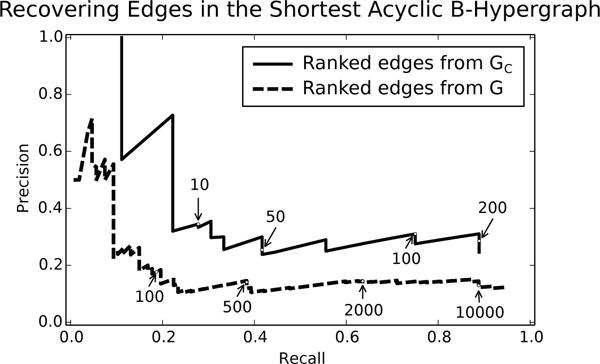
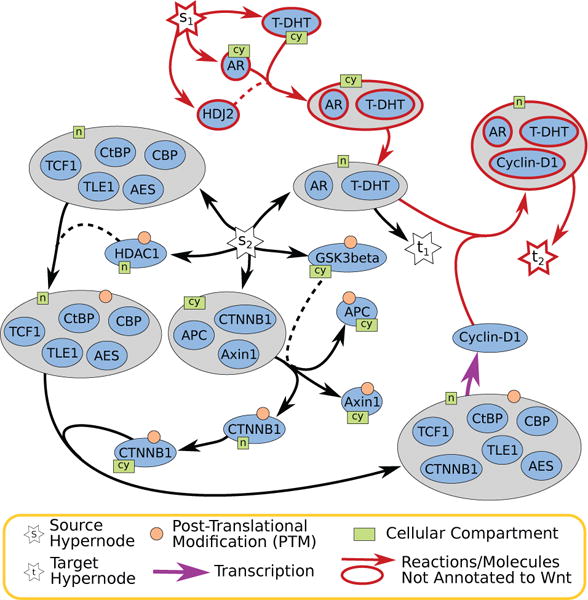
Signaling pathways play an important role in the cell's response to its environment. Signaling pathways are often represented as directed graphs, which are not adequate for modeling reactions such as complex assembly and dissociation, combinatorial regulation, and protein activation/inactivation. More accurate representations such as directed hypergraphs remain underutilized. In this paper, we present an extension of a directed hypergraph that we call a signaling hypergraph. We formulate a problem that asks what proteins and interactions must be involved in order to stimulate a specific response downstream of a signaling pathway. We relate this problem to computing the shortest acyclic B-hyperpath in a signaling hypergraph-an NP-hard problem-and present a mixed integer linear program to solve it. We demonstrate that the shortest hyperpaths computed in signaling hypergraphs are far more informative than shortest paths, Steiner trees, and subnetworks containing many short paths found in corresponding graph representations. Our results illustrate the potential of signaling hypergraphs as an improved representation of signaling pathways and motivate the development of novel hypergraph algorithms.
Figures
Similar articles
-
Heuristic shortest hyperpaths in cell signaling hypergraphs.Algorithms Mol Biol. 2022 May 26;17(1):12. doi: 10.1186/s13015-022-00217-9. Algorithms Mol Biol. 2022. PMID: 35619179 Free PMC article.
-
Shortest Hyperpaths in Directed Hypergraphs for Reaction Pathway Inference.J Comput Biol. 2023 Nov;30(11):1198-1225. doi: 10.1089/cmb.2023.0242. Epub 2023 Oct 31. J Comput Biol. 2023. PMID: 37906100
-
Modeling Cell Communication with Time-Dependent Signaling Hypergraphs.IEEE/ACM Trans Comput Biol Bioinform. 2021 May-Jun;18(3):1151-1163. doi: 10.1109/TCBB.2019.2937033. Epub 2021 Jun 3. IEEE/ACM Trans Comput Biol Bioinform. 2021. PMID: 31449029
-
Computational representation of biological systems.Methods Mol Biol. 2009;541:535-49. doi: 10.1007/978-1-59745-243-4_23. Methods Mol Biol. 2009. PMID: 19381532 Review.
-
Network-based methods for identifying critical pathways of complex diseases: a survey.Mol Biosyst. 2016 Apr;12(4):1082-9. doi: 10.1039/c5mb00815h. Epub 2016 Feb 18. Mol Biosyst. 2016. PMID: 26888073 Review.
Cited by
-
Hypergraph-based connectivity measures for signaling pathway topologies.PLoS Comput Biol. 2019 Oct 25;15(10):e1007384. doi: 10.1371/journal.pcbi.1007384. eCollection 2019 Oct. PLoS Comput Biol. 2019. PMID: 31652258 Free PMC article.
-
Computing optimal factories in metabolic networks with negative regulation.Bioinformatics. 2022 Jun 24;38(Suppl 1):i369-i377. doi: 10.1093/bioinformatics/btac231. Bioinformatics. 2022. PMID: 35758789 Free PMC article.
-
The node-weighted Steiner tree approach to identify elements of cancer-related signaling pathways.BMC Bioinformatics. 2017 Dec 28;18(Suppl 16):551. doi: 10.1186/s12859-017-1958-4. BMC Bioinformatics. 2017. PMID: 29297291 Free PMC article.
-
Heuristic shortest hyperpaths in cell signaling hypergraphs.Algorithms Mol Biol. 2022 May 26;17(1):12. doi: 10.1186/s13015-022-00217-9. Algorithms Mol Biol. 2022. PMID: 35619179 Free PMC article.
References
-
- Heath LS, Sioson AA. Semantics of multimodal network models. IEEE/ACM Transactions on Computational Biology and Bioinformatics. 2009;6(2):271–280. - PubMed
-
- Berge C. Hypergraphs, Volume 45: Combinatorics of Finite Sets. 1st. North Holland; Aug, 1989.
-
- Ritz A, Tegge AN, Kim H, Poirel CL, Murali T. Signaling hypergraphs. Trends in Biotechnology. 2014;32(7):356–362. [Online]. Available: http://dx.doi.org/10.1016/j.tibtech.2014.04.007. - DOI - PMC - PubMed
-
- Ritz A, Murali TM. Proceedings of the 5th ACM Conference on Bioinformatics, Computational Biology, and Health Informatics. New York, NY, USA: ACM; 2014. Pathway analysis with signaling hypergraphs; pp. 249–258. (ser BCB ’14). [Online]. Available: http://doi.acm.org/10.1145/2649387.2649450. - DOI
Publication types
MeSH terms
Grants and funding
LinkOut - more resources
Full Text Sources
Other Literature Sources
Miscellaneous
