. 2017 Oct 9;13(10):e1005803.
doi: 10.1371/journal.pcbi.1005803. eCollection 2017 Oct.

Clonal dominance and transplantation dynamics in hematopoietic stem cell compartments

Affiliations

Clonal dominance and transplantation dynamics in hematopoietic stem cell compartments

Peter Ashcroft et al. PLoS Comput Biol. .

Abstract

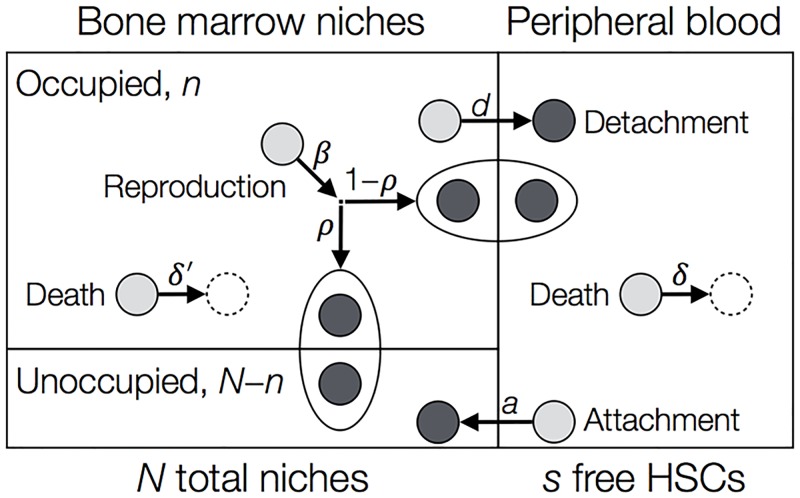
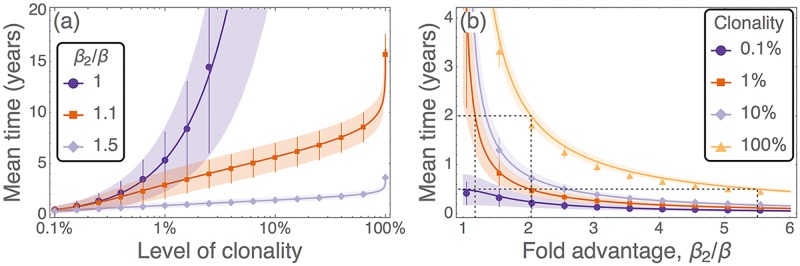
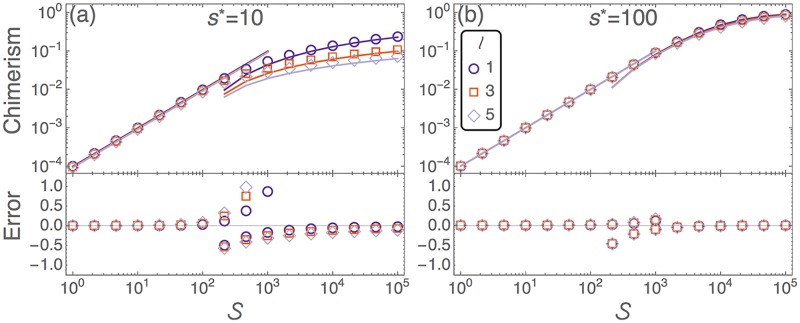
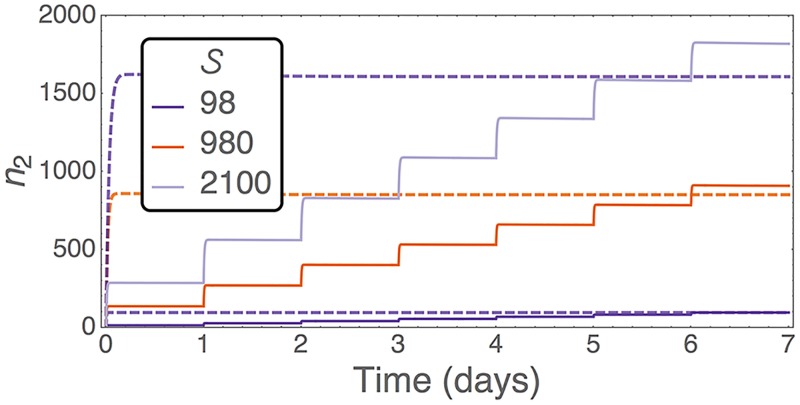
Hematopoietic stem cells in mammals are known to reside mostly in the bone marrow, but also transitively passage in small numbers in the blood. Experimental findings have suggested that they exist in a dynamic equilibrium, continuously migrating between these two compartments. Here we construct an individual-based mathematical model of this process, which is parametrised using existing empirical findings from mice. This approach allows us to quantify the amount of migration between the bone marrow niches and the peripheral blood. We use this model to investigate clonal hematopoiesis, which is a significant risk factor for hematologic cancers. We also analyse the engraftment of donor stem cells into non-conditioned and conditioned hosts, quantifying the impact of different treatment scenarios. The simplicity of the model permits a thorough mathematical analysis, providing deeper insights into the dynamics of both the model and of the real-world system. We predict the time taken for mutant clones to expand within a host, as well as chimerism levels that can be expected following transplantation therapy, and the probability that a preconditioned host is reconstituted by donor cells.


Conflict of interest statement

The authors have declared that no competing interests exist.

Figures

Fig 1
Fig 1. Compartmental model for a single population of HSCs.
The bone marrow (BM) compartment has a fixed total of N niches. At a given time, n of the niches are occupied, and Nn remain unoccupied. The peripheral blood (PB) compartment has no size restriction, and at a given time contains s HSCs. A HSC in the BM can detach at rate d and enter the PB, while a cell in the PB can attach to an unoccupied niche with rate a(Nn)/N. Here (Nn)/N is the fraction of unoccupied niches. HSCs may die in the PB or BM with rates δ and δ′. Reproduction (symmetric division) of HSCs occurs at rate β. The new daughter cell attaches to an empty niche with probability ρ, otherwise it is ejected into the PB. Dynamics are concretely described by the reactions in Eq (1).
Fig 2
Fig 2. Time taken for a clone initiated from a single HSC to expand under different levels of selection.
(a) Time taken for a mutant clone to expand as a function of the level of clonality reached, with colour indicating the selective effect of the mutant. (b) Time taken for a mutant clone to expand as a function of the selective effect, with colour indicating different levels of clonality. Symbols are results from 103 simulations of the full model (with associated standard deviations), and solid lines are predictions from Eq (6). Shaded regions are the predicted standard deviations, using the formula presented in the S1 Supporting Information. Here = 3 minutes, s* = 100, and the remaining parameters are as in Table 1.
Fig 3
Fig 3. Initial chimerism of neutral donor cells in a healthy, non-preconditioned host.
Upper panels depict the level of donor chimerism shortly after a dose of neutral donor cells, S, is injected into the host. Symbols are from numerical integration of Eq (2). The small-dose regime is described by Eq (3) (solid lines for S<103), and the large-dose regime is described by Eq (9) (solid lines for S>102). Lower panels show the accuracy of these approximations when compared to the numerical integration of Eq (2). This error takes the form (approx. − exact)/exact. (a) s* = 10, and (b) s* = 100. The lifetime in the PB, , is measured in minutes. Remaining parameters are as in Table 1.
Fig 4
Fig 4. Number of donor HSCs attaching to the BM of a non-preconditioned host after a single dose (dashed lines) or seven daily doses (solid lines).
Both treatments use the same total number, S, of donor HSCs. Trajectories are from numerical integration of the ODEs Eq (2). Here we have = 3 minutes, s* = 100, and the remaining parameters are as in Table 1.
Fig 5
Fig 5. Probability of reconstitution from a single donor HSC which is injected into a preconditioned host.
Symbols are results from 105 simulations of the stochastic model. For efficiency we ran the simulations until the population reached either 0 (extinction) or 100 (reconstitution), and we assume no further extinction events occur once this upper limit has been reached. Dotted lines are the ‘first-order’ prediction of Eq (10). Solid lines are the predictions of Eq (11) which account for detachments, reattachments, and reproduction events. Remaining parameters are as in Table 1.
Fig 6
Fig 6. Time taken until a clone initiated from a single cell represents 4% [39, 40] of the human HSC pool, as a function of the total number of niches in the system.
Colours represent the selective advantage of the invading clone. Lines are given by the solution of Eq (6), and shaded regions represent the calculated standard deviation (details in the S1 Supporting Information). Remaining parameters are β = 1/40 week−1 [62], = 60 minutes, s* = 0.01N, and n* = 0.99N. Here , s*, and n* are extrapolated from the murine data, where human ≈ 10mouse, which follows the same scaling as the HSC division rate, β. Further parameter combinations are shown in S1 and S2 Figs. References refer only to the source of parameters; no part of this figure has been reproduced from previous works.

References

    1. Kondo M, Wagers AJ, Manz MG, Prohaska SS, Scherer DC, Beilhack GF, et al. Biology of hematopoietic stem cells and progenitors: implications for clinical application. Annu Rev Immunol. 2003;21:759–806. 10.1146/annurev.immunol.21.120601.141007 - DOI - PubMed
    1. Paul F, Arkin Y, Giladi A, Jaitin DA, Kenigsberg E, Keren-Shaul H, et al. Transcriptional heterogeneity and lineage commitment in myeloid progenitors. Cell. 2015;163:1663–1677. 10.1016/j.cell.2015.11.013 - DOI - PubMed
    1. Kaushansky K, Lichtman MA, Prchal JT, Levi M, Press OW, Burns LJ, et al. Williams Hematology. 9th ed McGraw-Hill, New York; 2016.
    1. Vaziri H, Dragowska W, Allsopp RC, Thomas TE, Harley CB, Lansdorp PM. Evidence for a mitotic clock in human hematopoietic stem cells: loss of telomeric DNA with age. Proc Natl Acad Sci USA. 1994;91:9857–9860. 10.1073/pnas.91.21.9857 - DOI - PMC - PubMed
    1. Nombela-Arrieta C, Manz MG. Quantification and three-dimensional microanatomical organization of the bone marrow. Blood Advances. 2017;1(6):407–416. 10.1182/bloodadvances.2016003194 - DOI - PMC - PubMed