. 2018 Mar 16;35(suppl_1):1-27.
doi: 10.1093/imammb/dqx008.

Relating cell shape and mechanical stress in a spatially disordered epithelium using a vertex-based model

Affiliations

Relating cell shape and mechanical stress in a spatially disordered epithelium using a vertex-based model

Alexander Nestor-Bergmann et al. Math Med Biol. .

Abstract

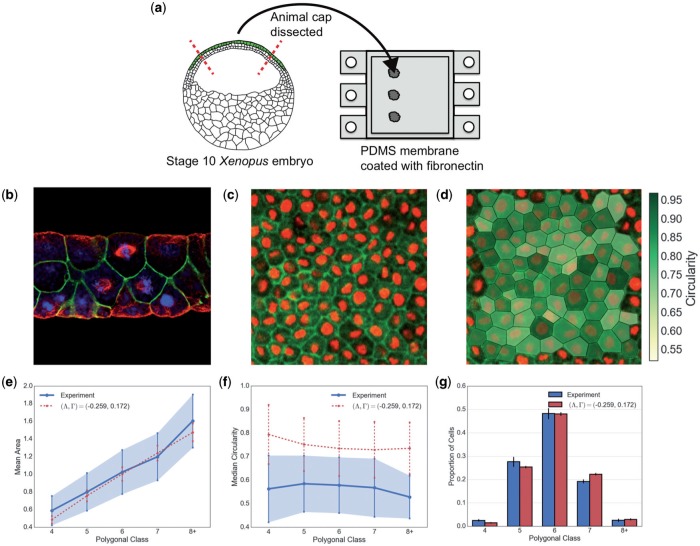
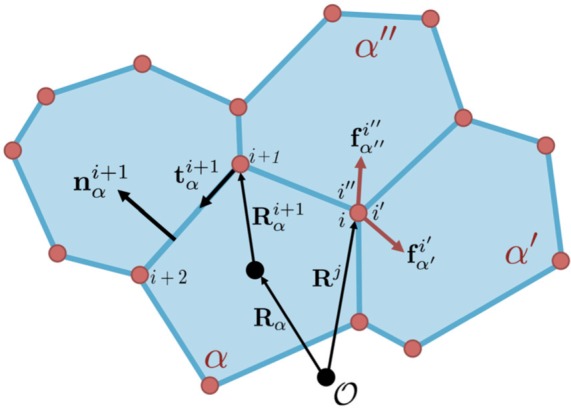
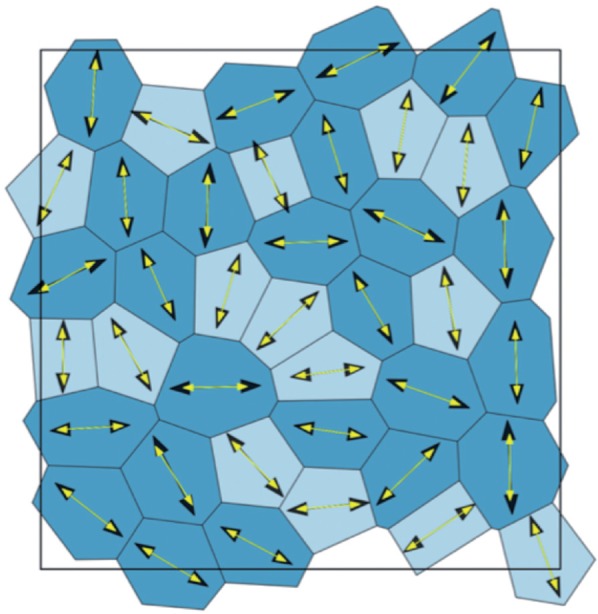
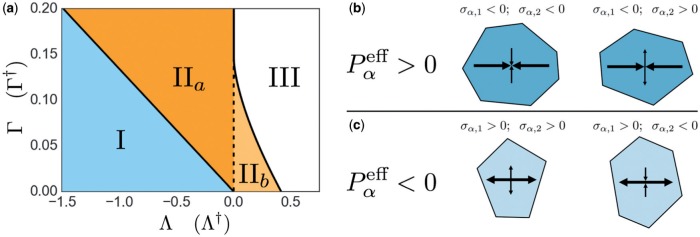
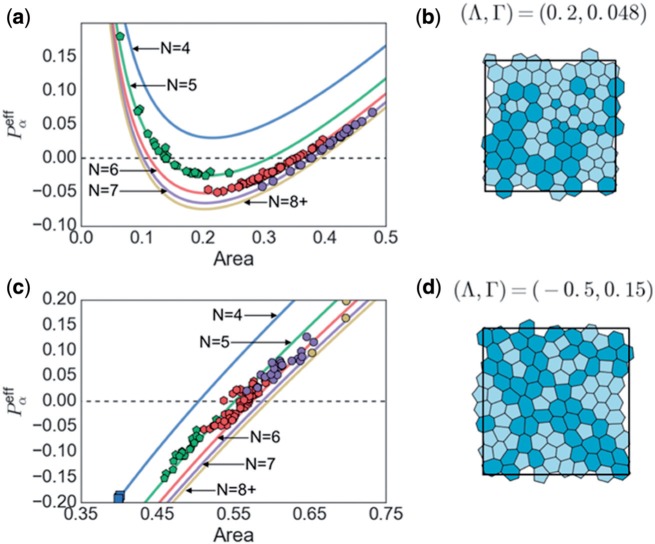
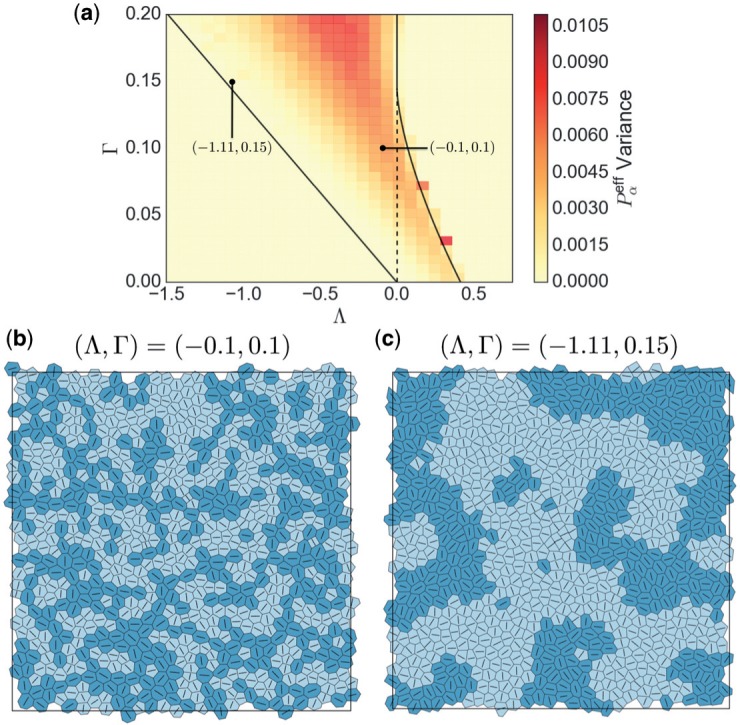
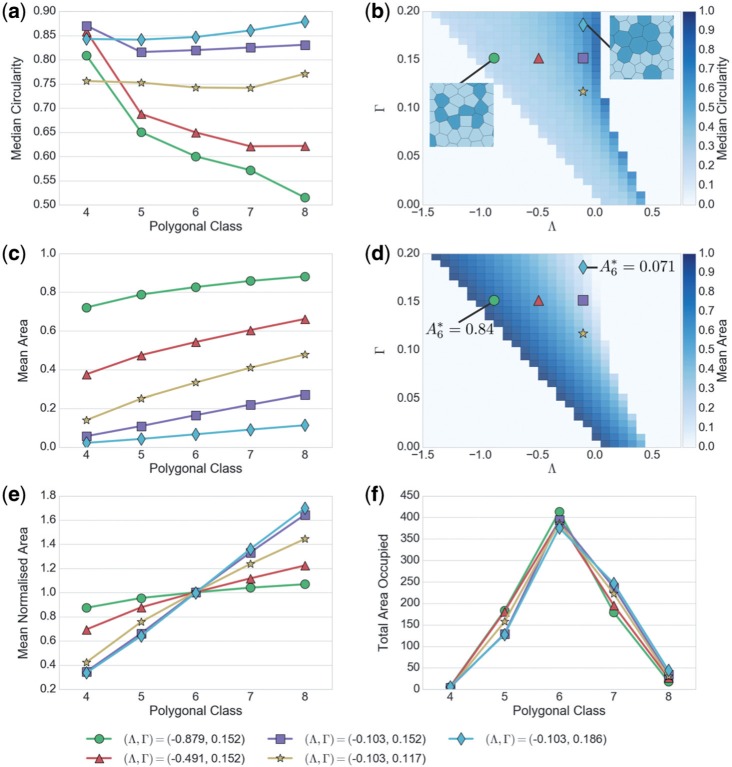
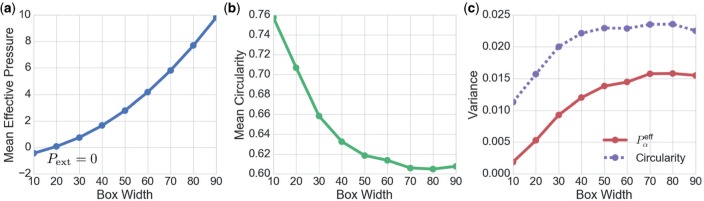
Using a popular vertex-based model to describe a spatially disordered planar epithelial monolayer, we examine the relationship between cell shape and mechanical stress at the cell and tissue level. Deriving expressions for stress tensors starting from an energetic formulation of the model, we show that the principal axes of stress for an individual cell align with the principal axes of shape, and we determine the bulk effective tissue pressure when the monolayer is isotropic at the tissue level. Using simulations for a monolayer that is not under peripheral stress, we fit parameters of the model to experimental data for Xenopus embryonic tissue. The model predicts that mechanical interactions can generate mesoscopic patterns within the monolayer that exhibit long-range correlations in cell shape. The model also suggests that the orientation of mechanical and geometric cues for processes such as cell division are likely to be strongly correlated in real epithelia. Some limitations of the model in capturing geometric features of Xenopus epithelial cells are highlighted.


Figures

Fig. 1.
Fig. 1.
Experimental setup and data analysis. (a) Animal cap tissue was dissected from stage-10 Xenopus laevis embryos and cultured on PDMS membrane. (b) Side-view confocal image of the animal cap (top:apical; bottom:basal), stained for microtubules (red), beta-catenin (green) and DNA (blue). A mitotic spindle is visible in the centremost apical cell. The animal cap is a multi-layered epithelial tissue; we analyse just the outer, apical, cell layer. (c) The apical cell layer of the animal cap tissue is imaged live using confocal microscopy (green, GFP-formula image-tubulin; red, cherry-histone2B). (d) The cell edges are manually traced and cell shapes are derived computationally, being polygonized using the positions of cell junctions. (e) Mean normalized area as a function of polygonal class showing mean and one standard deviation, from experiments (solid and shaded) and simulation (dashed) with parameters formula image, formula image as shown with formula image. Cell areas were normalized relative to the mean of each experiment. (f) Circularity as a function of polygonal class showing mean and one standard deviation, from experiments (solid and shaded) and simulation (dashed) using the same parameters as in (e). (g) Proportions of total cells in each polygonal class in experiments (left bar) and simulations (right bar). Error bars represent formula image confidence intervals calculated from bootstrapping the data. (Colour in online.)
Fig. 2.
Fig. 2.
Representation of disordered cell geometry. Cell formula image has its centroid at formula image relative to a fixed origin, formula image. The position of vertex formula image of cell formula image is given equivalently via formula image, relative to the centroid, or formula image, relative to formula image. For a vertex (trijunction) at formula image, there exist three vectors, formula image for cells, formula image, pointing to the same vertex. Cell properties, such as area and tangents along edges, are defined relative to the cell centroid. (Colour in online.)
Fig. 3.
Fig. 3.
Computational validation of the predicted alignment between principal axis of stress and shape, for formula image. The initial cell array was generated using a Voronoi tessellation and then relaxed to equilibrium using periodic boundary conditions. The eigenvectors corresponding the the principal eigenvalue of formula image and formula image are plotted in black and yellow, respectively. Darker cells have formula image (net tension); lighter cells have formula image (net compression). (Colour in online.)
Fig. 4.
Fig. 4.
(a) formula image-parameter space, showing boundaries for a uniform hexagonal array (following Farhadifar et al., 2007). Region I represents a ‘soft’ network with no shear resistance, bounded by (3.38); formula image has a single positive root in region IIformula image and two positive roots in region formula image. The network collapses in Region III, which is bounded by formula image and (3.39). The transformation (3.40) allows formula image to be replaced by formula image in order to describe cases for which formula image. (b,c) Classification of cell stress configurations in a disordered monolayer, showing representative cell shapes. Larger (smaller) arrows indicate the orientation of the eigenvector associated with the eigenvalue of the stress tensor having larger (smaller) magnitude, where formula image. Inward- (outward)-pointing arrows indicate the tension (compression) generated by the cell. (Colour in online.)
Fig. 5.
Fig. 5.
(a, c) Curves show formula image defined in (3.37) plotted against cell area for perfect N-gons, using formula image (formula image, a, b) and formula image (formula image, c, d). Symbols show formula image defined in (3.24) for computationally simulated cells, with shapes displayed in (b,d). Darker (lighter) cells in (b,d) have formula image (formula image). (Colour in online.)
Fig. 6.
Fig. 6.
(a) A map of the variance of formula image at discrete locations within region II of formula image-parameter space. Lines show the boundaries for a hexagonal network, as in Fig. 4(a). The dark squares along the region IIformula image/III boundary are artefacts, reflecting the co-existence of cells with small and large areas near this boundary. Each datapoint is taken from 5 realizations of a monolayer with 800 cells. (b) An individual monolayer realization for formula image, formula image, formula image with 800 cells. Darker (lighter) shading denotes cells with formula imageformula image. Line segments indicate the principal axis of the shape and stress tensor for each cell, coincident with the heavy arrows in Fig. 4(b), i.e. aligned with the stress eigenvector associated with the eigenvalue of larger magnitude. (c) A similar example for formula image, formula image. (Colour in online.)
Fig. 7.
Fig. 7.
Dependence of cell geometry on model parameters, using five unique simulations with 800 cells (4000 cells total) in a periodic box under zero net external pressure. (a) Mean circularity of cells per polygonal class, at parameter values indicated by corresponding symbols in formula image-parameter space in (b,c). (b) The heat map shows mean circularity of all cells in a simulation, using the same realizations used in Fig. 6. Insets show two example configurations. (c) Mean cell area per polygonal classes, for the same set of parameters. (d) Heat map of mean area of all cells across formula image-parameter space. (e) Mean cell area per polygonal class for given parameters, normalised by the mean area of hexagons. (f) Total area of all cells in each polygonal class, such that the sum of all points equals the area of the box. (Colour in online.)
Fig. 8.
Fig. 8.
Visualizing the effect of peripheral stress on network packing geometry. 800 cells were simulated in boxes of width formula image leading to formula image distributions with means shown in (a). formula image for a box width of 20. The corresponding means of the distributions of circularities are shown in (b). The variance of the distributions at different box widths are given in (c), for formula image (solid) and circularity (dashed). Model parameters used were formula image for which formula image. Larger box sizes have lower cell density, higher mean formula image, lower mean circularity and greater variability. (Colour in online.)
Fig. 9.
Fig. 9.
Results of parameter fitting. (a) Heat map showing value of the likelihood function (4.1) across a uniform grid in valid parameter space. The simulated monolayers used were the same as those in Figs 6 and 7. For each monolayer, the mean areas per polygonal class were calculated and used to evaluate (4.1). The likelihood was maximized at formula image, marked by the circular symbol; a corresponding monolayer is shown in (b), with cells having formula image (formula image) shaded dark (light). (c, d) Distributions of area and circularity across polygonal classes for simulations with formula image for increasing values of formula image. (Colour in online.)
Fig. D1.
Fig. D1.
(a) An example of force chains in a monolayer, with 800 cells and formula image, formula image, formula image. Darker (lighter) shading denotes cells with formula imageformula image. Short line segments indicate the principal axis of the stress tensor for each cell (see Fig. 4). Long red lines identify chains satisfying (D.1) with formula image. (b–e) identify force chains. Red lines represent vectors running between cell centroids. Black double sided arrows indicate the principal axis of stress. b) Cell formula image has been selected to start a chain, and cells formula image and formula image are found to satisfy (D.1c). (c-e) Only formula image is selected to join the chain as it satisfies both (D.1a) (c) and (D.1b) (d). formula image is excluded because is fails (D.1a) (c), despite satisfying (D.1b) (e). (Colour in online.)

Similar articles

Cited by

References

    1. Barton D. L., Henkes S., Weijer C. J. & Sknepnek R. (2016) Active vertex model for cell-resolution description of epithelial tissue mechanics. PLoS Comput. Biol., 13, e1005569. - PMC - PubMed
    1. Batchelor G. K. (1970) The stress system in a suspension of force-free particles. J. Fluid Mech., 41, 545–570.
    1. Bi D., Lopez J. H., Schwarz J. M. & Manning M. L. (2015) A density-independent rigidity transition in biological tissues. Nat. Phys., 11, 1074–1079.
    1. Bielmeier C., Alt S., Weichselberger V., La Fortezza M., Harz H., Jülicher F., Salbreux G. & Classen A.-K. (2016) Interface contractility between differently fated cells drives cell elimination and cyst formation. Curr. Biol., 26, 563–574. - PMC - PubMed
    1. Blanchard G. B. (2017) Taking the strain: quantifying the contributions of all cell behaviours to changes in epithelial shape. Philos. Trans. Roy. Soc. London Ser. B, 372, 20150513. - PMC - PubMed

Publication types

LinkOut - more resources