. 2017 Oct 13;68(17):4821-4837.
doi: 10.1093/jxb/erx284.

The plasma membrane H+-ATPase gene family in Solanum tuberosum L. Role of PHA1 in tuberization

Affiliations

The plasma membrane H+-ATPase gene family in Solanum tuberosum L. Role of PHA1 in tuberization

Margarita Stritzler et al. J Exp Bot. .

Abstract

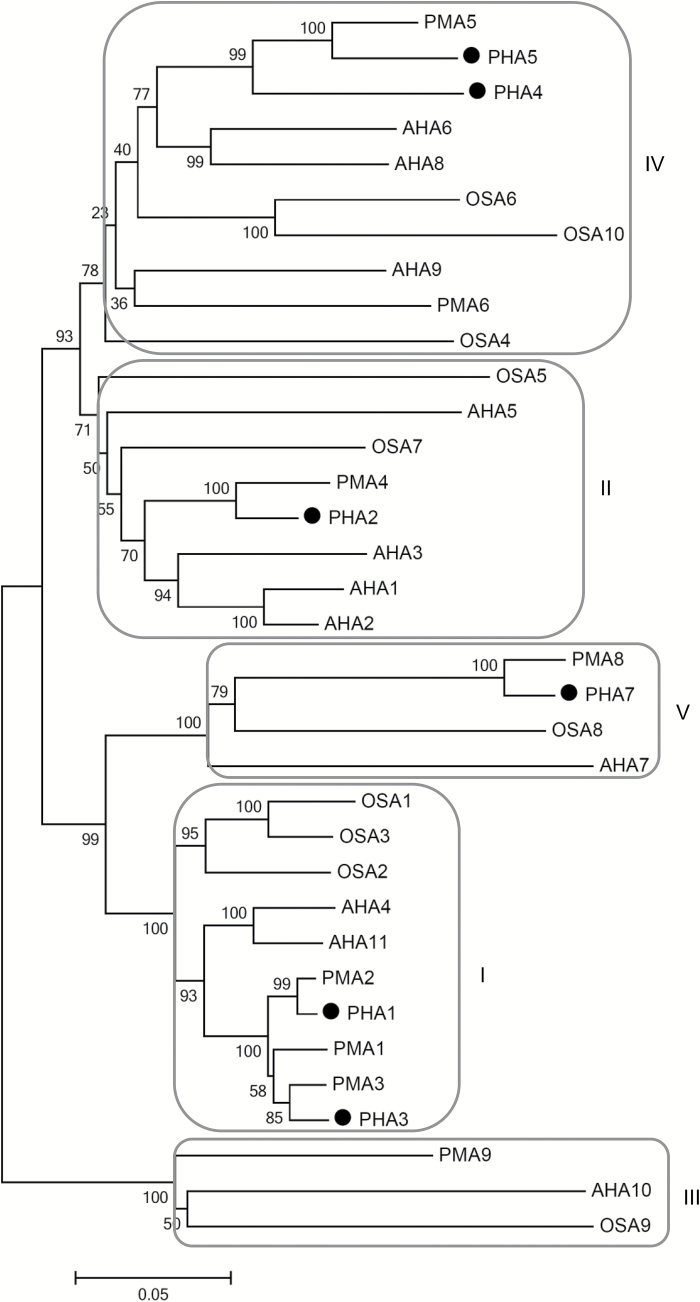
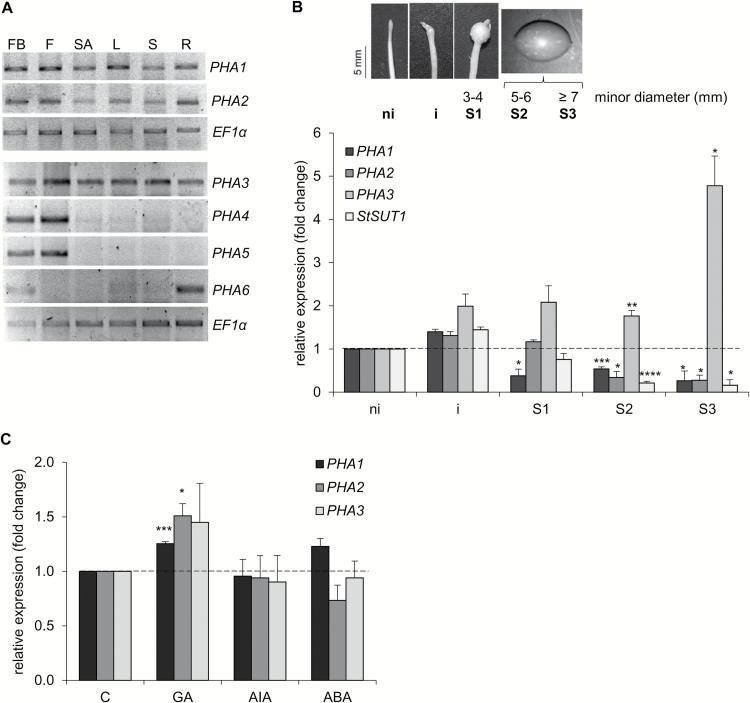
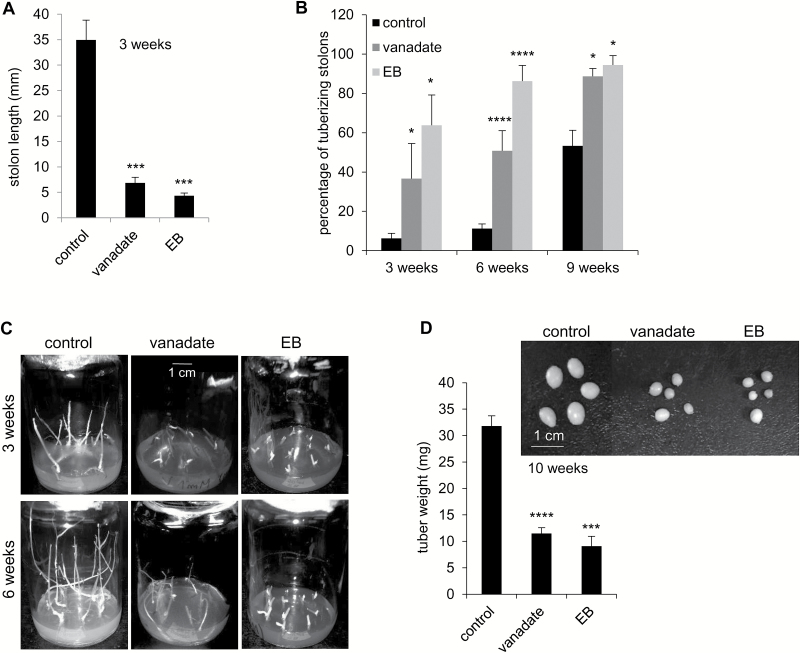
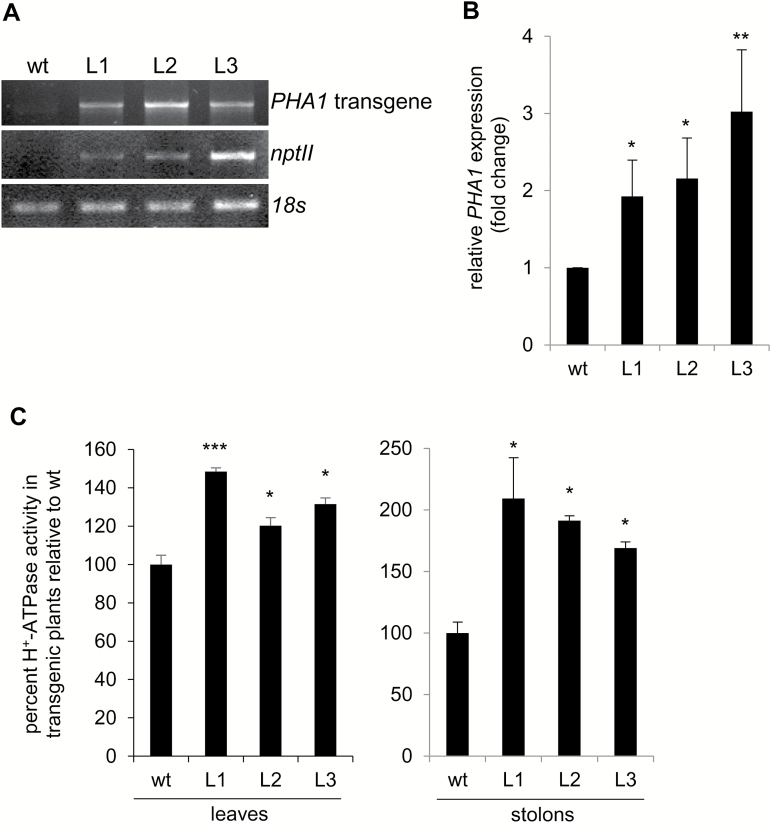
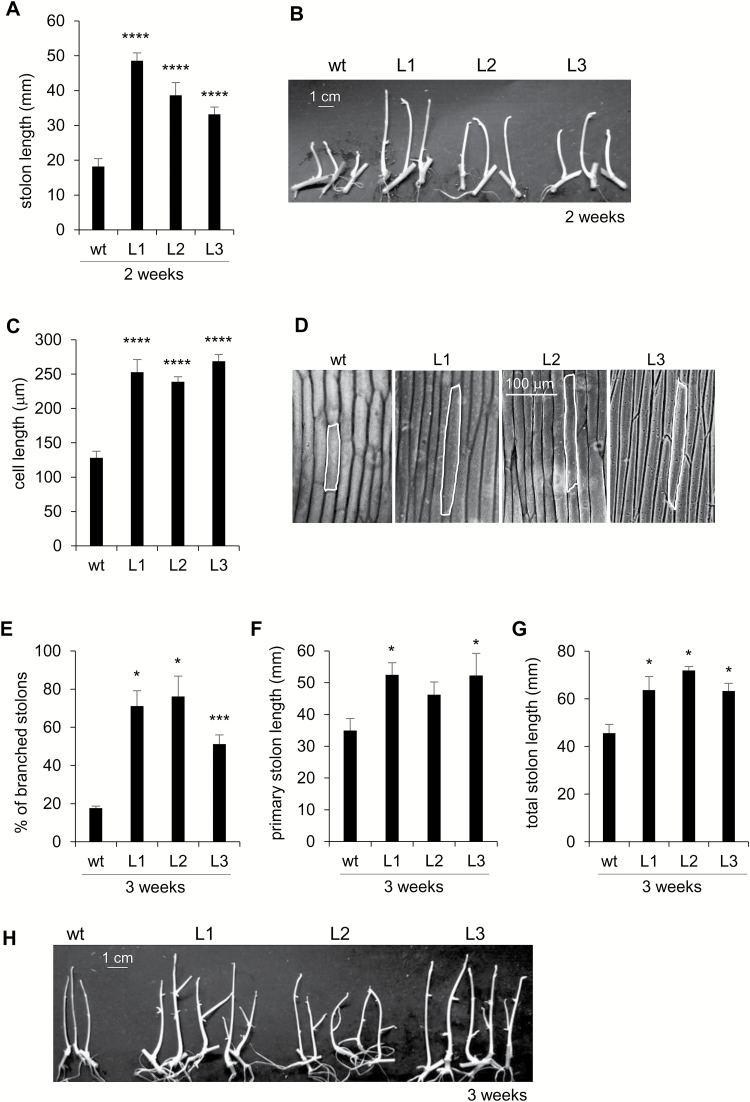
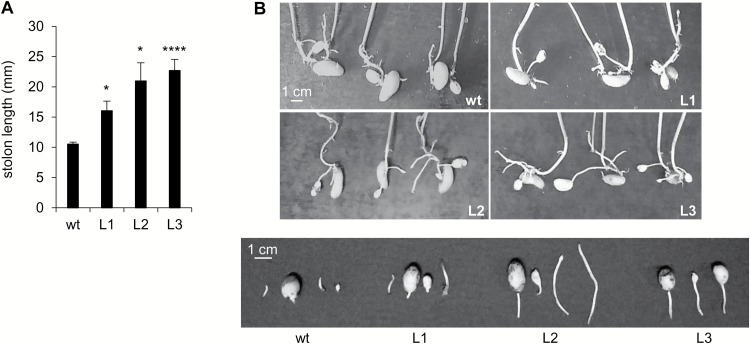
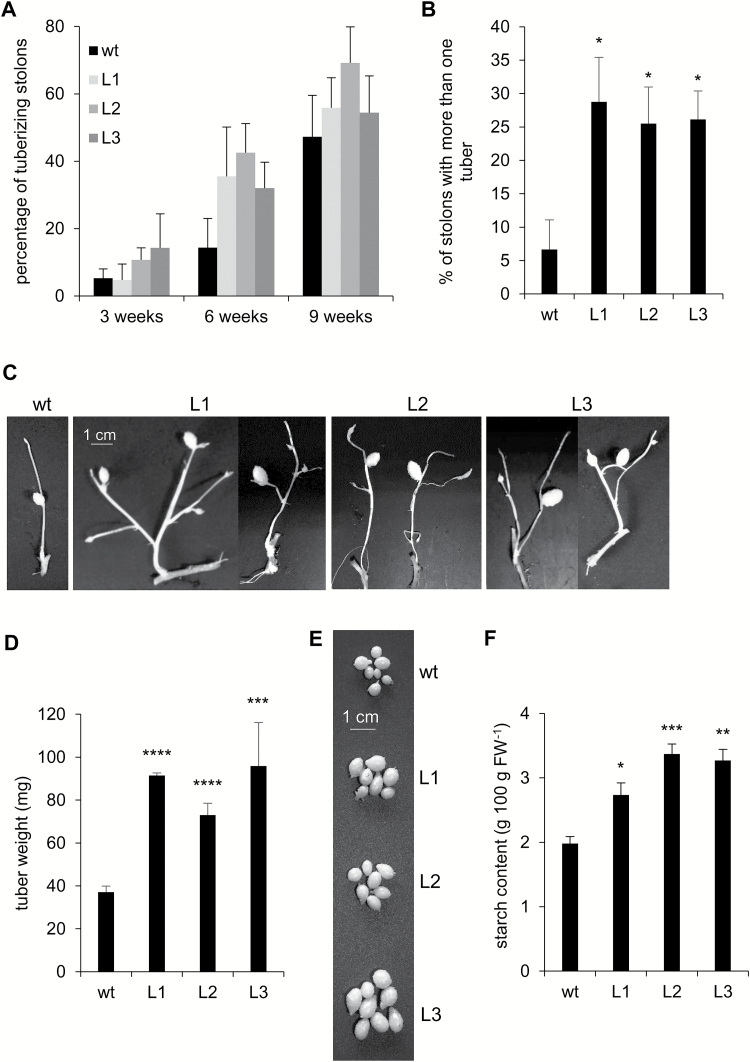
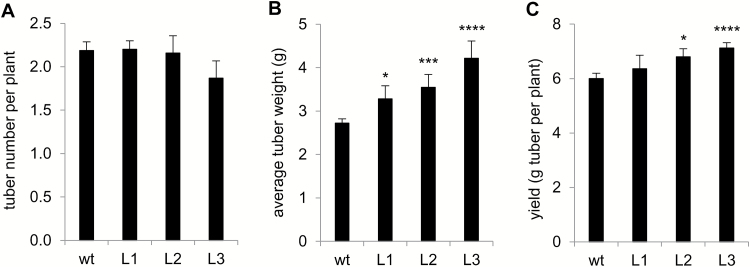
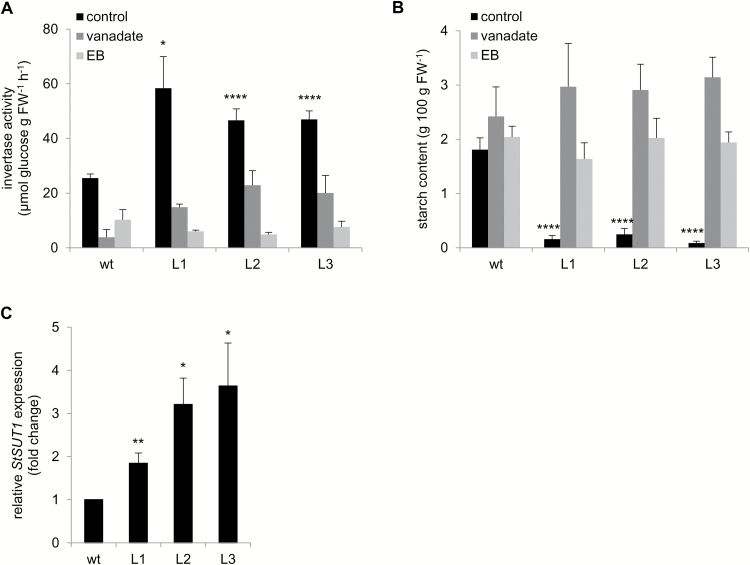
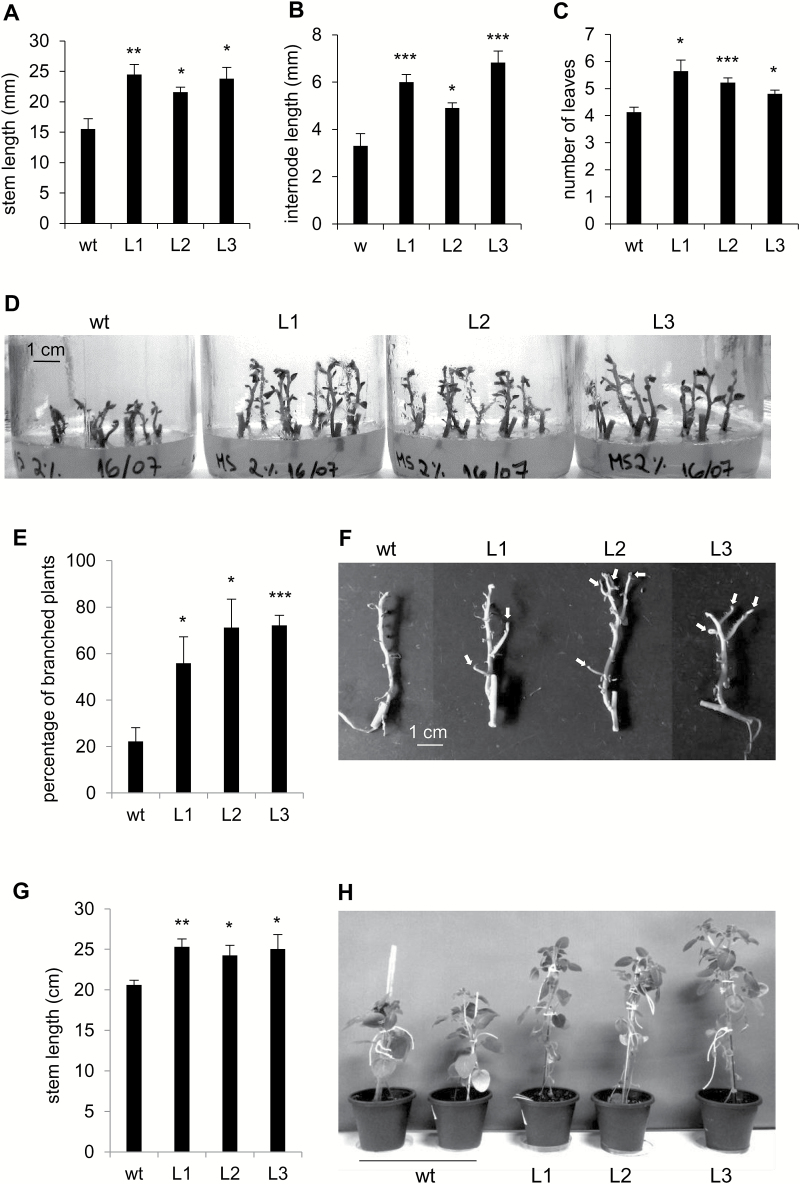
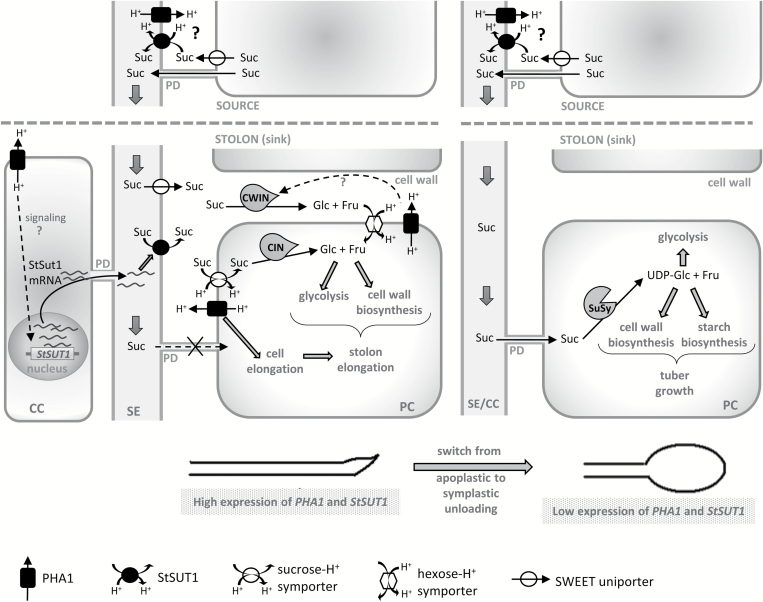
This study presents the characterization of the plasma membrane (PM) H+-ATPases in potato, focusing on their role in stolon and tuber development. Seven PM H+-ATPase genes were identified in the Solanum tuberosum genome, designated PHA1-PHA7. PHA genes show distinct expression patterns in different plant tissues and under different stress treatments. Application of PM H+-ATPase inhibitors arrests stolon growth, promotes tuber induction, and reduces tuber size, indicating that PM H+-ATPases are involved in tuberization, acting at different stages of the process. Transgenic potato plants overexpressing PHA1 were generated (PHA1-OE). At early developmental stages, PHA1-OE stolons elongate faster and show longer epidermal cells than wild-type stolons; this accelerated growth is accompanied by higher cell wall invertase activity, lower starch content, and higher expression of the sucrose-H+ symporter gene StSUT1. PHA1-OE stolons display an increased branching phenotype and develop larger tubers. PHA1-OE plants are taller and also present a highly branched phenotype. These results reveal a prominent role for PHA1 in plant growth and development. Regarding tuberization, PHA1 promotes stolon elongation at early stages, and tuber growth later on. PHA1 is involved in the sucrose-starch metabolism in stolons, possibly providing the driving force for sugar transporters to maintain the apoplastic sucrose transport during elongation.

Keywords: Branching; PHA1; PM H+-ATPase; plant growth; potato; stolon elongation; tuber growth; tuberization.


Figures

Fig. 1.
Fig. 1.
Phylogenetic analysis of potato, Arabidopsis, N. plunbaginifolia, and rice PM H+-ATPases. The amino acid sequences of PM H+-ATPases from S. tuberosum Phureja (PHA1–PHA5 and PHA7), A. thaliana (AHA1–AHA11), N. plunbaginifolia (PMA1–PMA6, PMA8, and PMA9), and O. sativa (OSA1–OSA10) were compared to generate the phylogenetic tree using the Neighbor–Joining method of MEGA5.05 (http://www.megasoftware.net/). The percentage of replicate trees in which the associated taxa clustered together in the bootstrap test (1000 replicates) is indicated next to the branches. GenBank accession numbers are: A. thaliana AHA1, P20649; AHA2, P19456; AHA3, P20431; AHA4, Q9SU58; AHA5, Q9SJB3; AHA6, Q9SH76; AHA7, Q9LY32; AHA8, Q9M2A0; AHA9, Q42556; AHA10, Q43128; AHA11, Q9LV11; N. plumbaginifolia PMA1, Q08435; PMA2, Q42932; PMA3, Q08436; PMA4, Q03194; PMA6, Q9SWH2; PMA8, Q9SWH1; PMA9, Q9SWH0); O. sativa OSA1, Q43001; OSA2, Q43002; OSA3, AF110268; OSA4, AJ440002; OSA5, AJ440216; OSA6, AJ440217; OSA7, AJ440218; OSA8, AJ440219; OSA9, AJ440220; and OSA10, AJ440221. Accession numbers for S. tuberosum Phureja (Potato Genome Sequencing Consortium Public Data Release): PHA1, PGSC0003DMP400055772; PHA2, PGSC0003DMP400007331; PHA3, PGSC0003DMP400043938; PHA4, PGSC0003DMP400021001; PHA5, PGSC0003DMP400013900; and PHA7, PGSC0003DMP400060260).
Fig. 2.
Fig. 2.
Expression profile of PHA genes. (A) Total RNA was isolated from different tissues of soil-grown potato plants, cDNA was synthesized, and semi-quantitative RT–PCR was performed. A representative RT–PCR analysis of three independent experiments is shown. FB, flower bud; F, flower; SA, shoot apex; L, leaf; S, stem; R, root. Quantitative data of RT–PCR bands are shown in Supplementary Fig. S2. (B) RT–qPCR analysis of PHA genes and StSUT1 during tuberization in vitro. Total RNA was obtained from stolons cultured under tuber-inducing conditions (MS medium plus 8% sucrose) at progressive stages of tuber development (ni, non-induced stolons; i, induced stolons with visible subapical swelling; S1–S3, tubers at different stages of growth). Quantitative data (mean ±SE) of three independent experiments, each consisting of four technical replicates, are displayed in the bar graph. The asterisks indicate statistical significance (*P<0.05, **P<0.01, ***P<0.005, ****P<0.001, with respect to non-induced stolons). (C) RT–qPCR analysis of PHA genes in stolons cultured under tuber-inducing conditions for 2 weeks, in the absence or presence of 5 μM GA3 (GA), 25 μM 3-indoleacetic acid (IAA), or 5 μM ABA. Quantitative data (mean ±SE) of three independent experiments, each consisting of four technical replicates, are displayed in the bar graph. The asterisks indicate statistical significance (*P<0.05, ***P<0.005, with respect to control, C).
Fig. 3.
Fig. 3.
Effect of vanadate and erythrosine B (EB) on stolons cultured under tuber-inducing conditions. Stolons were cultured under tuber-inducing conditions (MS medium plus 8% sucrose) in the absence (control) or presence of 1 mM vanadate or 50 μM erythrosine B. The stolon length was measured after 3 weeks (A), and the percentage of tuberizing stolons was determined at the indicated times (B). (C) Representative images of stolons. (D) Fresh weight of tubers obtained after 10 weeks of culture under tuber-inducing conditions in the absence (control) or presence of 1 mM vanadate or 50 μM erythrosine B; a representative image of the tubers obtained is shown. Quantitative data of three independent experiments (mean ±SE) are displayed in the bar graphs. The asterisks indicate statistical significance (*P<0.05, ***P<0.005, ****P<0.001, with respect to control).
Fig. 4.
Fig. 4.
Functional complementation of a null mutation of yeast PM H+-ATPase (strain YAK2) by the PHA1 gene from S. tuberosum cv. Spunta. (A) Serial dilutions (starting from an OD600nm=1.7) of the following YAK2 yeast strains were spotted onto solid media containing glucose (MGlu-His, Leu, Trp) or galactose (MGal-His, Leu, Trp), buffered at pH 6.5: Control –, YAK2 transformed with empty YEplac181; Control +, YAK2 transformed with YEplac181-E14D, that expresses the constitutively active form of the PM H+-ATPase PMA2 Q42932 from N. plumbaginifolia under the yeast PMA1 promoter; PHA1∆N, YAK2 transformed with YEplac181-PHA1∆N that expresses a truncated, inactive form of PHA1, lacking the first 553 nucleotides of the N-terminus (devoid of the TGES motif) under the yeast PMA1 promoter; PHA1-1/2/3, YAK2 transformed with YEplac181-PHA1, that expresses PHA1 under the yeast PMA1 promoter (three different transformed yeast clones were used). (B) Serial dilutions (starting from an OD600nm=1.7) of the following YAK2 yeast strains spotted onto solid media containing glucose (MGlu-His, Leu, Ura, Trp): Control –, PHA1–PHA3, and PHA1–PHA3 after 5-FOA treatment to eliminate the plasmid bearing the yeast PM H+-ATPase gene. Yeast strains were grown at 30 °C for 48 h.
Fig. 5.
Fig. 5.
Analysis of transgenic plants overexpressing PHA1 (PHA1-OE). (A) PCR analysis of genomic DNA isolated from leaves of wild-type (wt) and transgenic plants (L) grown in vitro, to detect the presence of the transgene and the nptII gene (B) RT–qPCR analysis of RNA isolated from leaves of wild-type and transgenic plants grown in vitro, to determine PHA1 expression. Data are presented as the expression level relative to the wt. Quantitative data (mean ±SE) of three independent experiments, each consisting of four technical replicates, are displayed in the bar graph. (C) PM H+-ATPase activity in leaves and stolons, expressed as the percentage increase in proton pump activity of transgenic lines with respect to wild-type plants. As a reference, average PM H+-ATPase activity was 44.7 pmol Pi min–1 µg–1 protein for wild-type leaves and 18.7 pmol Pi min–1 µg–1 protein for wild-type stolons. Means ±SE of two independent experiments each performed in quadruplicate, are shown. The asterisks indicate statistical significance (*P<0.05, **P<0.01, ***P<0.005, with respect to the wt).
Fig. 6.
Fig. 6.
Phenotypic analysis of PHA1-OE stolons cultured in vitro. Stolons from wild-type (wt) and PHA1-OE plants (L) were cultured under tuber-inducing conditions (MS medium plus 8% sucrose). (A) Stolon length was determined after 2 weeks of culture; quantitative data of three independent experiments (mean ±SE) are displayed in the bar graph; a representative image is shown (B). (C) Longitudinal length of epidermal cells of the medial region of the stolons cultured for 2 weeks; the data represent the means ±SE of five biological replicates; lengths of 30–60 cells per replicate were measured. (D) Imprints of epidermal cells from the medial region of stolons, viewed by light microscopy. After 3 weeks, the percentage of branched stolons (E), primary stolon length (F), and total stolon length (G) were determined; quantitative data of three independent experiments (mean ±SE) are displayed in the bar graphs. (H) Representative images of stolons after 3 weeks of culture. The asterisks indicate statistical significance (*P<0.05, ***P<0.005, ****P<0.001, with respect to the wt).
Fig. 7.
Fig. 7.
Stolon length of PHA1-OE plants grown in soil. (A) Stolon length of plants obtained from seed tubers, grown in soil, in a greenhouse, for 4 weeks. The data of four independent experiments (mean ±SE) are displayed in the bar graph; each experiment consisted of 3–4 soil-grown plants per condition, with 3–5 stolons per plant. The asterisks indicate statistical significance [*P<0.05, ****P<0.001, with respect to the wild type (wt)]. (B) Representative image of the underground part of the plants (upper panel) and detached stolons (lower panel).
Fig. 8.
Fig. 8.
Tuberization of PHA1-OE stolons cultured in vitro. Stolons from wild-type (wt) and PHA1-OE (L) plants were cultured under tuber-inducing conditions (MS medium plus 8% sucrose). (A) Percentage of tuberizing stolons, determined at the indicated times. (B) Percentage of stolons presenting more than one tuber after 10 weeks of culture; a representative image of the stolons is shown (C). (D) Fresh weight of tubers obtained from wild-type and PHA1-OE stolons after 10 weeks of culture; a representative image of the tubers is shown (E). (F) Starch content of tubers obtained from wild-type and PHA1-OE stolons after 10 weeks of culture. Quantitative data of three independent experiments (mean ±SE) are displayed in the bar graphs. The asterisks indicate statistical significance (*P<0.05, **P<0.01, ***P<0.005, ****P<0.001, with respect to the wt).
Fig. 9.
Fig. 9.
Tuberization of PHA1-OE plants in soil. Wild-type (wt) and PHA1-OE plants (L) transferred to soil ex vitro were cultivated in a growth chamber. After 10 weeks, the tubers were harvested and the number of tubers obtained per plant (A), the average tuber fresh weight (B), and the tuber yield, defined as grams (FW) of tuber obtained per plant (C) were determined. Data are the results (mean ±SE) of 30–60 plants obtained from five different harvests performed over an 18 month period. The asterisks indicate statistical significance (*P<0.05, ***P<0.005, ****P<0.001, with respect to the wt).
Fig. 10.
Fig. 10.
Cell wall acid invertase activity, starch content, and StSUT1 expression in stolons from wild-type (wt) and PHA1-OE (L) plants. Stolons were cultured under tuber-inducing conditions (MS medium plus 8% sucrose) for 2 weeks; alternatively, 1 mM vanadate or 50 μM erythrosine B (EB) was applied to the medium. (A) Cell wall acid invertase activity was determined in the apical portion (1 cm) of stolons cultured in the absence or presence of PM H+-ATPase inhibitors. (B) Starch content was determined in the apical portion (1 cm) of stolons cultured in the absence or presence of PM H+-ATPase inhibitors. (C) RT–qPCR analysis of StSUT1 in wt and transgenic stolons; data are presented as the expression level relative to the wt. Quantitative data (mean ±SE) of three independent experiments, each consisting of four technical replicates, are displayed in the bar graphs. The asterisks indicate statistical significance (*P<0.05, **P<0.01, ****P<0.001, with respect to the wt).
Fig. 11.
Fig. 11.
Phenotypic analysis of PHA1-OE plants grown in vitro. Wild-type (wt) and transgenic (L) plants generated from single-node cuttings were grown on MS medium plus 2% sucrose. After 2 weeks, the stem length (A), first internode length (B), and number of leaves (C) were determined. (D) Representative image of plants after 2 weeks of culture. (E) After 4 weeks, the percentage of branched plants was determined as the number of plants presenting at least one branch ≥5 mm, with respect to the total number of plants. (F) Representative image of wt and PHA1-OE plants grown in vitro for 4 weeks; leaves appear shrunken, since plants were allowed to air-dry for better visualization of branches, which are indicated with arrows. (G) Stem length of plants grown in soil, in a growth chamber, for 4 weeks after ex vitro transfer; a representative image of the plants is shown (H). Quantitative data of four independent experiments (mean ±SE) are displayed in the bar graphs; each experiment consisted of 15–20 in vitro cultured plants or 8–10 soil-grown plants per condition. The asterisks indicate statistical significance (*P<0.05, **P<0.01, ***P<0.005, with respect to the wt).
Fig. 12.
Fig. 12.
Model for the potential function of PHA1 in stolons, based on the results obtained in this study (see text for details). Suc, sucrose; SE, sieve element; CC, companion cell; CWIN, cell wall invertase; CIN, cytoplasmic invertase; SuSy, sucrose synthase; PD, plasmodesmata; PC, parenchymal cell.

Similar articles

Cited by

References

    1. Ahn S, Im Y, Chung G, Cho B. 1999. Inducible expression of plasma membrane H+-ATPase in the roots of figleaf gourd plants under chilling root temperature. Physiologia Plantarum 106, 35–40.
    1. Albertson PL, Peters KF, Grof CPL. 2001. An improved method for the measurement of cell wall invertase activity in sugarcane tissue. Functional Plant Biology 28, 323–328.
    1. Appeldoorn NJG, de Bruijn SM, Koot-Gronsveld EAM, Visser RGF, Vreugdenhil D, van der Plas L. 1997. Developmental changes involved in conversion of sucrose to hexose-phosphate during early tuberization of potato. Planta 202, 220–226.
    1. Arango M, Gévaudant F, Oufattole M, Boutry M. 2003. The plasma membrane proton pump ATPase: the significance of gene subfamilies. Planta 216, 355–365. - PubMed
    1. Aue HL, Lecomte I, Gendraud M, Petel G. 1999. Change in plasma membrane ATPase activity during dormancy release of vegetative peach-tree buds. Physiologia Plantarum 106, 41–46.

Publication types

MeSH terms