

Repression of TERMINAL FLOWER1 primarily mediates floral induction in pear (Pyrus pyrifolia Nakai) concomitant with change in gene expression of plant hormone-related genes and transcription factors
- PMID: 28992213
- PMCID: PMC5853822
- DOI: 10.1093/jxb/erx296
Repression of TERMINAL FLOWER1 primarily mediates floral induction in pear (Pyrus pyrifolia Nakai) concomitant with change in gene expression of plant hormone-related genes and transcription factors
Abstract
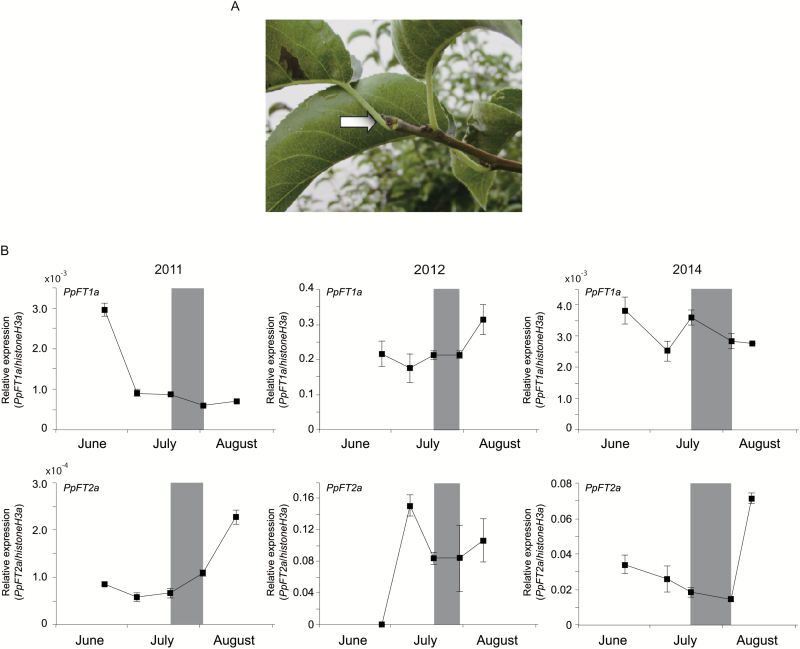
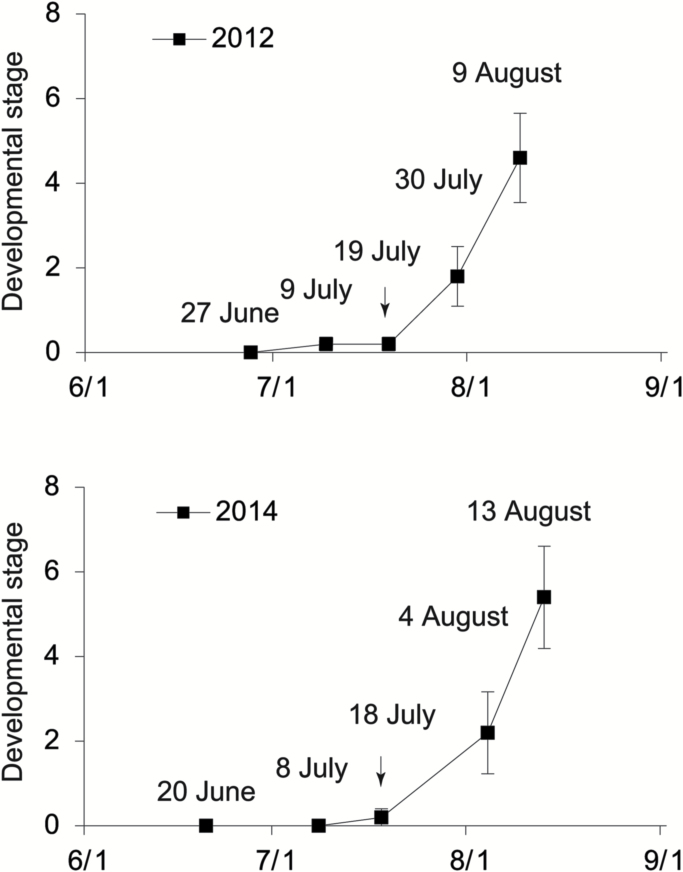
Floral induction is an important event in the annual growth cycle of perennial fruit trees. For pear, this event directly affects fruit production in the following year. The flower buds in many species are induced by FLOWERING LOCUS T (FT), whose effect is repressed by the meristem-expressed gene TERMINAL FLOWER1 (TFL1). In this study, we investigated the functions of pear FT and TFL1 genes during floral development. Expression of pear FTs (PpFT1a and PpFT2a) in reproductive meristems was not obviously induced prior to floral initiation, while expression of TFL1s (PpTFL1-1a and PpTFL1-2a) rapidly decreased. The induction of the productive meristem identity MADS-box gene AP1 after repression of PpTFL1s suggested a primary role for PpTFL1 in floral induction. RNA-seq analysis suggested that plant hormone-related genes and several transcription factors that were coexpressed with PpTFL1 were potentially involved in the PpTFL1-mediated floral induction. Our data indicate the essential function of TFL1 in pear floral induction and add another species in the family Rosaceae in addition to strawberry and rose that shows a role for TFL1 in floral induction.
Keywords: Floral induction; TERMINAL FLOWER1; pear; plant hormone-related genes; signal transduction; transcription factor.
© The Author 2017. Published by Oxford University Press on behalf of the Society for Experimental Biology.
Figures


Similar articles
-
Effect of extending the photoperiod with low-intensity red or far-red light on the timing of shoot elongation and flower-bud formation of 1-year-old Japanese pear (Pyrus pyrifolia).Tree Physiol. 2014 May;34(5):534-46. doi: 10.1093/treephys/tpu033. Epub 2014 May 29. Tree Physiol. 2014. PMID: 24876291
-
Physiological differences between bud breaking and flowering after dormancy completion revealed by DAM and FT/TFL1 expression in Japanese pear (Pyrus pyrifolia).Tree Physiol. 2016 Jan;36(1):109-20. doi: 10.1093/treephys/tpv115. Epub 2015 Nov 6. Tree Physiol. 2016. PMID: 26546364
-
Involvement of EARLY BUD-BREAK, an AP2/ERF Transcription Factor Gene, in Bud Break in Japanese Pear (Pyrus pyrifolia Nakai) Lateral Flower Buds: Expression, Histone Modifications and Possible Target Genes.Plant Cell Physiol. 2016 May;57(5):1038-47. doi: 10.1093/pcp/pcw041. Epub 2016 Mar 3. Plant Cell Physiol. 2016. PMID: 26940832
-
Regulation and function of SOC1, a flowering pathway integrator.J Exp Bot. 2010 May;61(9):2247-54. doi: 10.1093/jxb/erq098. Epub 2010 Apr 22. J Exp Bot. 2010. PMID: 20413527 Review.
-
Constraints to obtaining consistent annual yields in perennials. II: Environment and fruit load affect induction of flowering.Plant Sci. 2013 Jun;207:168-76. doi: 10.1016/j.plantsci.2013.02.006. Epub 2013 Feb 20. Plant Sci. 2013. PMID: 23602112 Review.
Cited by
-
Comparative transcriptome and metabolite profiling of four tissues from Alisma orientale (Sam.) Juzep reveals its inflorescence developmental and medicinal characteristics.Sci Rep. 2019 Aug 23;9(1):12310. doi: 10.1038/s41598-019-48806-w. Sci Rep. 2019. PMID: 31444376 Free PMC article.
-
How Is Global Warming Affecting Fruit Tree Blooming? "Flowering (Dormancy) Disorder" in Japanese Pear (Pyrus pyrifolia) as a Case Study.Front Plant Sci. 2022 Feb 10;12:787638. doi: 10.3389/fpls.2021.787638. eCollection 2021. Front Plant Sci. 2022. PMID: 35211129 Free PMC article. Review.
-
Regulatory frameworks involved in the floral induction, formation and developmental programming of woody horticultural plants: a case study on blueberries.Front Plant Sci. 2024 Feb 12;15:1336892. doi: 10.3389/fpls.2024.1336892. eCollection 2024. Front Plant Sci. 2024. PMID: 38410737 Free PMC article. Review.
-
Restructuring plant types for developing tailor-made crops.Plant Biotechnol J. 2023 Jun;21(6):1106-1122. doi: 10.1111/pbi.13666. Epub 2023 Mar 22. Plant Biotechnol J. 2023. PMID: 34260135 Free PMC article. Review.
-
Genome-wide characterization of PEBP family genes in nine Rosaceae tree species and their expression analysis in P. mume.BMC Ecol Evol. 2021 Feb 23;21(1):32. doi: 10.1186/s12862-021-01762-4. BMC Ecol Evol. 2021. PMID: 33622244 Free PMC article.
References
-
- Abe M, Kobayashi Y, Yamamoto S et al. 2005. FD, a bZIP protein mediating signals from the floral pathway integrator FT at the shoot apex. Science 309, 1052–1056. - PubMed
-
- Achard P, Baghour M, Chapple A, Hedden P, Van Der Straeten D, Genschik P, Moritz T, Harberd NP. 2007. The plant stress hormone ethylene controls floral transition via DELLA-dependent regulation of floral meristem-identity genes. Proceedings of the National Academy of Sciences, USA 104, 6484–6489. - PMC - PubMed
-
- Achard P, Cheng H, De Grauwe L, Decat J, Schoutteten H, Moritz T, Van Der Straeten D, Peng J, Harberd NP. 2006. Integration of plant responses to environmentally activated phytohormonal signals. Science 311, 91–94. - PubMed
Publication types
MeSH terms
Substances
LinkOut - more resources
Full Text Sources
Other Literature Sources
