

A study of CDR3 loop dynamics reveals distinct mechanisms of peptide recognition by T-cell receptors exhibiting different levels of cross-reactivity
- PMID: 28992359
- PMCID: PMC5838422
- DOI: 10.1111/imm.12849
A study of CDR3 loop dynamics reveals distinct mechanisms of peptide recognition by T-cell receptors exhibiting different levels of cross-reactivity
Abstract
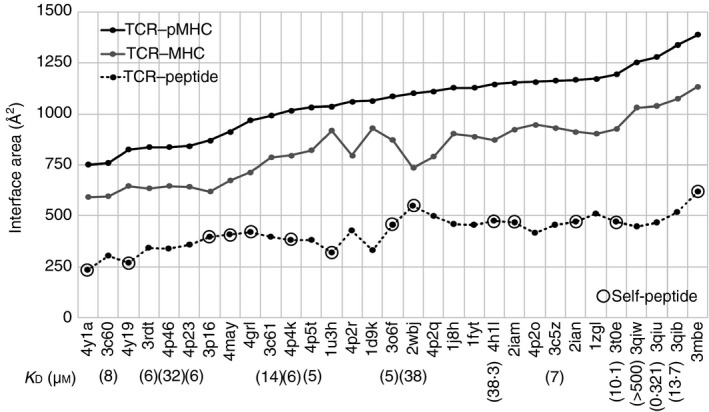
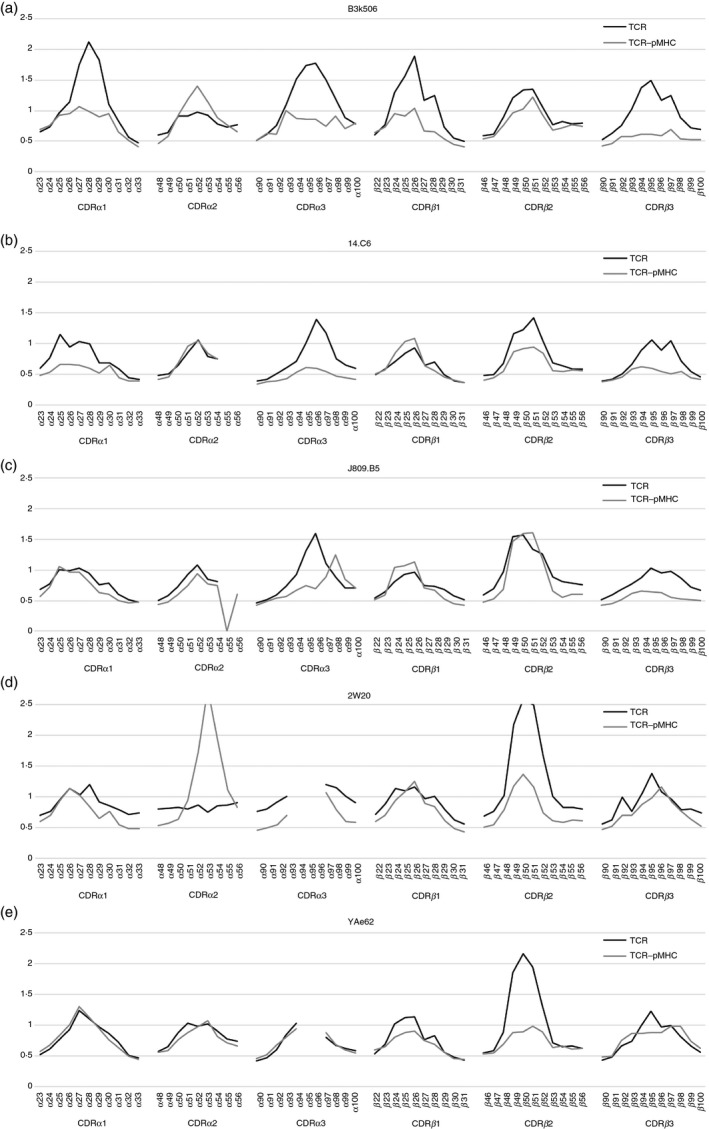
T-cell receptors (TCRs) can productively interact with many different peptides bound within the MHC binding groove. This property varies with the level of cross-reactivity of TCRs; some TCRs are particularly hyper cross-reactive while others exhibit greater specificity. To elucidate the mechanism behind these differences, we studied five TCRs in complex with the same class II MHC (1Ab )-peptide (3K), that are known to exhibit different levels of cross-reactivity. Although these complexes have similar binding affinities, the interface areas between the TCR and the peptide-MHC (pMHC) differ significantly. We investigated static and dynamic structural features of the TCR-pMHC complexes and of TCRs in a free state, as well as the relationship between binding affinity and interface area. It was found that the TCRs known to exhibit lower levels of cross-reactivity bound to pMHC using an induced-fitting mechanism, forming large and tight interfaces rich in specific hydrogen bonds. In contrast, TCRs known to exhibit high levels of cross-reactivity used a more rigid binding mechanism where non-specific π-interactions involving the bulky Trp residue in CDR3β dominated. As entropy loss upon binding in these highly degenerate and rigid TCRs is smaller than that in less degenerate TCRs, they can better tolerate changes in residues distal from the major contacts with MHC-bound peptide. Hence, our dynamics study revealed that differences in the peptide recognition mechanisms by TCRs appear to correlate with the levels of T-cell cross-reactivity.
Keywords: CH-π interactions; binding affinity-interface area relationship; cross-reactive T-cell receptor recognition; fragment molecular orbital method; molecular dynamics simulation.
© 2017 John Wiley & Sons Ltd.
Figures

References
-
- Yin Y, Mariuzza RA. The multiple mechanisms of T cell receptor cross‐reactivity. Immunity 2009; 31:849–51. - PubMed
-
- Mason D. A very high level of crossreactivity is an essential feature of the T‐cell receptor. Immunol Today 1998; 19:395–404. - PubMed
-
- Huseby ES, White J, Crawford F, Vass T, Becker D, Pinilla C et al How the T cell repertoire becomes peptide and MHC specific. Cell 2005; 122:247–60. - PubMed
Publication types
MeSH terms
Substances
LinkOut - more resources
Full Text Sources
Other Literature Sources
Research Materials
Miscellaneous
