. 2018 Oct 15;180(Pt A):301-311.
doi: 10.1016/j.neuroimage.2017.10.011. Epub 2017 Oct 7.

Decoding spoken phonemes from sensorimotor cortex with high-density ECoG grids

Affiliations

Decoding spoken phonemes from sensorimotor cortex with high-density ECoG grids

N F Ramsey et al. Neuroimage. .

Abstract

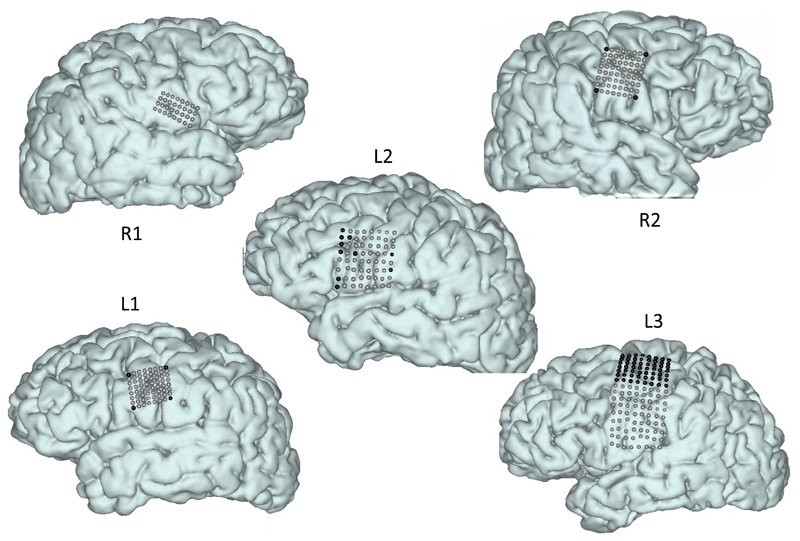
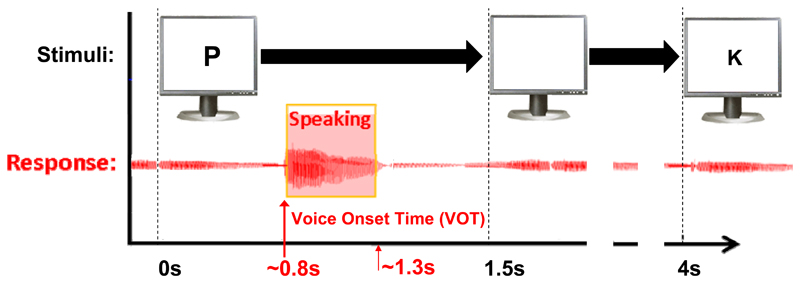
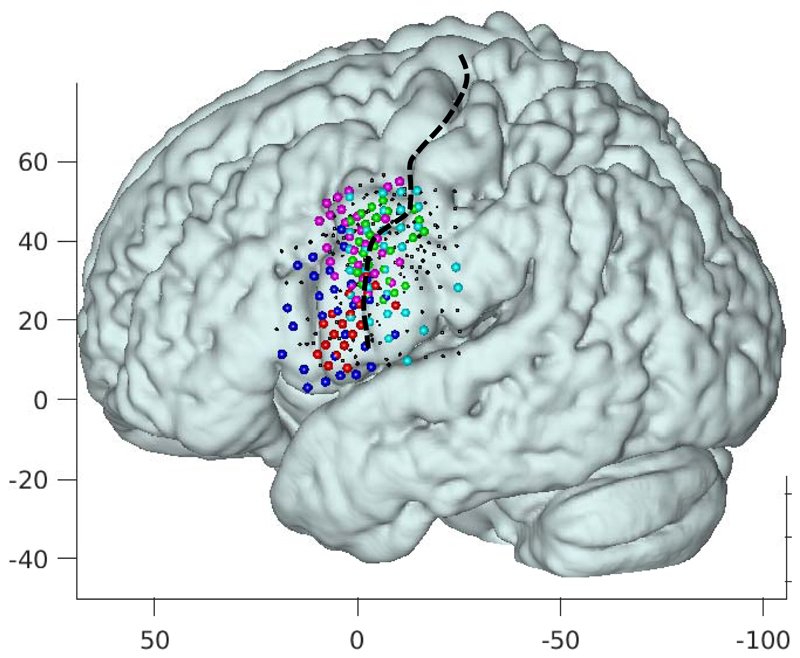
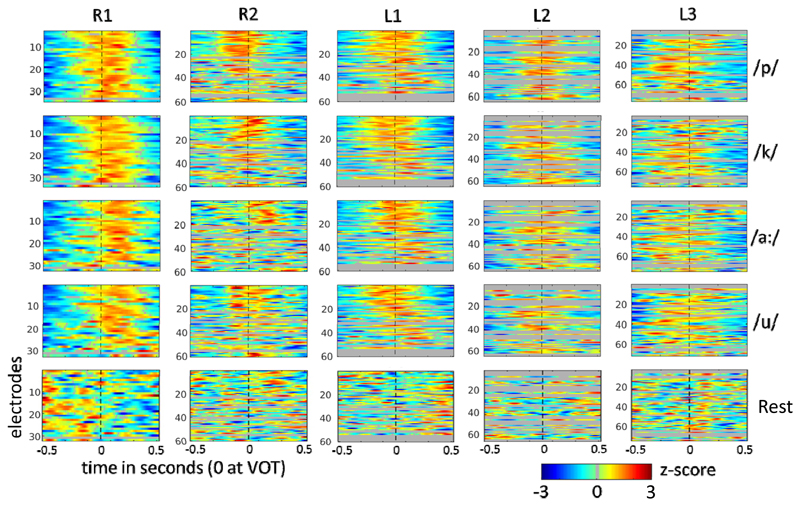
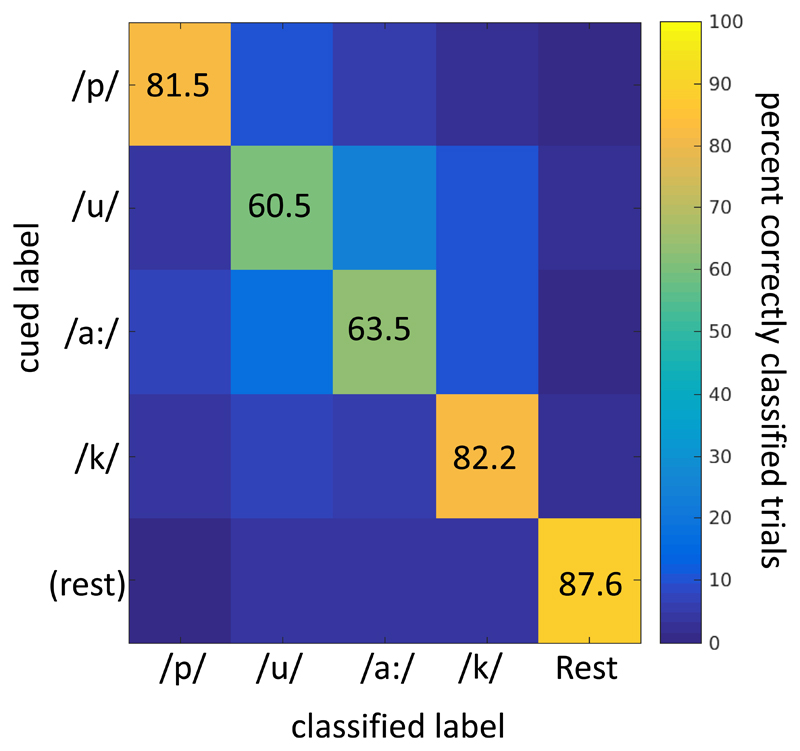
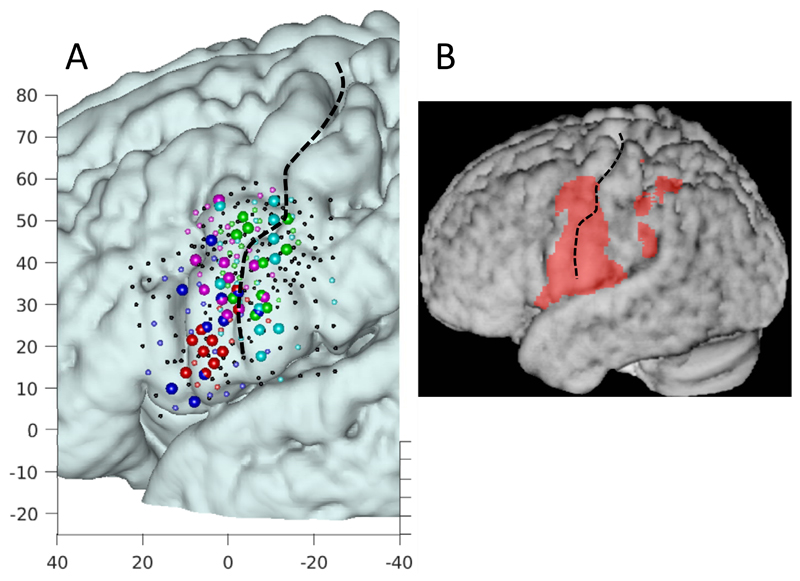
For people who cannot communicate due to severe paralysis or involuntary movements, technology that decodes intended speech from the brain may offer an alternative means of communication. If decoding proves to be feasible, intracranial Brain-Computer Interface systems can be developed which are designed to translate decoded speech into computer generated speech or to instructions for controlling assistive devices. Recent advances suggest that such decoding may be feasible from sensorimotor cortex, but it is not clear how this challenge can be approached best. One approach is to identify and discriminate elements of spoken language, such as phonemes. We investigated feasibility of decoding four spoken phonemes from the sensorimotor face area, using electrocorticographic signals obtained with high-density electrode grids. Several decoding algorithms including spatiotemporal matched filters, spatial matched filters and support vector machines were compared. Phonemes could be classified correctly at a level of over 75% with spatiotemporal matched filters. Support Vector machine analysis reached a similar level, but spatial matched filters yielded significantly lower scores. The most informative electrodes were clustered along the central sulcus. Highest scores were achieved from time windows centered around voice onset time, but a 500 ms window before onset time could also be classified significantly. The results suggest that phoneme production involves a sequence of robust and reproducible activity patterns on the cortical surface. Importantly, decoding requires inclusion of temporal information to capture the rapid shifts of robust patterns associated with articulator muscle group contraction during production of a phoneme. The high classification scores are likely to be enabled by the use of high density grids, and by the use of discrete phonemes. Implications for use in Brain-Computer Interfaces are discussed.

Keywords: Brain-computer interface; Decoding; ECoG; Language; Phonemes.


Figures

Figure 1
Figure 1
Localization of HD-ECoG electrodes used for decoding. Each electrode location is indicated by a sphere on the cortical surface. Black spheres indicate electrodes that were excluded from analysis due to either orientation (facing the skull), position outside of the target region, or poor signal quality. Some electrodes seem out of line within grids, but this is due to correction for brain shift (Branco et al., 2016; Hermes et al., 2010).
Figure 2
Figure 2
The phoneme production task with timing of the stimuli. The lower part displays the aligned audio signal which was used to determine the onset of the phoneme production.
Figure 3
Figure 3
All electrode grids projected onto the left hemisphere in MNI space (projected onto an average of 12 normal brains). Each color denotes the electrodes with a significant response to the task (as described in the methods for STMFs) of a different patient with red, magenta, green, blue, and cyan corresponding to subject R1, R2, L1, L2, and L3 respectively. The central sulcus is indicted with a black broken line. Axes indicate MNI coordinates
Figure 4
Figure 4
All STMFs for all subjects and classes. The mean HFB responses (over trials and leave-one-out training sets) for each class, converted to z-scores, are shown, with time relative to the voice onset time (VOT) on the x-axis and electrodes on the y-axis. Grey lines represent electrodes that were excluded from classification (explained in Methods). Dotted vertical lines indicate the VOT marker.
Figure 5
Figure 5
STMF group-mean classification confusion matrix for 5-class classification. The y-axis indicates the presented cue, the x-axis indicates the assigned class. The scores are given as percentages of all cued trials.
Figure 6
Figure 6
A: Localizations of informative electrodes. For each patient a different color is used, with red, magenta, green, blue, and cyan corresponding to subject R1, R2, L1, L2, and L3 respectively. For display purposes the 10 most informative electrodes are shown as larger spheres and the remaining significant electrodes are show as smaller colored spheres. Axes denote MNI coordinates. B: Activity averaged across 12 healthy volunteers measured with the phoneme task with 7 Tesla fMRI (see Methods). Electrodes and fMRI activity are displayed in MNI space, projected onto an average anatomy of 12 healthy volunteers.

Similar articles

Cited by

References

    1. Andersson P, Pluim JPW, Siero JCW, Klein S, Viergever MA, Ramsey NF. Real-time decoding of brain responses to visuospatial attention using 7T fMRI. PloS One. 2011;6:e27638. doi: 10.1371/journal.pone.0027638. - DOI - PMC - PubMed
    1. Andersson P, Pluim JPW, Viergever MA, Ramsey NF. Navigation of a telepresence robot via covert visuospatial attention and real-time fMRI. Brain Topogr. 2013;26:177–185. doi: 10.1007/s10548-012-0252-z. - DOI - PMC - PubMed
    1. Blakely T, Miller KJ, Rao RPN, Holmes MD, Ojemann JG. Localization and classification of phonemes using high spatial resolution electrocorticography (ECoG) grids. Conf Proc Annu Int Conf IEEE Eng Med Biol Soc IEEE Eng Med Biol Soc Annu Conf. 2008;2008:4964–4967. doi: 10.1109/IEMBS.2008.4650328. - DOI - PubMed
    1. Bleichner MG, Freudenburg ZV, Jansma JM, Aarnoutse EJ, Vansteensel MJ, Ramsey NF. Give me a sign: decoding four complex hand gestures based on high-density ECoG. Brain Struct Funct. 2016;221:203–216. doi: 10.1007/s00429-014-0902-x. - DOI - PMC - PubMed
    1. Bleichner MG, Jansma JM, Salari E, Freudenburg ZV, Raemaekers M, Ramsey NF. Classification of mouth movements using 7 T fMRI. J Neural Eng. 2015;12 doi: 10.1088/1741-2560/12/6/066026. 66026. - DOI - PubMed

Publication types