. 2017 Dec 19;10(12):1439-1451.
doi: 10.1242/dmm.026922.

Mecp2 regulates tnfa during zebrafish embryonic development and acute inflammation

Affiliations

Mecp2 regulates tnfa during zebrafish embryonic development and acute inflammation

M van der Vaart et al. Dis Model Mech. .

Abstract

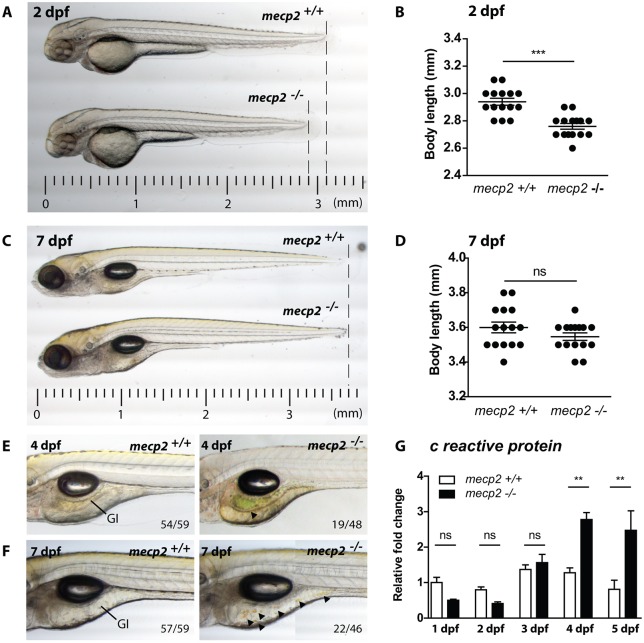
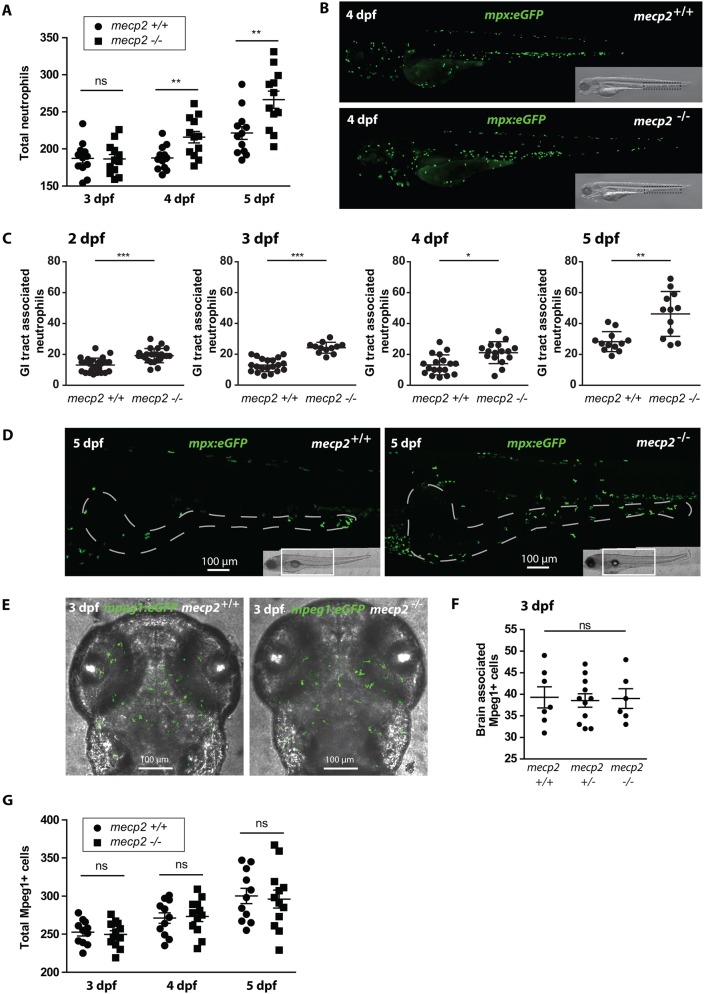
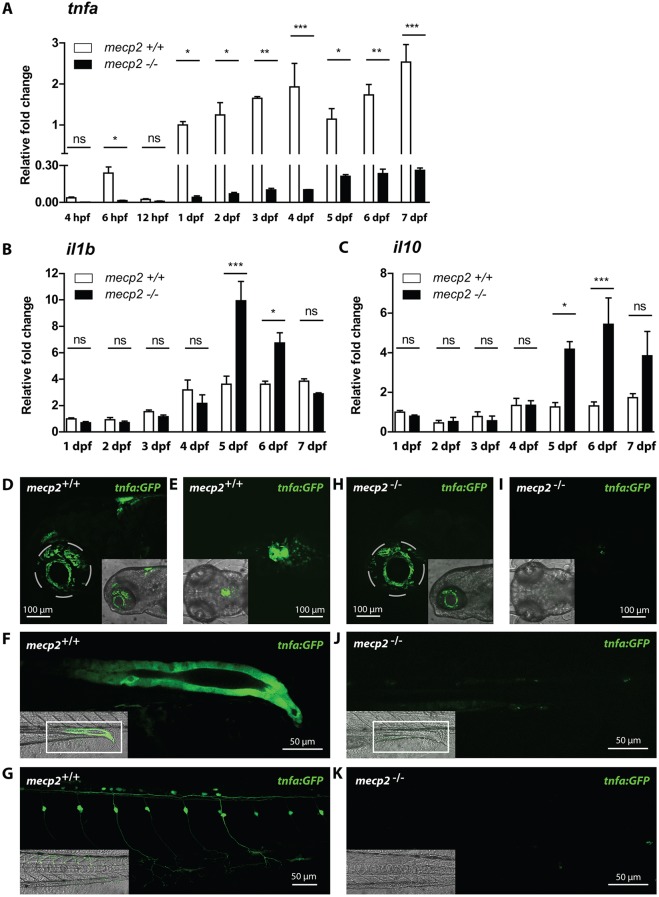
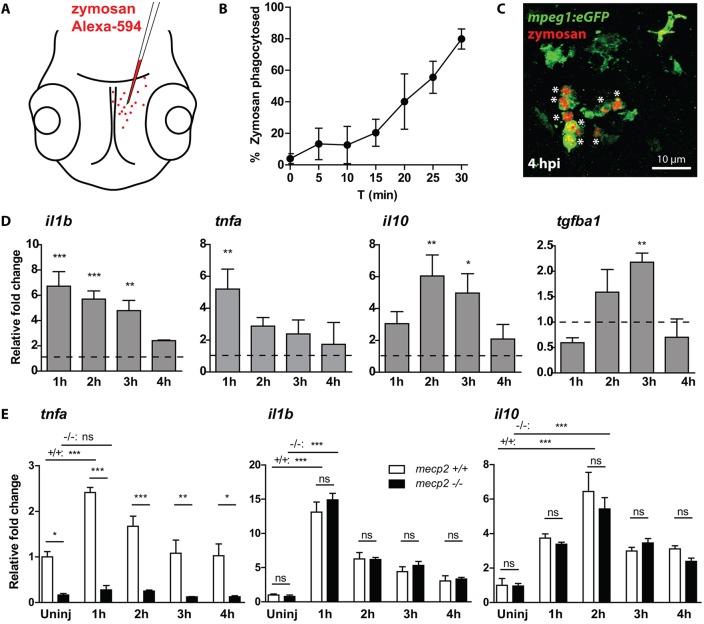
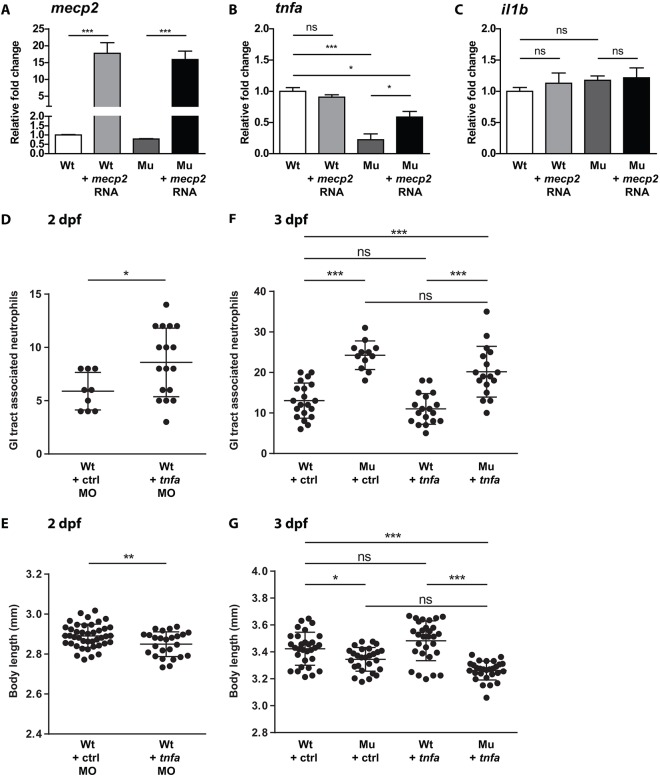
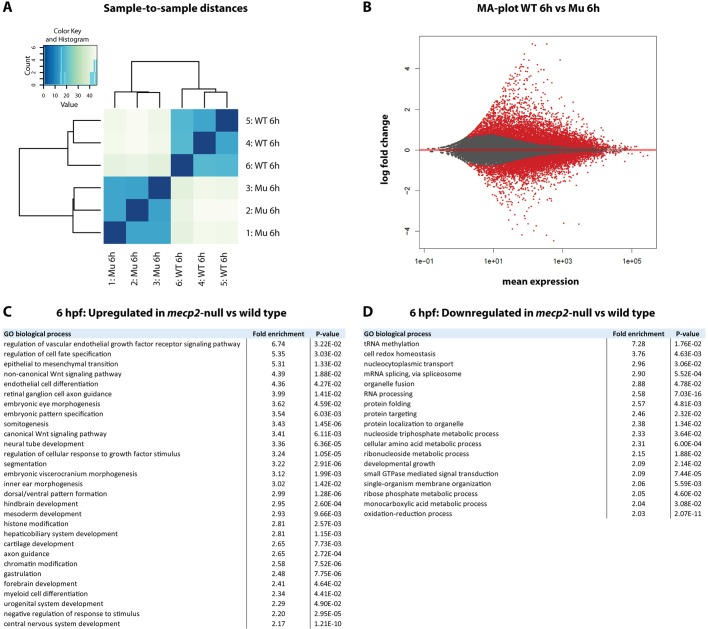
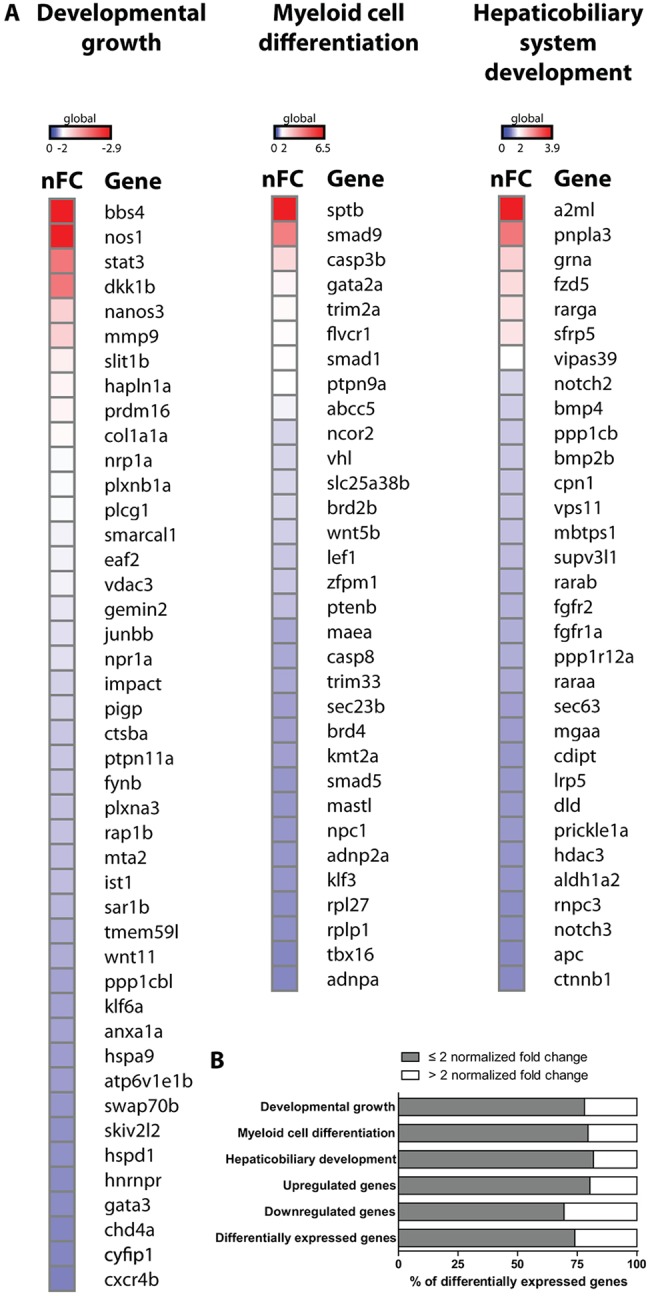
Mutations in MECP2 cause Rett syndrome, a severe neurological disorder with autism-like features. Duplication of MECP2 also causes severe neuropathology. Both diseases display immunological abnormalities that suggest a role for MECP2 in controlling immune and inflammatory responses. Here, we used mecp2-null zebrafish to study the potential function of Mecp2 as an immunological regulator. Mecp2 deficiency resulted in an increase in neutrophil infiltration and upregulated expression of the pro- and anti-inflammatory cytokines Il1b and Il10 as a secondary response to disturbances in tissue homeostasis. By contrast, expression of the proinflammatory cytokine tumor necrosis factor alpha (Tnfa) was consistently downregulated in mecp2-null animals during development, representing the earliest developmental phenotype described for MECP2 deficiency to date. Expression of tnfa was unresponsive to inflammatory stimulation, and was partially restored by re-expression of functional mecp2 Thus, Mecp2 is required for tnfa expression during zebrafish development and inflammation. Finally, RNA sequencing of mecp2-null embryos revealed dysregulated processes predictive for Rett syndrome phenotypes.

Keywords: Inflammation; Rett syndrome; Zebrafish; mecp2; tnfa.


Conflict of interest statement

Competing interestsThe authors declare no competing or financial interests.

Figures

Fig. 1.
Fig. 1.
mecp2-deficient zebrafish display inflammation during larval development. (A,C) Representative stereo microscopy images of 2 dpf and 7 dpf wild-type and mecp2-null zebrafish larvae. (B,D) Total body lengths of the 2 dpf and 7 dpf wild-type and mecp2-null larvae, as measured in millimeters (n=15 per condition; Student’s t-test; ***P<0.001; data are representative of three individual experiments). (E,F) Stereo microscopy images of 4 dpf and 7 dpf wild-type and mecp2-null zebrafish illustrating the GI tract phenotypes regularly observed (indicated by arrowheads). The frequency of these phenotypes is shown in relation to the total number of examined animals (19 of 48 mecp2-null animals at 3 dpf; 22 of 46 mecp2-null animals at 7 dpf). (G) qPCR was performed to determine the whole-organism gene expression level of the inflammation marker crp relative to the expression of the housekeeping gene tbp. Wild-type and mecp2-null samples (n=3 with 20 embryos or larvae pooled per sample) were taken every day for the first 5 days of development. The relative fold change versus gene expression in a 1 dpf wild type is shown (one-way ANOVA with Tukey's post hoc test; **P<0.01; ns, not significant; data are representative of two individual experiments).
Fig. 2.
Fig. 2.
Neutrophil number and distribution confirm the presence of inflammation in mecp2-null larvae. (A) Total numbers of Tg(mpx:eGFP)-positive neutrophils were counted in 3, 4 and 5 dpf wild-type and mecp2-null larvae using stereo fluorescent microscopy (n=12 larvae per condition pooled from two individual experiments; larvae were scored for three consecutive days). (B) Representative stereo microscopy images of 4 dpf Tg(mpx:eGFP) wild-type and mecp2-null larvae. (C) Numbers of Tg(mpx:eGFP)-positive neutrophils associated with the GI tract of 2, 3, 4 and 5 dpf wild-type and mecp2-null larvae were counted (n≥12 embryos per condition; data are representative of three individual experiments). (D) Representative confocal micrographs (maximum projection) of the GI tracts of 5 dpf Tg(mpx:eGFP) wild-type and mecp2-null larvae in which the GI tract has been delineated with a white dashed line based on the transmitted light images. (E) Representative confocal micrographs (maximum projection) of the brain region of 3 dpf Tg(mpeg1:eGFP) wild-type and mecp2-null larvae. (F) Brain-associated Tg(mpeg1:eGFP)-positive cells were counted for 3 dpf wild-type, heterozygous and mecp2-null larvae (n=7, n=11, n=6, respectively; one-way ANOVA with Tukey's post hoc test; ns, not significant; data are representative of two individual experiments). (G) Total numbers of Tg(mpeg1:eGFP)-positive cells were counted in 3, 4 and 5 dpf wild-type and mecp2-null larvae using stereo fluorescent microscopy (n=11 and n=12 embryos per condition, respectively; data are representative of two individual experiments). A Student’s t-test was used for all statistical analyses, except for the data analyzed in F, by comparing wild-type and mecp2-null numbers per day (***P<0.001; **P<0.01; *P<0.05; ns, not significant).
Fig. 3.
Fig. 3.
Expression of central inflammatory cytokines is dysregulated in mecp2-null larvae. (A,B,C) qPCR was performed to determine the whole-organism expression of tnfa from 4 hpf to 7 dpf (A), and il1b and il10 from 1 dpf to 7 dpf (B,C), in wild-type or mecp2-null zebrafish. Gene expression is related to the expression of the housekeeping gene tbp, where the fold change relative to gene expression in 1 dpf wild-type embryos is shown (n=3 with 20 embryos or larvae pooled per sample for 1-7 dpf; 30 embryos were pooled per sample for the 4-12 hpf time points; data are representative of two individual experiments). One-way ANOVA with Tukey's post hoc test was used for all statistical analyses (***P<0.001; **P<0.01; *P<0.05; ns, not significant). (D-K) Representative confocal micrographs of 3 dpf Tg(tnfa:eGFP) wild-type and mecp2-null larvae showing the eGFP expression pattern in brain regions in a lateral view (D,H), brain regions in a dorsal view (E,I), posterior gut epithelium in a lateral view (F,J) and dorsal root ganglion neurons in a lateral view (G,K).
Fig. 4.
Fig. 4.
mecp2-null larvae are unable to increase tnfa expression during an acute inflammatory response. (A) Schematic of the injection of Alexa Fluor 594-labeled zymosan into the brains of 3 dpf zebrafish larvae. (B) The percentage of zymosan particles phagocytosed by Tg(mpeg1:eGFP)-positive cells in wild-type larvae was determined using confocal microscopy of samples fixed every 5 min after injection (n=5 larvae per time point). (C) Representative confocal micrograph of a wild-type Tg(mpeg1:eGFP) larva at 4 hpi. Asterisks indicate zymosan particles phagocytosed by Tg(mpeg1:eGFP)-positive cells. (D) qPCR was performed to determine the whole-organism gene expression level of il1b, tnfa, il10 and tgfb1 relative to the expression of the housekeeping gene tbp. Samples (n=3 with 10 embryos per sample) were taken at 1, 2, 3 and 4 hpi of zymosan or PBS as a control. The relative fold change of zymosan- versus PBS-injected samples is shown for each time point to account for a possible wounding effect by the injection itself. (E) qPCR was performed to determine the whole-organism expression level of il1b, tnfa, il10 and tgfb1 relative to the expression of the housekeeping gene tbp. Wild-type or mecp2-null samples (n=3 with 10 embryos per sample) were taken at 1, 2, 3 and 4 hpi of zymosan. The relative fold change of zymosan-injected larvae versus uninjected wild-type controls is shown for each time point to not exclude a potential different response in mecp2-null samples towards the wound caused by the injection. One-way ANOVA with Tukey's post hoc test was used for all statistical analyses (***P<0.001; **P<0.01; *P<0.05; ns, not significant; data are representative of at least two individual experiments).
Fig. 5.
Fig. 5.
Re-expression of mecp2 in mecp2-null zebrafish embryos partially rescues tnfa gene expression, while enforced expression of tnfa does not alleviate phenotypes caused by Mecp2 deficiency. (A,B,C) Wild-type and mecp2-null one-cell stage embryos were injected with 50 pg of full-length mecp2 mRNA. qPCR was performed to determine the whole-organism gene expression level of mecp2 (A), tnfa (B) and il1b (C), relative to the expression of the housekeeping gene tbp. Wild-type and mecp2-null samples (n=3 with 30 embryos pooled per sample) were taken at 24 hpf. The relative fold change of each condition versus uninjected wild-type controls is shown. (D,E) Oligonucleotide morpholino targeting tnfa expression was injected as previously described by Candel et al. (2014). Numbers of Tg(mpx:eGFP)-positive neutrophils associated with the GI tract of 2 dpf control and tnfa morpholino-injected larvae were counted (n≥9 embryos per condition) (D), and the total body lengths of 2 dpf control and tnfa morpholino-injected larvae (n≥25 per condition) were measured (E). (F,G) Wild-type and mecp2-null one-cell stage embryos were injected with tnfa cDNA-containing plasmids as previously described by López-Muñoz et al. (2011). Numbers of Tg(mpx:eGFP)-positive neutrophils associated with the GI tract of 3 dpf wild-type or mecp2-null larvae (injected with control or tnfa cDNA-containing plasmids) were counted (n≥12 embryos per condition) (F), and the total body lengths of the larvae were measured (n≥26 embryos per condition) (G). One-way ANOVA with Tukey's post hoc test was used for all statistical analyses involving more than two groups. Student's t-test was used for all statistical analyses comparing two groups (***P<0.001; **P<0.01; *P<0.05; ns, not significant; data are representative of at least two individual experiments).
Fig. 6.
Fig. 6.
RNA sequencing reveals early developmental effects of mecp2 deficiency relevant to RTT. RNA sequencing was performed on RNA isolated from groups of 6 hpf wild-type and mecp2-null embryos (n=3 biological replicates per condition with 30 embryos pooled per replicate). DESeq2 analysis was performed using http://usegalaxy.org/. (A) A sample-to-sample distances plot for the three biological replicates per condition was used to detect potential outliers. (B) An MA-plot of differential expression caused by Mecp2 deficiency is shown. The log2 fold change is plotted on the y-axis and the average of the counts normalized by size factor is shown on the x-axis. Each gene is represented by a dot. Genes with an adjusted P value <0.05 are shown in red. (C,D) Enriched GO processes for significantly up- or downregulated genes in mecp2-null versus wild-type embryos are listed in the tables. Only GO terms with at least twofold enrichment are shown. For hierarchically clustered GO terms, only the most specific term is included in the list.
Fig. 7.
Fig. 7.
Heatmap of differentially expressed genes in mecp2-null embryos. (A) Heatmap displaying the extent of differential gene expression between 6 hpf mecp2-null versus wild-type embryos. The genes incorporated in the heatmap represent all differentially expressed genes that belong to the GO terms ‘developmental growth’ (downregulated genes), ‘myeloid cell differentiation’ (upregulated genes) and ‘hepaticobiliary system development’ (upregulated genes). For all genes, the positive or negative normalized fold change (nFC) for mecp2-null embryos versus wild-type embryos is shown. (B) The graph displays the percentage of significantly differentially expressed genes in mecp2-null versus wild-type embryos with a fold change ≤2 or >2. The following groups are shown: significantly differentially expressed genes belonging to the GO terms ‘developmental growth’, ‘myeloid cell differentiation’ and ‘hepaticobiliary system development’; genome-wide significantly upregulated genes; genome-wide significantly downregulated genes; and all significantly differentially expressed genes.

Similar articles

Cited by

References

    1. Akira S. and Takeda K. (2004). Toll-like receptor signalling. Nat. Rev. Immunol. 4, 499-511. 10.1038/nri1391 - DOI - PubMed
    1. Amir R. E., Veyver I. B., Wan M., Tran C. Q., Francke U. and Zoghbi H. Y. (1999). Rett syndrome is caused by mutations in X-linked MECP2, encoding methyl-CpG-binding protein 2. Nat. Genet. 23, 185-188. 10.1038/13810 - DOI - PubMed
    1. Baikie G., Ravikumara M., Downs J., Naseem N., Wong K., Percy A., Lane J., Weiss B., Ellaway C., Bathgate K. et al. (2014). Gastrointestinal Dysmotility in Rett Syndrome. J. Pediatr. Gastr. Nutr. 58, 237 10.1097/MPG.0000000000000200 - DOI - PubMed
    1. Ballestar E., Yusufzai T. M. and Wolffe A. P. (2000). Effects of Rett syndrome mutations of the methyl-CpG binding domain of the transcriptional repressor MeCP2 on selectivity for association with methylated DNA. Biochemistry 39, 7100-7106. 10.1021/bi0001271 - DOI - PubMed
    1. Baubec T., Ivánek R., Lienert F. and Schübeler D. (2013). Methylation-Dependent and -Independent Genomic Targeting Principles of the MBD Protein Family. Cell 153, 480-492. 10.1016/j.cell.2013.03.011 - DOI - PubMed

Publication types

MeSH terms

Substances