. 2017 Nov 22;61(12):e00618-17.
doi: 10.1128/AAC.00618-17. Print 2017 Dec.

A Dynamic Stress Model Explains the Delayed Drug Effect in Artemisinin Treatment of Plasmodium falciparum

Affiliations

A Dynamic Stress Model Explains the Delayed Drug Effect in Artemisinin Treatment of Plasmodium falciparum

Pengxing Cao et al. Antimicrob Agents Chemother. .

Abstract

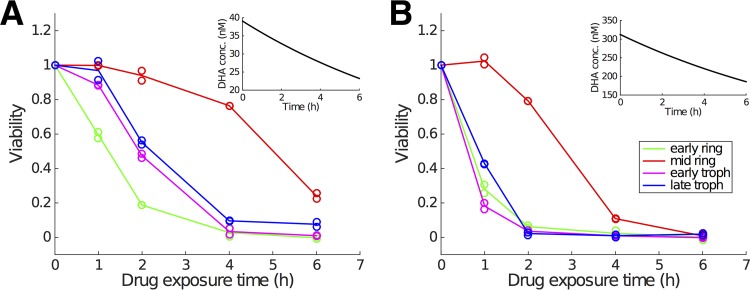
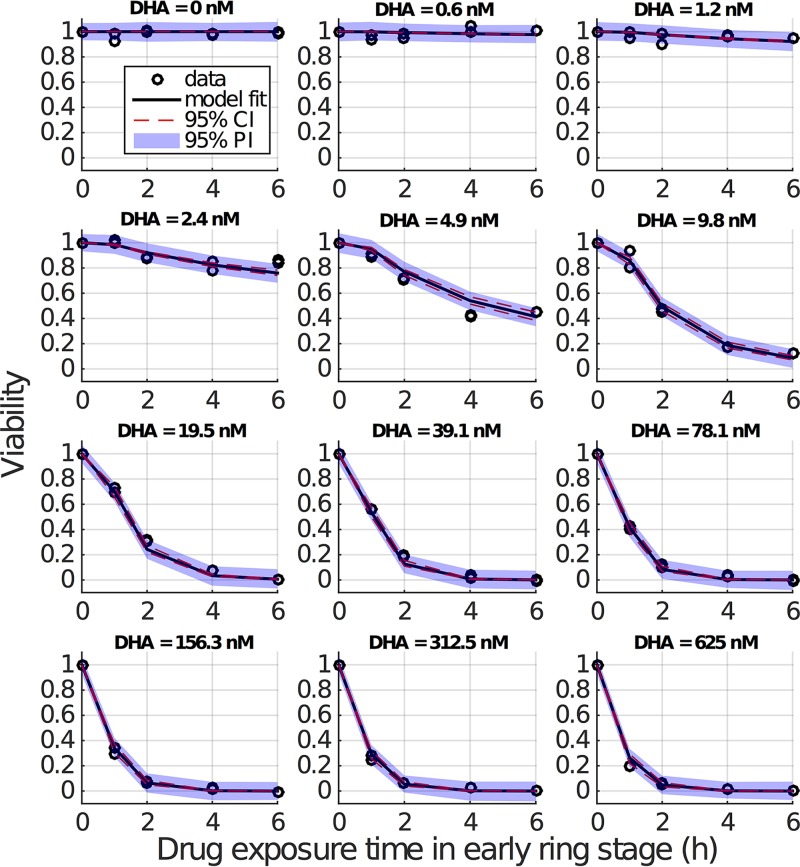
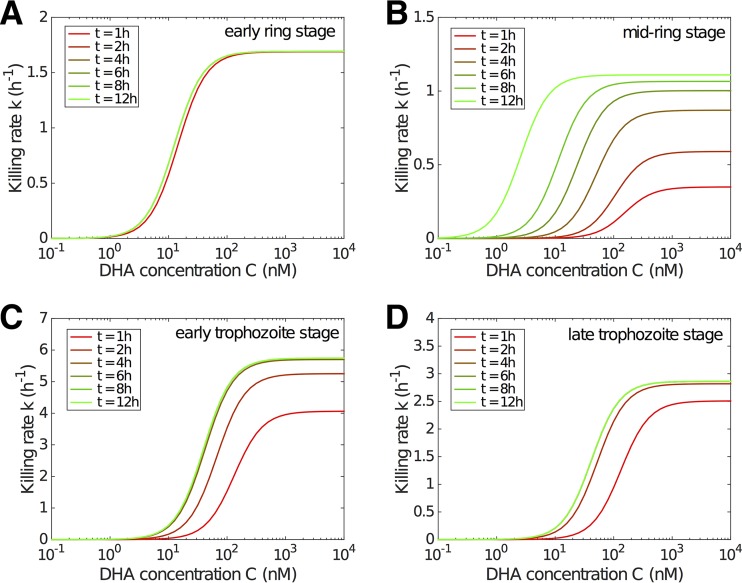
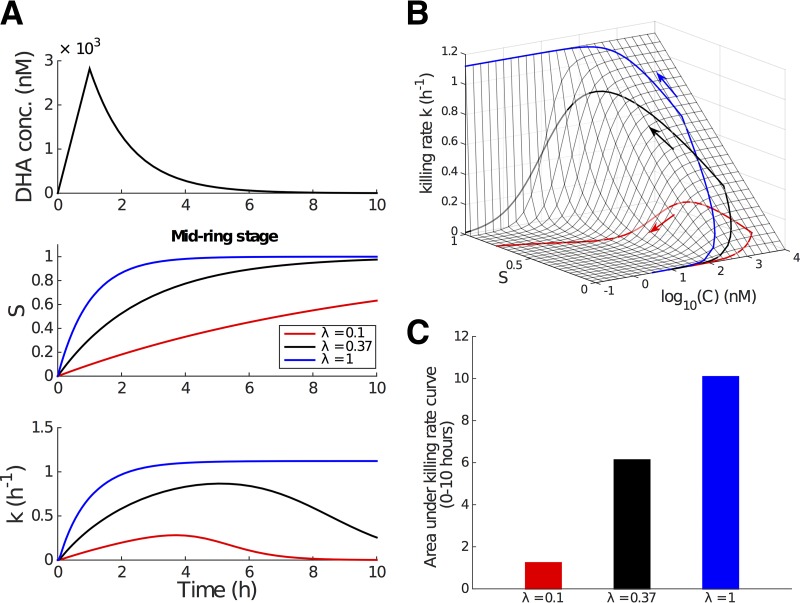
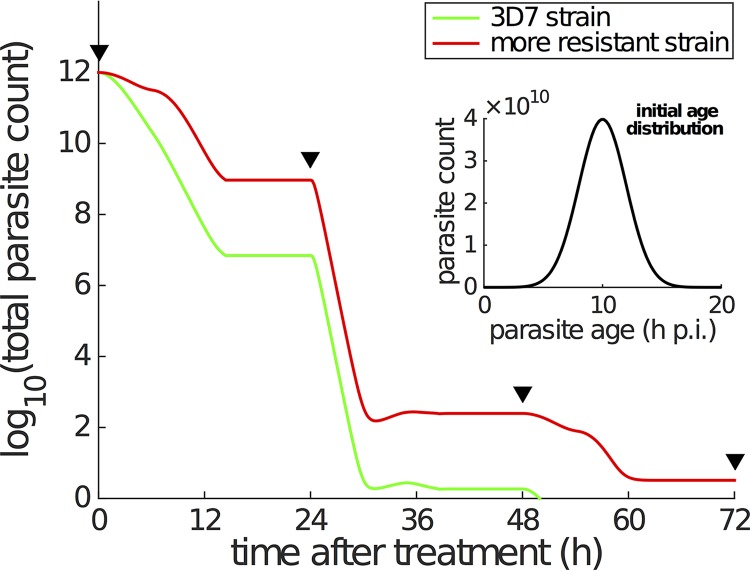
Artemisinin resistance constitutes a major threat to the continued success of control programs for malaria, particularly in light of developing resistance to partner drugs. Improving our understanding of how artemisinin-based drugs act and how resistance manifests is essential for the optimization of dosing regimens and the development of strategies to prolong the life span of current first-line treatment options. Recent short-drug-pulse in vitro experiments have shown that the parasite killing rate depends not only on drug concentration but also the exposure time, challenging the standard pharmacokinetic-pharmacodynamic (PK-PD) paradigm in which the killing rate depends only on drug concentration. Here, we introduce a dynamic stress model of parasite killing and show through application to 3D7 laboratory strain viability data that the inclusion of a time-dependent parasite stress response dramatically improves the model's explanatory power compared to that of a traditional PK-PD model. Our model demonstrates that the previously reported hypersensitivity of early-ring-stage parasites of the 3D7 strain to dihydroartemisinin compared to other parasite stages is due primarily to a faster development of stress rather than a higher maximum achievable killing rate. We also perform in vivo simulations using the dynamic stress model and demonstrate that the complex temporal features of artemisinin action observed in vitro have a significant impact on predictions for in vivo parasite clearance. Given the important role that PK-PD models play in the design of clinical trials for the evaluation of alternative drug dosing regimens, our novel model will contribute to the further development and improvement of antimalarial therapies.

Keywords: Plasmodium falciparum; artemisinin action; drug exposure time; dynamic model.


Figures

FIG 1
FIG 1
Representative experimental data showing how the fraction of viable parasite (i.e., viability) changes with the duration of drug exposure for two different initial DHA concentrations (39 nM [left] and 300 nM [right]) and four different parasite life stages. For one parasite stage and one drug exposure time in each panel, duplicate viability measurements are provided, which means in total 40 data points are measured in each panel (note that viability for zero exposure time is always equal to 1 due to normalizing parasitemia to itself). Insets indicate the in vitro decay of DHA concentration. Empty circles display the raw viability data, and the curves pass through the arithmetic means of the paired data points. (Data are sourced from reference .)
FIG 2
FIG 2
Results of fitting the model to viability data (early ring stage). The initially applied DHA concentration is indicated for each panel. Empty circles (appearing in duplicate) are the repeated measures of viability by (initial) drug concentration and exposure duration. For one DHA concentration and one drug exposure time in each panel, duplicate viability measurements are provided, which means in total 10 data points are measured in each panel (note that viability for zero exposure time is always equal to 1 due to normalizing parasitemia to itself). Black curves show the predicted mean viability measurements from the model with fixed γ parameter. Red dashed lines are the 95% confidence intervals (CI) for the predicted mean viability measurements (derived using simulation-estimation of 500 concentration-effect profiles and parametric bootstrap CIs), and blue-shaded regions are 95% prediction intervals (PI; derived 2.5th and 97.5th percentiles of 500 simulated concentration-effect profiles) for a new viability measurement if it were generated under the same experimental conditions (i.e., drug concentration and pulse duration).
FIG 3
FIG 3
Model results showing the evolution of the drug concentration-killing rate curve with drug exposure duration for different stages. The time after drug exposure, t, is indicated. Note that the y axis scale differs for different stages.
FIG 4
FIG 4
Dependence of model parameters on parasite life stage. The parameter estimates are provided in Table 1. Error bars show the model-based 95% CI for each parameter. (A) The rate of stress development (λ) is large for early rings, indicating minimal time dependence in killing for this life stage. In contrast for mid-ring-stage parasites, the rate is very small, indicating a substantial accumulation effect. (B) The maximum killing rate is linear in α, indicating that the maximum killing rate is higher in trophozoites than rings. (C and D) Parameters (β1 and β2) model the relationship between stress (S) and the half-maximal drug concentration (equation 8).
FIG 5
FIG 5
Incorporation of the time-dependent killing rate into the PK-PD model. We study the mid-ring stage for illustrative purposes. Parameter values are taken from Table 1. (A) Simulated in vivo DHA concentration profile (upper; the in vivo half-life is approximately 0.9 h [2, 21]), the kinetics for the modulatory stress variable, S (middle; black curve, λ = 0.37), and the transient killing rate S (lower; black curve, λ = 0.37) induced by the drug pulse. The middle and lower panels also show how S and k evolve if λ is higher (blue) or lower (red). (B) Killing rate surface as a function of DHA concentration, C, and the stress, S, and the projection of the trajectory of the effective killing rate (i.e., a projection of the curves in panel A [lower]) onto the surface. (C) Area under the killing rate curve, an indication of the total amount of killing achievable over the course of the drug pulse.
FIG 6
FIG 6
Simulation of parasite killing under a standard treatment of 2 mg/kg artesunate every 24 h. The inset shows the age distribution of a total of 1012 parasites (per patient) at the start of treatment [∼N(10, 22)]. The parasite multiplication factor is assumed to be 10 (6, 13), which means that 10 new parasites are produced once a parasite reaches 48 h p.i. (i.e., r = 10 in the model). The PK profile is a series of repeated DHA concentration profiles every 24 h (i.e., repeated simulations of DHA concentration profile shown in Fig. 5A, upper). The black triangles indicate when the doses are given. The green curve corresponding to the laboratory 3D7 strain is generated using the parameters in Table 1, while the red curve is generated using the same set of parameters except for reducing λ for mid-ring stage to be 0.1 h−1 to simulate a more resistant strain. With limited information, we simply divide the 48-h life cycle into early ring stage (0 to 6 h p.i.), mid-ring stage (6 to 26 h p.i.), early trophozoite (26 to 34 h p.i.), and late trophozoite (34 to 48 h p.i.) in the simulation. The modulatory variable S is assumed to follow equation 6 only when DHA concentration, C, is ≥0.1 nM (i.e., C* = 0.1 nM), and S is immediately reset to zero when the DHA concentration drops below 0.1 nM.

Similar articles

Cited by

References

    1. World Health Organization. 2015. World malaria report, 2015. World Health Organization, Geneva, Switzerland.
    1. Dondorp AM, Nosten F, Yi P, Das D, Phyo AP, Tarning J, Lwin KM, Ariey F, Hanpithakpong W, Lee SJ, Ringwald P, Silamut K, Imwong M, Chotivanich K, Lim P, Herdman T, An SS, Yeung S, Singhasivanon P, Day NP, Lindegardh N, Socheat D, White NJ. 2009. Artemisinin resistance in Plasmodium falciparum malaria. N Engl J Med 361:455–467. doi:10.1056/NEJMoa0808859. - DOI - PMC - PubMed
    1. Phyo AP, Nkhoma S, Stepniewska K, Ashley EA, Nair S, McGready R, ler Moo C, Al-Saai S, Dondorp AM, Lwin KM, Singhasivanon P, Day NP, White NJ, Anderson TJ, Nosten F. 2012. Emergence of artemisinin-resistant malaria on the western border of Thailand: a longitudinal study. Lancet 379:1960–1966. doi:10.1016/S0140-6736(12)60484-X. - DOI - PMC - PubMed
    1. Ariey F, Witkowski B, Amaratunga C, Beghain J, Langlois AC, Khim N, Kim S, Duru V, Bouchier C, Ma L, Lim P, Leang R, Duong S, Sreng S, Suon S, Chuor CM, Bout DM, Menard S, Rogers WO, Genton B, Fandeur T, Miotto O, Ringwald P, Le Bras J, Berry A, Barale JC, Fairhurst RM, Benoit-Vical F, Mercereau-Puijalon O, Menard D. 2014. A molecular marker of artemisinin-resistant Plasmodium falciparum malaria. Nature 505:50–55. doi:10.1038/nature12876. - DOI - PMC - PubMed
    1. Ashley EA, Dhorda M, Fairhurst RM, Amaratunga C, Lim P, Suon S, Sreng S, Anderson JM, Mao S, Sam B, Sopha C, Chuor CM, Nguon C, Sovannaroth S, Pukrittayakamee S, Jittamala P, Chotivanich K, Chutasmit K, Suchatsoonthorn C, Runcharoen R, Hien TT, Thuy-Nhien NT, Thanh NV, Phu NH, Htut Y, Han KT, Aye KH, Mokuolu OA, Olaosebikan RR, Folaranmi OO, Mayxay M, Khanthavong M, Hongvanthong B, Newton PN, Onyamboko MA, Fanello CI, Tshefu AK, Mishra N, Valecha N, Phyo AP, Nosten F, Yi P, Tripura R, Borrmann S, Bashraheil M, Peshu J, Faiz MA, Ghose A, Hossain MA, Samad R, Rahman MR, Hasan MM, Islam A, Miotto O, Amato R, MacInnis B, Stalker J, Kwiatkowski DP, Bozdech Z, Jeeyapant A, Cheah PY, Sakulthaew T, Chalk J, Intharabut B, Silamut K, Lee SJ, Vihokhern B, Kunasol C, Imwong M, Tarning J, Taylor WJ, Yeung S, Woodrow CJ, Flegg JA, Das D, Smith J, Venkatesan M, Plowe CV, Stepniewska K, Guerin PJ, Dondorp AM, Day NP, White NJ; Tracking Resistance to Artemisinin Collaboration (TRAC). 2014. Spread of artemisinin resistance in Plasmodium falciparum malaria. N Engl J Med 371:411–423. doi:10.1056/NEJMoa1314981. - DOI - PMC - PubMed

Publication types

MeSH terms

LinkOut - more resources