. 2017 Dec 1;77(23):6576-6588.
doi: 10.1158/0008-5472.CAN-17-2281. Epub 2017 Oct 9.

Sleeping Beauty Insertional Mutagenesis in Mice Identifies Drivers of Steatosis-Associated Hepatic Tumors

Affiliations

Sleeping Beauty Insertional Mutagenesis in Mice Identifies Drivers of Steatosis-Associated Hepatic Tumors

Barbara R Tschida et al. Cancer Res. .

Abstract

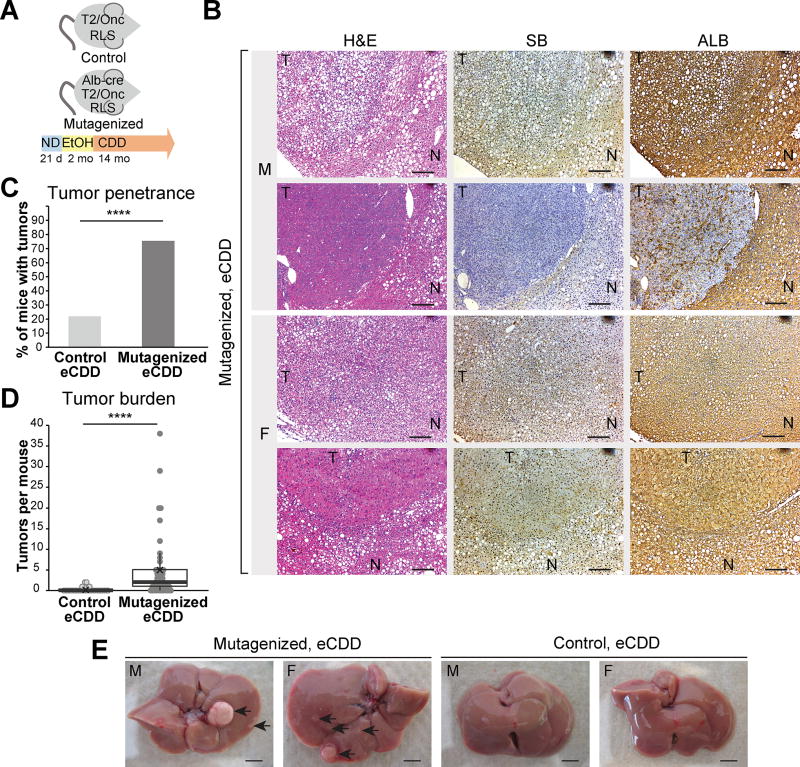
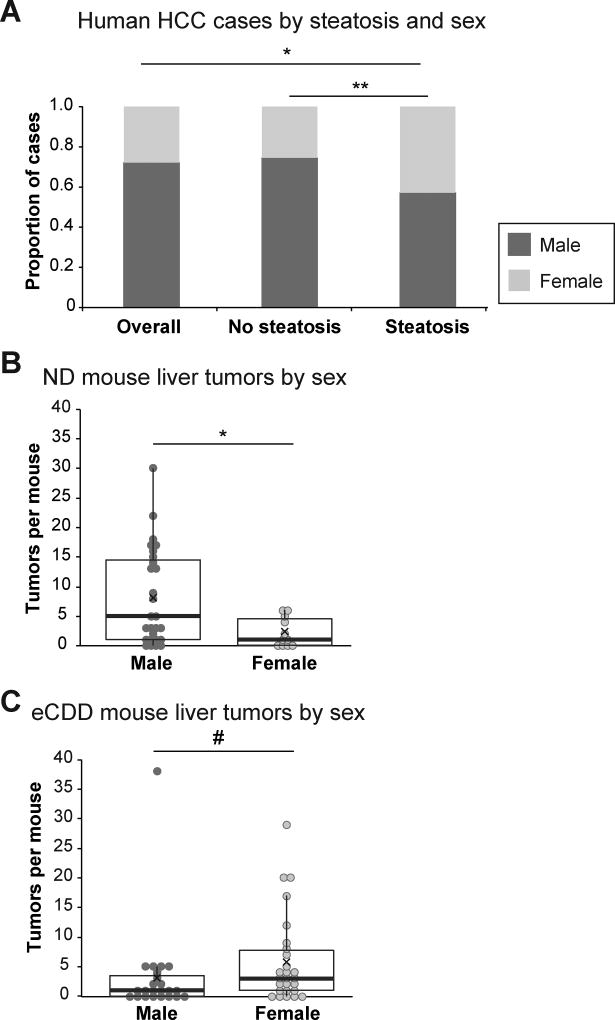
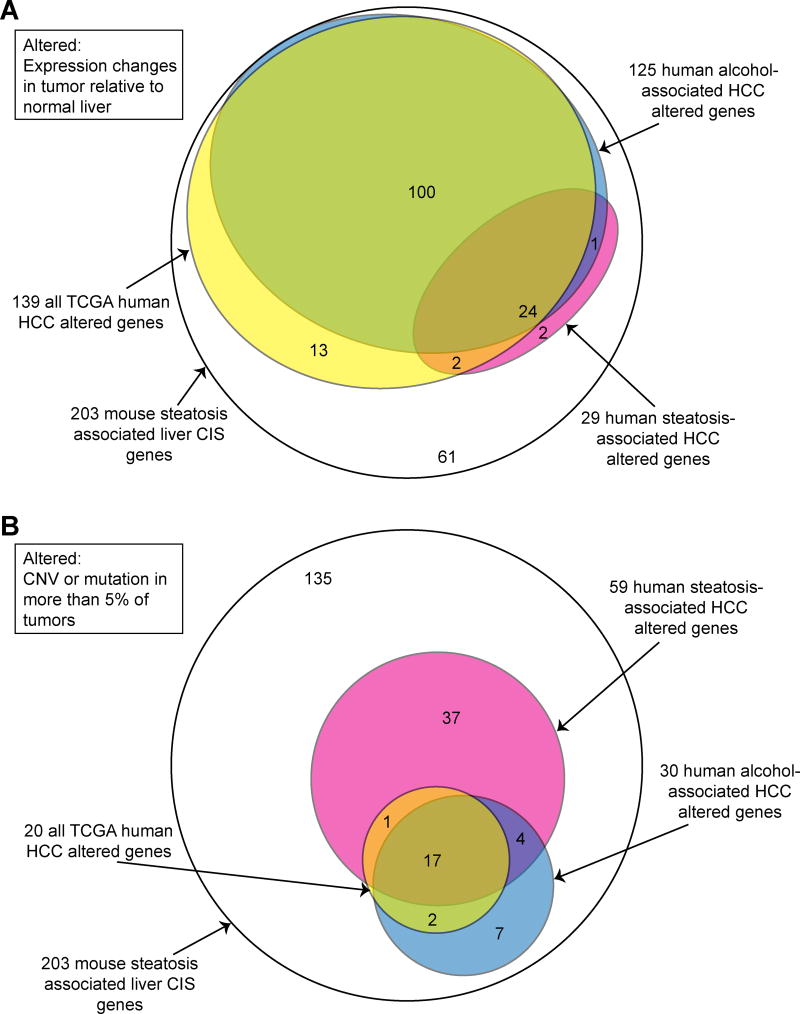
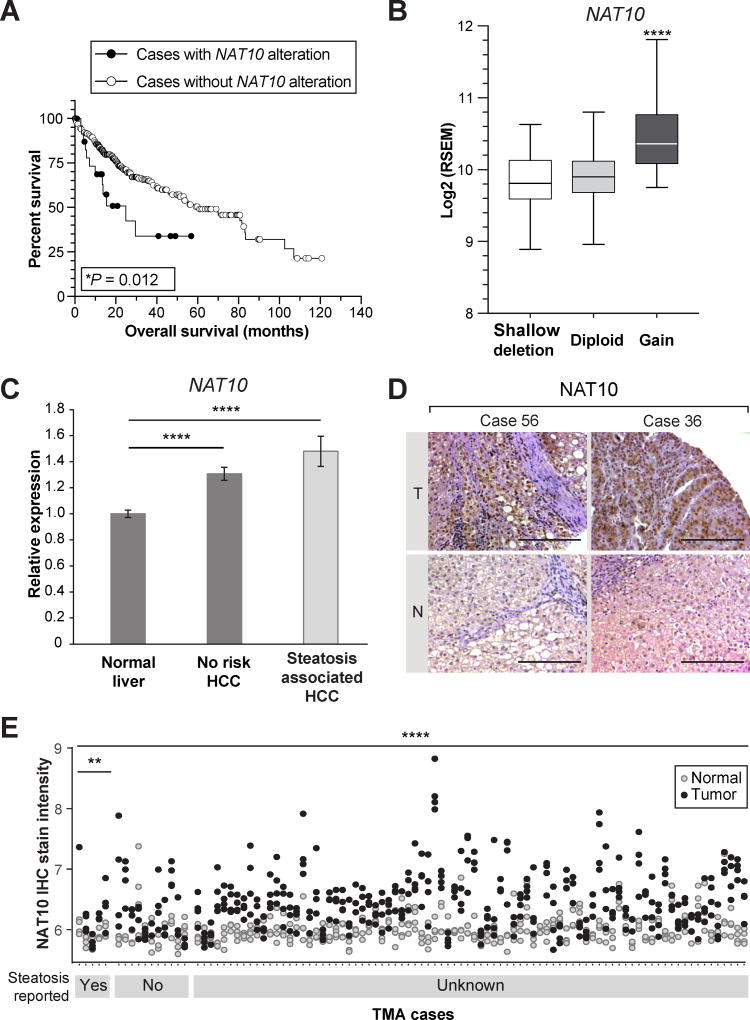
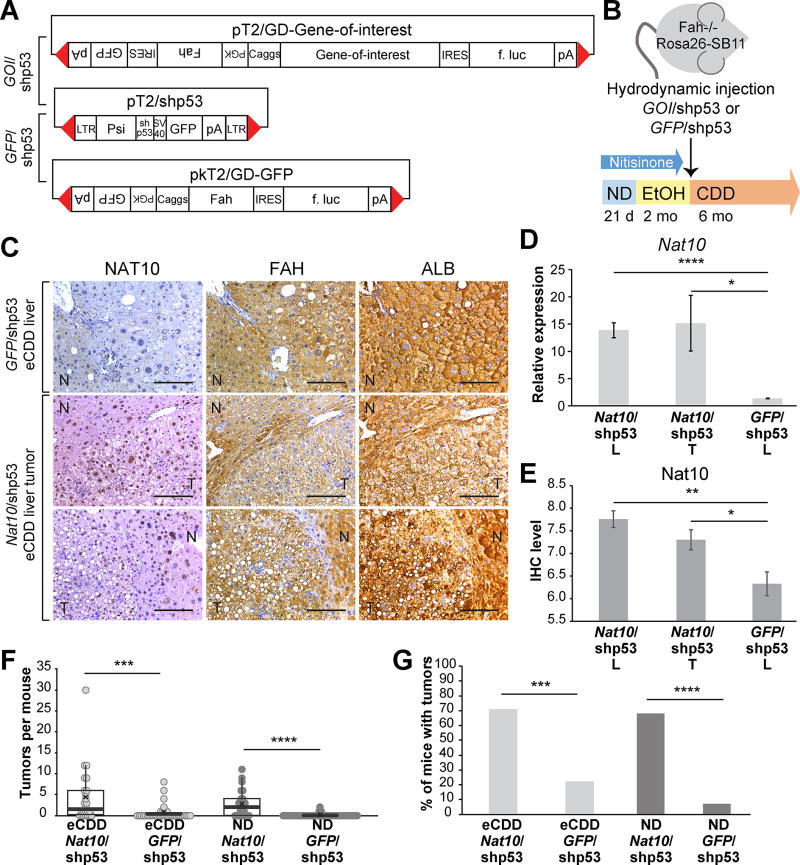
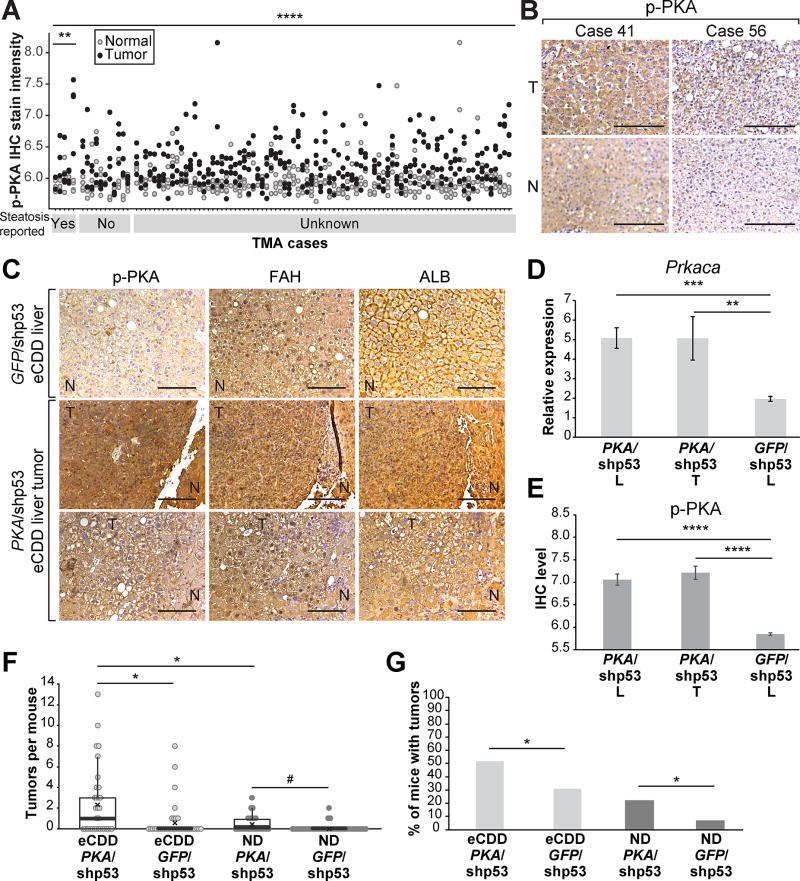
Hepatic steatosis is a strong risk factor for the development of hepatocellular carcinoma (HCC), yet little is known about the molecular pathology associated with this factor. In this study, we performed a forward genetic screen using Sleeping Beauty (SB) transposon insertional mutagenesis in mice treated to induce hepatic steatosis and compared the results to human HCC data. In humans, we determined that steatosis increased the proportion of female HCC patients, a pattern also reflected in mice. Our genetic screen identified 203 candidate steatosis-associated HCC genes, many of which are altered in human HCC and are members of established HCC-driving signaling pathways. The protein kinase A/cyclic AMP signaling pathway was altered frequently in mouse and human steatosis-associated HCC. We found that activated PKA expression drove steatosis-specific liver tumorigenesis in a mouse model. Another candidate HCC driver, the N-acetyltransferase NAT10, which we found to be overexpressed in human steatosis-associated HCC and associated with decreased survival in human HCC, also drove liver tumorigenesis in a steatotic mouse model. This study identifies genes and pathways promoting HCC that may represent novel targets for prevention and treatment in the context of hepatic steatosis, an area of rapidly growing clinical significance. Cancer Res; 77(23); 6576-88. ©2017 AACR.


Figures

Figure 1
Figure 1. SB transposition and eCDD treatment promotes steatosis-associated liver tumorigenesis in mice
(A) Genotype and treatment model. EtOH, 5% ethanol drinking water. CDD, choline-deficient diet. RLS, Rosa26-Lsl-SB11. Alb-cre, Albumin-cre. d, days. mo, months. (B) H&E and immunohistochemistry for SB and ALB-stained mouse liver sections. Liver section scale bars, 100 µm. T, tumor. N, non-tumor liver. (C) Tumor penetrance and (D) box-and-whisker plot of tumor burden in control (n = 32) and SB-mutagenized (n = 49) eCDD-treated mice. (E) Gross livers from SB-mutagenized and control eCDD-treated mice. Arrows, tumors. Gross liver scalebars, 0.5 cm. ****P < .0001. M, male. F, female.
Figure 2
Figure 2. Reduced male liver cancer sex bias with steatosis
(A) Sex distribution of human HCC cases by steatosis status. (n = 460 for overall cohort, 397 for no steatosis cohort, 63 for steatosis cohort) (B) Box-and-whisker plot of tumor burden per ND-treated, SB-mutagenized male (n = 27) and female (n = 11) mouse. (C) Box-and-whisker plot of tumor burden per eCDD-treated, SB-mutagenized male (n = 23) and female (n = 26) mouse. #P > .05. *P < .05. **P < .01.
Figure 3
Figure 3. Steatosis-associated liver cancer CIS genes altered in human HCC
(A) Representation of the 203 CIS genes and subsets with significant expression changes and (B) subsets altered in more than 5% of tumors by amplification, mutation, or deletion in all TCGA HCC cases, steatosis- associated HCC, and alcohol-associated HCC.
Figure 4
Figure 4. NAT10 alterations in human HCC
(A) Overall survival for TCGA HCC cases with and without NAT10 overexpression. (B) NAT10 expression by gene copy number for TCGA HCC cases. (C) NAT10 expression in TCGA no risk HCC and steatosis-associated HCC cases compared to average normal liver. D) Representative immunohistochemistry for NAT10-stained sections of human HCC (top) or matched normal liver (bottom) from tissue microarray (TMA) cases with hepatic steatosis indicated in pathology reports. Scalebars, 100µm. T, tumor. N, non-tumor liver tissue. E) NAT10 immunohistochemistry stain intensity of human HCC and matched normal liver TMA cases stratified by mention of steatosis in pathology report. Yes, steatosis reported. No, no mention of steatosis or steatosis reported absent. Unknown, pathology report not available. *P < .05. **P < .01. ****P < .0001. Error bars, SEM.
Figure 5
Figure 5. Nat10 overexpression drives tumorigenesis in mouse livers
(A) Transposons for tumor induction. Red triangles, SB inverted repeat/ direct repeat sequences. Caggs, Caggs promoter. Gene-of-interest, mouse cDNA sequence for either Nat10 or PrkacaL206R with V5 tag. IRES, internal ribosomal entry site. F. luc, firefly luciferase gene sequence. pA, polyadenylation signal. PGK, PGK promoter. Fah, mouse Fah cDNA. GFP, GFP cDNA sequence. GOI, Gene of interest refers to Nat10 or PrkacaL206R. (B) Treatment plan. EtOH, 5% ethanol CDD, choline-deficient diet. d, days. mo, months. (C) Immunohistochemistry for NAT10, FAH, and ALB-stained liver sections from eCDD-treated mice injected with GFP/shp53 (top) or Nat10/shp53 (middle and bottom). Scalebars, 100µm. T, tumor. N, non-tumor liver. (D) Nat10 expression measured by qRT-PCR from non-tumor liver tissue (L) or liver tumor (T) from Nat10/shp53 or GFP/shp53-injected eCDD-treated mice, normalized to Actb and to wild-type mouse liver Nat10 (n = 5 each). (E) NAT10 immunohistochemical stain intensity of non-tumor liver tissue (L) or liver tumors (T) from Nat10/shp53 (n = 11 L; n = 17 T) or GFP/shp53-injected mice (n = 6 L) from both diets combined. (F) Box-and-whisker plot of tumor burden or (G) tumor penetrance for Nat10/shp53-injected mice treated with eCDD (n = 24) or ND (n = 25) or GFP/shp53-injected mice treated with eCDD (n = 36) or ND (n = 42). *P < .05. **P < .01. ***P < .001. ****P < .0001. Error bars, SEM.
Figure 6
Figure 6. Activated PKA drives steatosis-associated HCC
(A) p-PKA immunohistochemical stain intensity of human HCC and matched non-tumor liver samples on a tissue microarray (TMA), stratified by mention of steatosis in pathology report as in Figure 4E. (B) Representative immunohistochemistry for p-PKA-stained sections of human HCC (top) or matched normal liver (bottom) from TMA cases with hepatic steatosis indicated in pathology reports. (C) Immunohistochemistry for p-PKA, FAH, and ALB-stained liver sections from eCDD-treated mice injected with GFP/shp53 (top) or PKA/shp53 (middle and bottom). (D) Prkaca expression measured by qRT-PCR from non-tumor liver tissue (L) or liver tumor (T) from PKA/shp53 or GFP/shp53-injected eCDD-treated mice, normalized to Actb and to wild-type mouse liver Prkaca (n = 5 each). (E) p-PKA immunohistochemistry stain intensity of non-tumor liver tissue (L) or liver tumors (T) from PKA/shp53 (n = 17 each) or GFP/shp53-injected mice (n = 13) from both diets combined. (F) Box-and-whisker plot of tumor burden or (G) tumor penetrance for PKA/shp53-injected mice treated with eCDD (n = 33) or ND (n = 26) or GFP/shp53-injected mice treated with eCDD (n = 36) or ND (n = 42). Scalebars, 100µm. T, tumor. N, non-tumor liver tissue. #P > .05. *P < .05. **P < .01. ***P < .001 ****P < .0001. Error bars, SEM.

References

    1. Ferlay J, Soerjomataram I, Ervik M, Dikshit R, Eser S, Mathers C, et al. GLOBOCAN 2012 v1.0, Cancer Incidence and Mortality Worldwide: IARC CancerBase No. 11 [Internet] Lyon, Fr. Int. Agency Res. Cancer. 2013 Available from: http://globocan.iarc.fr.
    1. El-Serag HB. Hepatocellular carcinoma. N Engl J Med. 2011;365:1118–27. - PubMed
    1. Ascha MS, Hanouneh IA, Lopez R, Tamimi TA-R, Feldstein AF, Zein NN. The incidence and risk factors of hepatocellular carcinoma in patients with nonalcoholic steatohepatitis. Hepatology. 2010;51:1972–78. - PubMed
    1. Lieber CS. Alcoholic fatty liver: its pathogenesis and mechanism of progression to inflammation and fibrosis. Alcohol. 2004;34:9–19. - PubMed
    1. Seitz HK, Stickel F. Risk factors and mechanisms of hepatocarcinogenesis with special emphasis on alcohol and oxidative stress. Biol Chem. 2006;387:349–60. - PubMed

MeSH terms

Substances