. 2017 Dec 1;77(23):6667-6678.
doi: 10.1158/0008-5472.CAN-17-0740. Epub 2017 Oct 9.

IL10 Release upon PD-1 Blockade Sustains Immunosuppression in Ovarian Cancer

Affiliations

IL10 Release upon PD-1 Blockade Sustains Immunosuppression in Ovarian Cancer

Purushottam Lamichhane et al. Cancer Res. .

Abstract

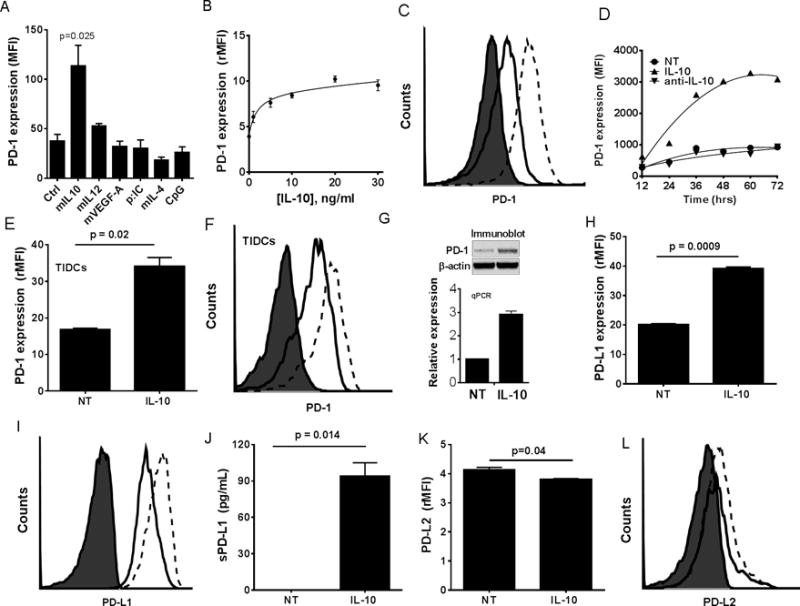
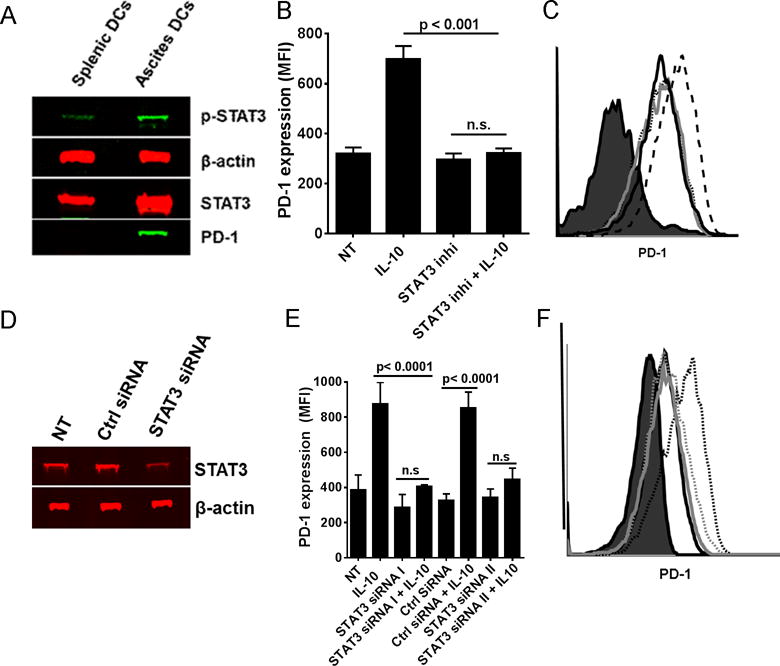
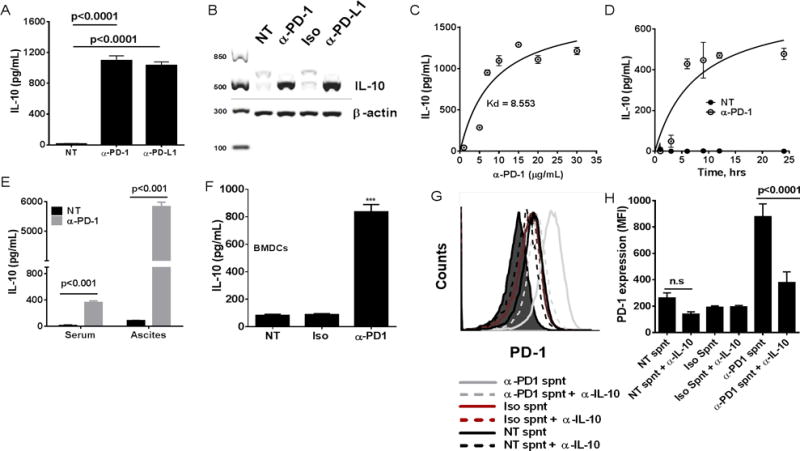
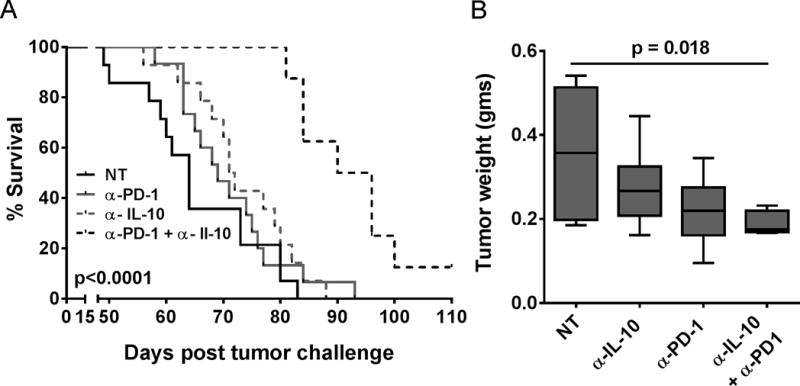
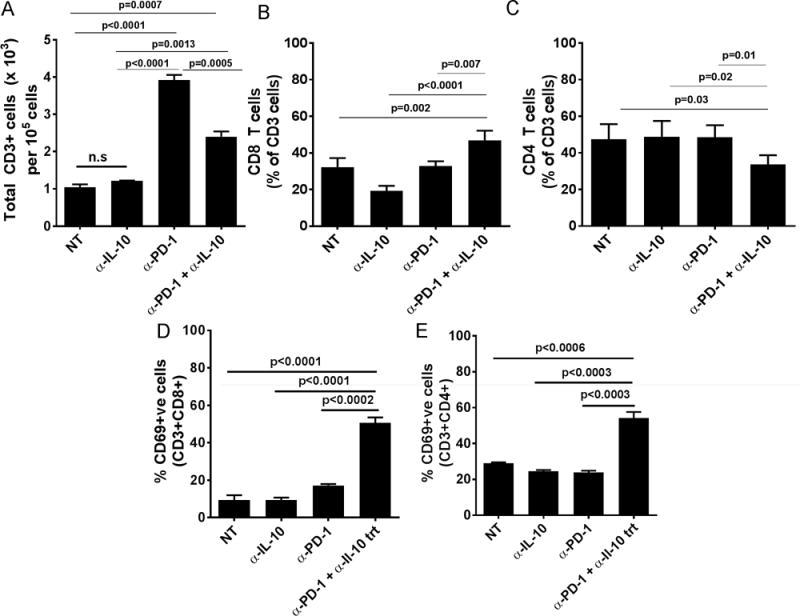
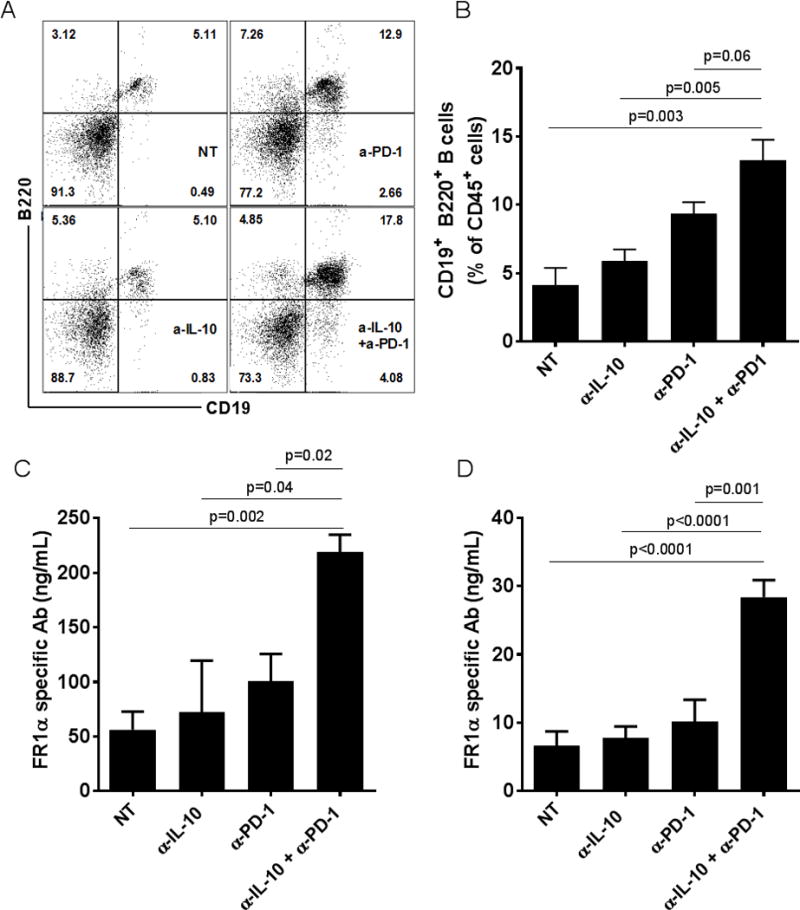
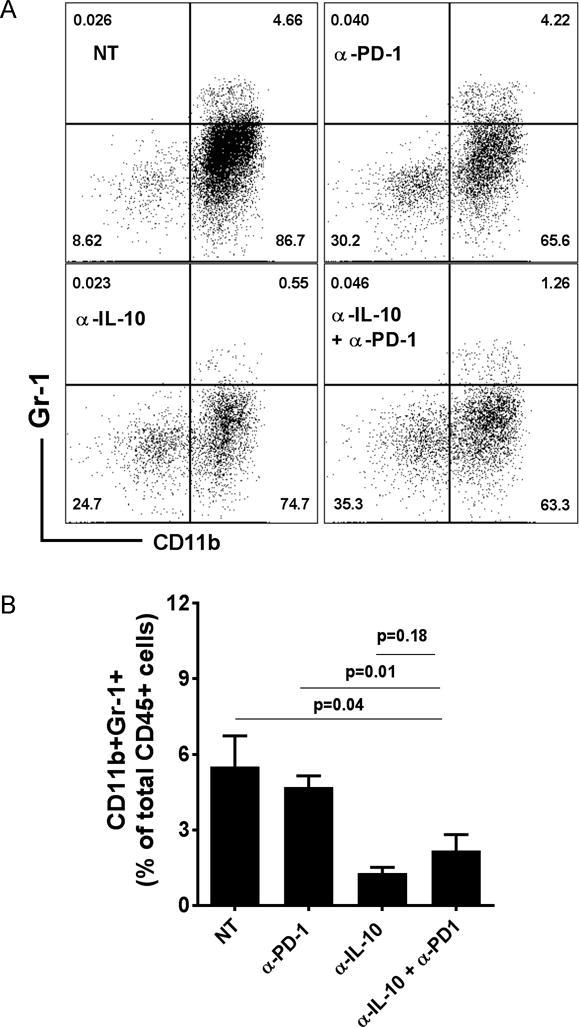
Ligation of programmed cell death-1 (PD-1) in the tumor microenvironment is known to inhibit effective adaptive antitumor immunity. Blockade of PD-1 in humans has resulted in impressive, durable regression responses in select tumor types. However, durable responses have been elusive in ovarian cancer patients. PD-1 was recently shown to be expressed on and thereby impair the functions of tumor-infiltrating murine and human myeloid dendritic cells (TIDC) in ovarian cancer. In the present work, we characterize the regulation of PD-1 expression and the effects of PD-1 blockade on TIDC. Treatment of TIDC and bone marrow-derived dendritic cells (DC) with IL10 led to increased PD-1 expression. Both groups of DCs also responded to PD-1 blockade by increasing production of IL10. Similarly, treatment of ovarian tumor-bearing mice with PD-1 blocking antibody resulted in an increase in IL10 levels in both serum and ascites. While PD-1 blockade or IL10 neutralization as monotherapies were inefficient, combination of these two led to improved survival and delayed tumor growth; this was accompanied by augmented antitumor T- and B-cell responses and decreased infiltration of immunosuppressive MDSC. Taken together, our findings implicate compensatory release of IL10 as one of the adaptive resistance mechanisms that undermine the efficacy of anti-PD-1 (or anti-PD-L1) monotherapies and prompt further studies aimed at identifying such resistance mechanisms. Cancer Res; 77(23); 6667-78. ©2017 AACR.


Conflict of interest statement

Conflicts of interest: There are no conflicts of interest to disclose by any of the authors.

Figures

Figure 1
Figure 1. IL-10 increases the expression of PD-1 and its ligand PD-Ll on ovarian DCs
Panel A shows mean fluorescence intensity (MFI) of PD-1 staining on BMDCs following 48 hrs exposure to cytokines and TLR agonists. Each bar represents mean ± SEM (n=3). Panel B shows line graph of mean ± SEM (n=3) relative MFI (rMFI) values for PD-1 expression on BMDCs treated for 48 hrs with increasing concentrations of IL-10. Panel C shows a representative histogram of PD-1 expression on BMDCs treated with IL-10. Panel D shows a line graph of the MFI values for PD-1 expression on BMDCs treated over a time course with 10 ng/ml IL-10, control vehicle (NT), or anti-IL-10 neutralizing antibody. Panel E shows the mean ± SEM (n=3) rMFI values for PD-1 on ID8-derived TIDCs, obtained from ascites, treated or untreated with IL-10 for 48 hrs. Panel F shows a representative histogram of data from Panel E. Panel G shows photograph of representative western blot (top) and PCR (bottom) of PD-1 protein and mRNA levels respectively in BMDCS. Panel H shows the mean ± SEM (n=3) rMFI values of surface bound PD-L1 expression on BMDCs treated as above. Panel I is a representative histogram for Panel H. Panels J shows the mean ± SEM (n=3) levels of soluble PD-L1 (sPD-L1) in supernatants of BMDCs either untreated or treated with IL-10. Panel K shows the mean ± SEM (n=3) rMFI values of surface bound PD-L2 expression on BMDCs treated as above. Panel L is a representative histogram for Panel K. Filled histogram = isotype stain, solid line = untreated (NT) DCs, and dashed lines = IL-10-treated DCs. P values were calculated with a Student’s Paired T test. All data is representative of three individual experiments with similar results.
Figure 2
Figure 2. IL-10 mediated increase in PD-1 expression on DCs is STAT3 dependent
Panel A shows representative western blot of phospho-STAT3 (p-stat3), STAT3, PD-1, and β-actin on lysates from CD11c+ DCs isolated from spleen and ascites of ID8 tumor-bearing mice. Panel B shows the bar graph (± SEM, N=3) and Panel C representative histograms of MFI values of PD-1 on BMDCs either treated with IL-10 alone, STAT3 inhibitor alone, or STAT3 inhibitor followed by IL-10 for 48 hrs. Filled histogram = isotype stain, solid dark line = Untreated, solid gray line = STAT3 inhibitor treated, dotted line = IL-10 + STAT3 inhibitor treated, and dashed line = IL-10 treated BMDCs. Panel D shows the representative western blot (left) of STAT3 on lysates from STAT3 siRNA treated BMDCs. Panel E shows the bar graph (± SEM, N=2–5) and the Panel F shows the representative histogram of PD-1 expression (MFI) on BMDCs either treated or untreated with IL-10 post siRNA transfection. Filled histogram = isotype stain, solid dark line = Ctrl siRNA treated, dotted dark line = Ctrl siRNA + IL-10 treated, solid gray line = STAT3 siRNA treated, and dotted gray line = STAT3 siRNA + IL-10 treated BMDCs. The p values were calculated with a Student’s T test. All data is representative of three individual experiments with similar results.
Figure 3
Figure 3. PD-1 blockade on DCs enhances the release of IL-10 creating a feedback loop
Panel A shows bar graph of mean (± SEM; N=3 replicates) IL-10 concentrations (pg/mL) on the culture supernatants from the TIDCs treated for 24 hrs with irrelevant ab (Iso), PD-1 blocking ab (α-PD-1), or PD-L1 blocking ab (α-PD-L1). Panel B shows representative photo of an RT-PCR reaction evaluating both IL-10 and β-actin expression in TIDCs that were either treated with Iso or α-PD-1 for 24 hrs in vitro. Panel C shows line graph of IL-10 concentrations (pg/mL) in the culture supernatants from the TIDCs treated for 24 hrs with increasing concentrations of anti-PD-1 blocking antibody. Each data point is the mean ± SEM of triplicate measurements. Panel D shows line graph of IL-10 concentrations (pg/mL) in culture supernatants of TIDCs cultured in vitro over a time course. Each data point is the mean ± SEM of triplicate measurements. Panel E shows bar graph of mean IL-10 concentrations (pg/mL) (± SEM; n=5) in ascites and blood serum of tumor bearing mice that were either untreated or treated with PD-1 blocking Ab as described in materials and methods. Panel F shows bar graph of mean (± SEM; N=3 replicates) IL-10 concentrations (pg/mL) on the culture supernatants from the IL-10 treated BMDCs (PD-1+) that were treated for 24 hrs as in A. Panel G shows representative histograms (left) and bar graph (± SEM, N=3) of MFI values of PD-1 (right) on BMDCs that were treated with conditioned media (culture supernatants) from BMDCs that were either untreated or treated with isotype Ab or PD-1 blocking Ab as in B. Culture supernatants were then either pretreated with IL-10 neutralizing Ab or untreated before adding on to the fresh cultures of BMDCs.
Figure 4
Figure 4. Combination of PD-1 blockade and IL-10 neutralization reduces tumor burden and enhances survival of tumor bearing mice
Panel A shows Kaplan-Meier plot of ID8 tumor-bearing mice (N=12–16) that were treated intraperitoneally with respective antibodies starting at day 25 post tumor implantation. Panel B shows mean tumor weights in gms (±SEM, N = 5–6), from different treatment groups, as measured at the time of ascites harvest.
Figure 5
Figure 5. Combination treatment enhances the infiltration of activated T cells in the ascites of tumor bearing mice
Panel A shows are the mean (±SEM, N=6) number of T cells per 1 × 10⁵ leukocytes in the ascites of tumor-bearing mice from different treatment groups. Panels B–C show the mean (±SEM, N=4) percentages of CD8+ T cells (Panel B) and CD4+ T cells (Panel C) among total CD3 cells from the ascites of tumor bearing mice from treatment groups. Panels D–E show the mean (±SEM, N=5–7) percentages of CD69+ cells among CD8+ T cells (Panel D) and CD4+ T cells (Panel E) from the ascites of tumor bearing mice from treatment groups.
Figure 6
Figure 6. Combination treatment enhances the antigen specific antibody response in tumor bearing mice
Panel A shows the representative dot plot and Panel B shows a bar graph of the the mean frequency (±SEM., N=4–5 replicates) of CD19+B220+ B cells among CD45+ cells from the ascites of tumor-bearing mice. Panels C and D show are the mean levels (ng/ml) of FRα specific antibodies measured in the serum (±SEM, N=3 replicates) and ascites (±SEM, N=7 replicates) respectively, of mice from the different treatment groups.
Figure 7
Figure 7. Combination treatment results in decreased infiltration of MDSCs in the ascites of tumor bearing mice
Panel A shows the representative dot plots of CD11b+Gr1+ cells in the ascites from different treatment groups. For analysis, live cells were pre-gated on CD45+ cells. Panel B shows the mean frequency (±SEM, N=5–7) of CD11b+Gr1+ cells in the ascites of the different treatment groups.

References

    1. Keir ME, Butte MJ, Freeman GJ, Sharpe AH. PD-1 and its ligands in tolerance and immunity. Annu Rev Immunol. 2008;26:677–704. - PMC - PubMed
    1. Jin HT, Ahmed R, Okazaki T. Role of PD-1 in regulating T-cell immunity. Curr Top Microbiol Immunol. 2011;350:17–37. - PubMed
    1. Agata Y, Kawasaki A, Nishimura H, Ishida Y, Tsubata T, Yagita H, et al. Expression of the PD-1 antigen on the surface of stimulated mouse T and B lymphocytes. Int Immunol. 1996;8:765–72. - PubMed
    1. Krempski J, Karyampudi L, Behrens MD, Erskine CL, Hartmann L, Dong H, et al. Tumor-infiltrating programmed death receptor-1+ dendritic cells mediate immune suppression in ovarian cancer. J Immunol. 2011;186:6905–13. - PMC - PubMed
    1. Carreno BM, Collins M. The B7 family of ligands and its receptors: new pathways for costimulation and inhibition of immune responses. Annu Rev Immunol. 2002;20:29–53. - PubMed

Publication types

MeSH terms