

Disease-modifying effects of ganglioside GM1 in Huntington's disease models
- PMID: 28993428
- PMCID: PMC5666311
- DOI: 10.15252/emmm.201707763
Disease-modifying effects of ganglioside GM1 in Huntington's disease models
Abstract
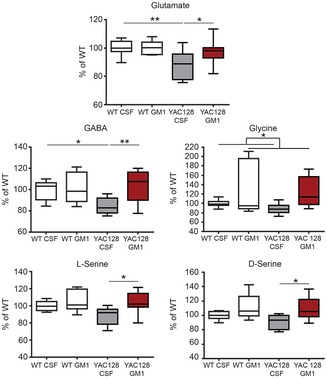
Huntington's disease (HD) is a progressive neurodegenerative disorder characterized by motor, cognitive and psychiatric problems. Previous studies indicated that levels of brain gangliosides are lower than normal in HD models and that administration of exogenous ganglioside GM1 corrects motor dysfunction in the YAC128 mouse model of HD In this study, we provide evidence that intraventricular administration of GM1 has profound disease-modifying effects across HD mouse models with different genetic background. GM1 administration results in decreased levels of mutant huntingtin, the protein that causes HD, and in a wide array of beneficial effects that include changes in levels of DARPP32, ferritin, Iba1 and GFAP, modulation of dopamine and serotonin metabolism, and restoration of normal levels of glutamate, GABA, L-Ser and D-Ser. Treatment with GM1 slows down neurodegeneration, white matter atrophy and body weight loss in R6/2 mice. Motor functions are significantly improved in R6/2 mice and restored to normal in Q140 mice, including gait abnormalities that are often resistant to treatments. Psychiatric-like and cognitive dysfunctions are also ameliorated by GM1 administration in Q140 and YAC128 mice. The widespread benefits of GM1 administration, at molecular, cellular and behavioural levels, indicate that this ganglioside has strong therapeutic and disease-modifying potential in HD.
Keywords: HD mouse models; behaviour; gangliosides; huntingtin; neuroprotection.
© 2017 The Authors. Published under the terms of the CC BY 4.0 license.
Figures
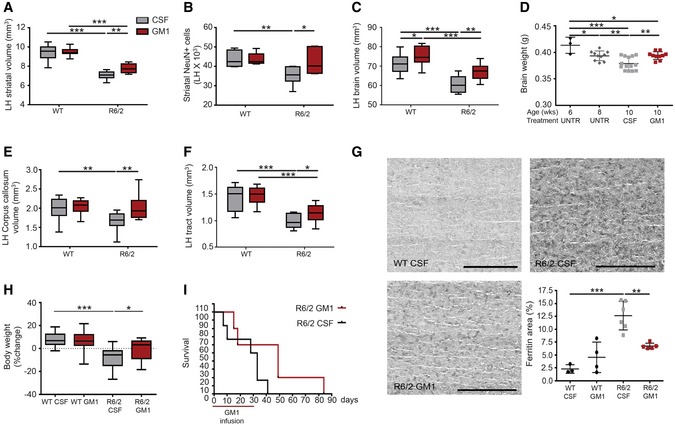
Striatal volume in the brain left hemisphere (LH, contralateral to infusion site). N = 13 WT CSF, 11 WT GM1, 11 R6/2 CSF, 9 R6/2 GM1.
Number of neurons (NeuN+ cells) in the LH striatum between bregma 0.02 mm and −2.3 mm. N = 8 WT CSF, 5 WT GM1, 7 R6/2 CSF, 6 R6/2 GM1.
Volume of the brain (LH) from bregma 2.1 mm to −2.3 mm. N = 13 WT CSF, 11 WT GM1, 11 R6/2 CSF, 9 R6/2 GM1.
Time course of brain weight loss in R6/2 mice. N = 3 6‐week R6/2, 10 8‐week R6/2, 14 10‐week R6/2 CSF and 10 10‐week R6/2 GM1.
Corpus callosum volume (LH) between bregma 2.1 mm and 0.02 mm. N = 13 WT CSF, 11 WT GM1, 11 R6/2 CSF, 9 R6/2 GM1.
Total white matter tract volume in the striatum, from 0.02 mm to bregma to −1.06 mm. N = 13 WT CSF, 11 WT GM1, 11 R6/2 CSF, 9 R6/2 GM1.
Representative microscopy images of the striatum after immunostaining with anti‐ferritin antibodies. Scale bars are 0.62 mm in length. Quantification of the immunoreactive area is shown in the graph. Eight serial sections were analysed and averaged for each mouse. N = 3 WT CSF, 4 WT GM1, 6 R6/2 CSF, 5 R6/2 GM1.
Percent change in body weight at day 21 of treatment compared to baseline (day 0). N = 23 WT CSF, 21 WT GM1, 14 R6/2 CSF, 11 R6/2 GM1.
Survival curve for R6/2 mice treated with CSF (N = 6) or GM1 (N = 5). X‐axis shows days after the beginning of GM1 treatment. The horizontal red line indicates the duration of GM1 treatment.
- A
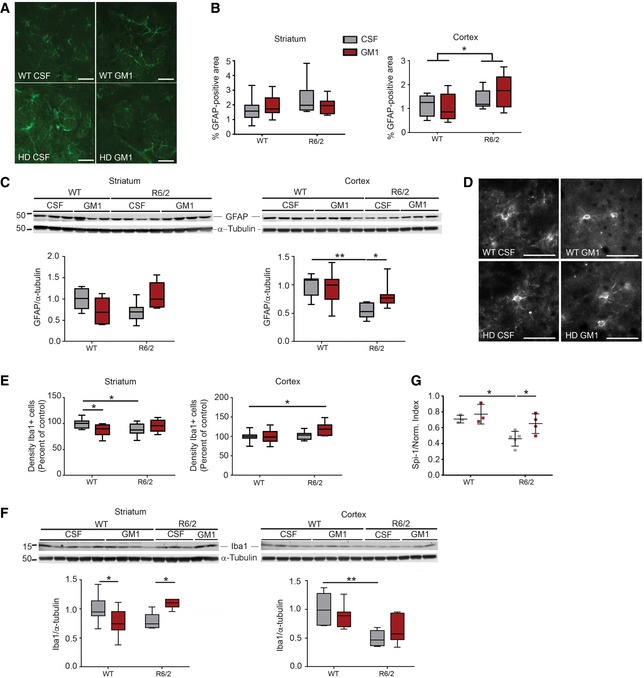
Representative brain section staining with anti‐GFAP antibodies. Areas shown are in the corpus striatum. Scale bars are 50 μm in length.
- B
Graphs show the quantification of GFAP‐immunoreactive area in micrographs of coronal serial sections. For each mouse, eight serial sections were analysed and averaged. N = 11 WT CSF, 9 WT GM1, 10 R6/2 CSF, 8 R6/2 GM1.
- C
GFAP protein expression in tissue lysates. Representative immunoblots and densitometric analysis are shown. N = 7 WT CSF, 7 WT GM1, 7 R6/2 CSF, 7 R6/2 GM1. The immunoblot showing α‐tubulin in the cortex is the same as for the cortex in (F), since GFAP and Iba1 were run in the same gel.
- D, E
Representative micrographs (D) (from the striatum) and quantification (E) of Iba1+ cell density in the cortex and striatum. For each mouse, eight serial sections were analysed and averaged. Scale bars are 50 μm in length. N = 11 WT CSF, 10 WT GM1, 10 R6/2 CSF, 9 R6/2 GM1.
- F
Iba1 protein expression in tissue lysates. Representative immunoblots and densitometric analysis are shown. The immunoblot showing α‐tubulin in the cortex is the same as for the cortex in (C), since GFAP and Iba1 were run in the same gel. N = 7 WT CSF, 7 WT GM1, 6 R6/2 CSF, 7 R6/2 GM1.
- G
Spi‐1 gene expression in the striatum, analysed by qPCR and normalized over the geometric mean of three stably expressed reference genes. N = 3 WT CSF, 3 WT GM1, 5 R6/2 CSF, 4 R6/2 GM1.
- A
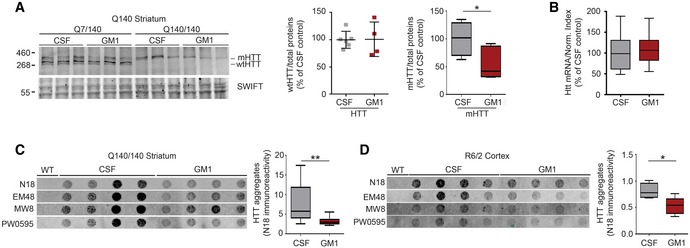
Representative immunoblots and densitometric analysis of wtHTT and mHTT in striatal tissue lysates from Q140 mice after 42 days of treatment with artificial cerebro‐spinal fluid (CSF, vehicle) or GM1. Swift™ total protein staining was used as loading control and for data normalization. Homozygous and heterozygous Q140 mice were pooled for the analysis of mHTT as GM1 had similar effects in both genotypes. For the box‐and‐whisker plot: N = 9 Q140 CSF and 7 Q140 GM1.
- B
Analysis of total HTT mRNA expression in CSF‐ and GM1‐treated Q140 mice. Data from heterozygous Q7/140 and homozygous Q140/140 mice were similar and were combined. N = 18 Q140 CSF, 17 Q140 GM1.
- C, D
Filter‐trap assay for mHTT insoluble aggregates in tissue lysates. Representative immunoblots and densitometric analysis are shown. N = 12 Q140/140 CSF, 11 Q140/140 GM1, five R6/2 CSF, six R6/2 GM1. SDS‐insoluble mHTT aggregates were detected with the indicated anti‐HTT antibodies. Only the densitometric analysis for N18 immunoreactivity is shown.
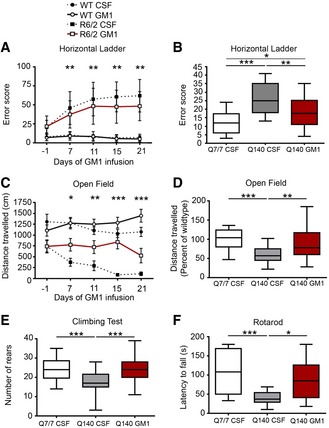
- A, B
Horizontal ladder test. Total error score from five consecutive passes is shown. N = 24 WT CSF, 21 WT GM1, 20 R6/2 CSF, 18 R6/2 GM1; N = 26 Q7/7 CSF, 23 Q140 CSF, 26 Q140 GM1.
- C, D
Open field activity test. The distance travelled during 5‐min‐long sessions is reported. For Q140 mice, the distance travelled relative to Q7/7 is shown. N = 23 WT CSF, 21 WT GM1, 20 R6/2 CSF, 17 R6/2 GM1; N = 27 Q7/7 CSF, 30 Q140 CSF, 22 Q140 GM1.
- E
Climbing test. Number of rears performed in 5 min of placement in a wire mesh container. N = 25 Q7/7 CSF, 29 Q140 CSF, 27 Q140 GM1.
- F
Fixed‐speed (12 RPM) rotarod test. Latency to fall is the average of three consecutive trials for each animal. N = 14 Q7/7 CSF, 15 Q140 CSF, 9 Q140 GM1, all females.
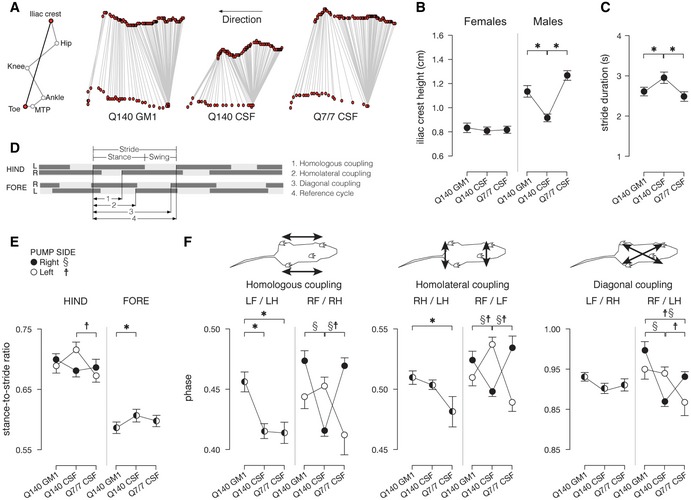
- A
Representative stick diagram decompositions (5 ms between sticks) of the left iliac crest and toe motion for a Q7/7 CSF mouse, a Q140 CSF mouse and a Q140 GM1 mouse during walking on a walkway.
- B
Mean (± s.e.m.) values for iliac crest height. N = 9 Q7/7 CSF (five males, four females), 17 Q140 CSF (seven males, 10 females), 18 Q140 GM1 (eight males, 10 females).
- C
Mean (± s.e.m.) values for stride duration. N = 9 Q7/7 CSF (five males, four females), 17 Q140 CSF (seven males, 10 females), 18 Q140 GM1 (eight males, 10 females).
- D–F
Footfall diagrams obtained from video analysis of locomotion were used to calculate: (E) stance‐to‐stride ratios and (F) coupling phase values (homologous LF/LH and RF/RH, homolateral RH/LH and RF/LF and diagonal LF/RH and RF/LH). Mean (± s.e.m.) values. N = 9 Q7/7 CSF (five males, four females), 17 Q140 CSF (seven males, 10 females), 18 Q140 GM1 (eight males, 10 females).
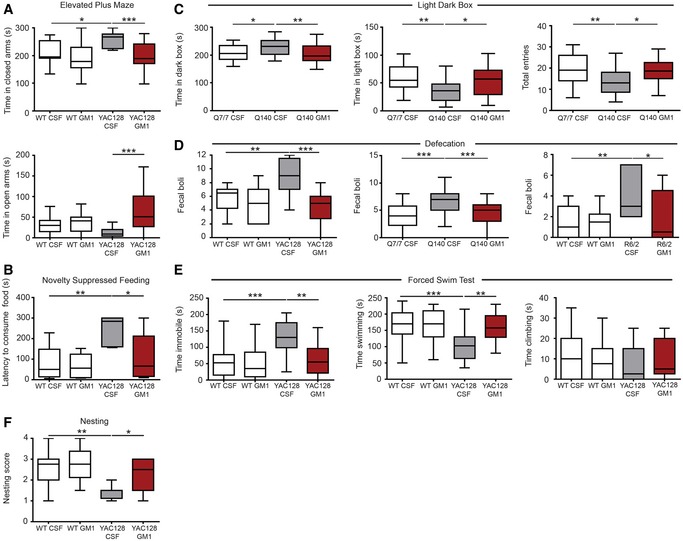
Time spent by YAC128 mice and wild‐type (WT) littermates in the various compartments of an elevated plus maze during a 5‐min‐long session. N = 15 WT CSF, 14 WT GM1, 13 YAC128 CSF, 19 YAC128 GM1.
Novelty‐suppressed feeding. Latency to consume sweetened condensed milk in a novel environment is shown. N = 10 WT CSF, 8 WT GM1, 6 YAC128 CSF, 8 YAC128 GM1.
Time spent in each compartment of a light–dark box by Q7/7 and Q140. Total number of entries is also shown. N = 28 Q7/7 CSF, 26 Q140 CSF, 29 Q140 GM1.
Faecal boli spontaneously excreted in 30‐min‐long (YAC128 and Q140 mice) or 5‐min‐long sessions (R6/2) in an open field arena. N = 12 WT CSF, 11 WT GM1, 9 YAC128 CSF, 10 YAC128 GM1; N = 24 Q7/7 CSF, 26 Q140 CSF, 29 Q140 GM1; N = 11 WT CSF, 14 WT GM1, 7 R6/2 CSF, 6 R6/2 GM1.
Forced swim test. Time spent swimming, immobile or climbing is shown for 6‐month‐old YAC128 mice and WT littermates. N = 20 WT CSF, 19 WT GM1, 19 YAC128 CSF, 14 YAC128 GM1.
Nest building was scored on a five‐point scale (0–4) based on the amount of the nestlet shredded and the height and shape of the nest. N = 12 WT CSF, 12 WT GM1, 8 YAC128 CSF, 10 YAC128 GM1.
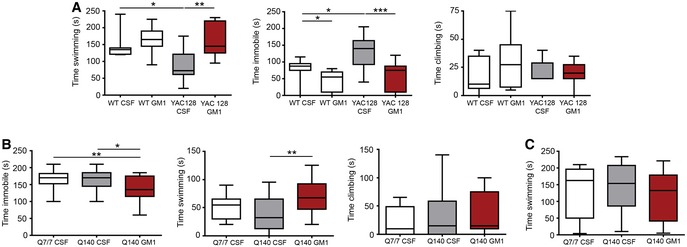
- A
The behaviour of 9‐month‐old YAC128 mice and WT littermates was assessed in the forced swim test during treatment with cerebro‐spinal fluid (CSF, vehicle) or GM1. N = 12 WT CSF, 12 WT GM1, 8 YAC128 CSF, 9 YAC128 GM1.
- B,C
Q140 mice and Q7/7 littermates were tested in the forced swim test (B) as well as in the open pool test (C) to measure swimming endurance. N = 20 Q7/7 CSF, 20 Q140 CSF, 19 Q140 GM1.
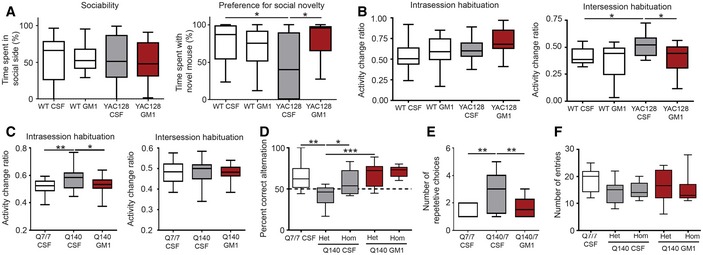
- A
Three‐chamber test. The percent of time mice spent in the chamber containing another mouse in the first part of the test (sociability) is reported. Preference for social novelty in the second part of the test is measured as the time mice spent with a second novel mouse. N = 18 WT CSF, 16 WT GM1, 16 YAC128 CSF, 17 YAC128 GM1.
- B, C
Mice were placed in an open field apparatus on two consecutive days for 30 min each day. The change in activity between the first and last 5 min of testing on day 1 was used as a measure of intrasession habituation, while the change in total distance travelled between day 1 and day 2 reflected intersession habituation. N = 15 WT CSF, 14 WT GM1, 19 YAC128 CSF and 19 YAC128 GM1; N = 24 Q7/7 CSF, 24 Q140 CSF, 25 Q140 GM1.
- D–F
Y‐maze. Mice were allowed to freely explore a Y‐maze apparatus for five minutes, during which all arm entries were recorded. Spatial working memory was assessed based on the percent correct alternation mice made (D). A correct alternation was defined as any sequence of three entries where no arm entry was repeated. N = 14 WT CSF, 14 Q7/140 CSF, 7 Q140/140 CSF, 14 Q7/140 GM1, 6 Q140/140 GM1. The number of repetitive arm entries (moving back and forth between two arms) is reported in (E) (N = 13 WT CSF, 12 Q7/140 CSF, 14 Q7/140 GM1), and the total number of arm entries is reported in (F).
References
-
- Alter M (1998) GM1 ganglioside for acute ischemic stroke. Trial design issues. Ann N Y Acad Sci 845: 391–401 - PubMed
-
- American Physiological Society (1996) Proprioceptive feedback and movement regulation In Handbook of physiology. Exercise: regulation and integration of multiple systems, Rowell LB, Shepherd JT. (eds), pp 89–127. New York: American Physiological Society;
-
- Atwal RS, Desmond CR, Caron N, Maiuri T, Xia J, Sipione S, Truant R (2011) Kinase inhibitors modulate huntingtin cell localization and toxicity. Nat Chem Biol 7: 453–460 - PubMed
Publication types
MeSH terms
Substances
Grants and funding
LinkOut - more resources
Full Text Sources
Other Literature Sources
Medical
Molecular Biology Databases
Miscellaneous
