

TGF-β1 secreted by Tregs in lymph nodes promotes breast cancer malignancy via up-regulation of IL-17RB
- PMID: 28993429
- PMCID: PMC5709760
- DOI: 10.15252/emmm.201606914
TGF-β1 secreted by Tregs in lymph nodes promotes breast cancer malignancy via up-regulation of IL-17RB
Abstract
Lymph node (LN) metastasis is commonly associated with systemic distant organ metastasis in human breast cancer and is an important prognostic predictor for survival of breast cancer patients. However, whether tumor-draining LNs (TDLNs) play a significant role in modulating the malignancy of cancer cells for distant metastasis remains controversial. Using a syngeneic mouse mammary tumor model, we found that breast tumor cells derived from TDLN have higher malignancy and removal of TDLNs significantly reduced distant metastasis. Up-regulation of oncogenic Il-17rb in cancer cells derived from TDLNs contributes to their malignancy. TGF-β1 secreted from regulatory T cells (Tregs) in the TDLNs mediated the up-regulation of Il-17rb through downstream Smad2/3/4 signaling. These phenotypes can be abolished by TGF-β1 neutralization or depletion of Tregs. Consistently, clinical data showed that the up-regulation of IL-17RB in cancer cells from LN metastases correlated with the increased prevalence of Tregs as well as the aggressive growth of tumors in mouse xenograft assay. Together, these results indicate that Tregs in TDLNs play an important role in modulating the malignancy of breast cancer cells for distant metastasis. Blocking IL-17RB expression could therefore be a potential approach to curb the process.
Keywords: IL‐17RB; TGF‐β1; breast cancer; regulatory T cell; tumor‐draining lymph node.
© 2017 The Authors. Published under the terms of the CC BY 4.0 license.
Figures
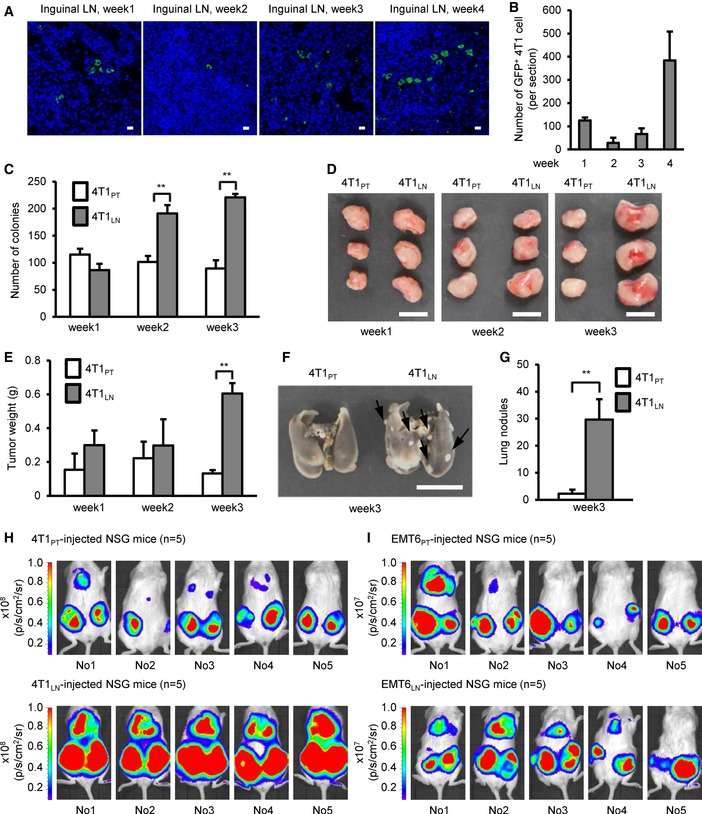
- A, B
Inguinal LNs were harvested from 4T1‐injected mice at the indicated week after initial injection. LN tissues were fixed and paraffin‐embedded. Immunofluorescence was performed with anti‐GFP antibody to visualize GFP+ 4T1 cells. (A) Confocal micrographs of the representative field of the LN section. Scale bar: 10 μm. (B) Histograms illustrated that the dynamic changes of GFP+ 4T1 cells metastasized to the inguinal LN. Cells were counted in whole sections (two non‐consecutive sections per LN per mouse). Each group was composed of at least two mice.
- C–I
4T1‐injected or EMT6‐injected mice were sacrificed at the indicated week after initial injection. Collagenase‐digested specimens from the primary tumors or inguinal LN tissues were cultured in culture dish for cancer cell enrichment. The detailed process is described in the methods section. After several days selection/culture, viable 4T1PT, 4T1LN, EMT6PT, and EMT6LN cells were used for the following assays. (C) Soft‐agar colony‐forming activity was examined in 4T1PT and 4T1LN cells (5 × 10² cells/well, n = 4 wells per group). (D, E) Tumorigenesis assays were determined in BALB/c mice (n = 3 mice per group) orthotopically injected with 5 × 10² 4T1PT or 4T1LN cells. Tumor mass (D) and tumor weight (E) were measured on day 28. Scale bar: 1 cm. (F, G) BALB/c mice (n = 3 mice per group) were injected with 2 × 10⁵ 4T1PT or 4T1LN cells via tail vein. Lung colonization was examined by lung morphology (F) and the numbers of tumor nodule (G) on day 21. Scale bar: 1 cm. Black arrow: Lung nodule. (H, I) NSG mice (n = 5 mice per group) were orthotopically injected with 4T1PT (5 × 10²), 4T1LN (5 × 10²), EMT6PT (1 × 10²), or EMT6LN (1 × 10²) cells. Distant organ metastasis was examined by bioluminescent images on day 28. The bioluminescent signal (pseudocolor) was recorded as photons per second per centimeter squared per steradian (p/s/cm2/sr), and the luminescent image was overlaid on the photographic image.
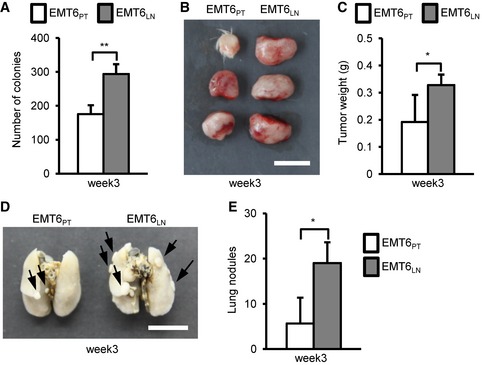
- A
Soft‐agar colony‐forming activity was examined in EMT6PT and EMT6LN cells (4 × 10² cells/well, n = 4 wells per group).
- B, C
Tumorigenesis assays were determined in BALB/c mice (n = 3 mice per group) orthotopically injected with 1 × 10² EMT6PT or EMT6LN cells. Tumor mass (B) and tumor weight (C) were measured on day 28. Scale bar: 1 cm.
- D, E
BALB/c mice (n = 3 mice per group) were injected with 1 × 10⁵ EMT6PT or EMT6LN cells via tail vein. Lung colonization was examined by lung morphology (D) and the numbers of tumor nodule (E) on day 21. Scale bar: 1 cm. Black arrow: Lung nodule.
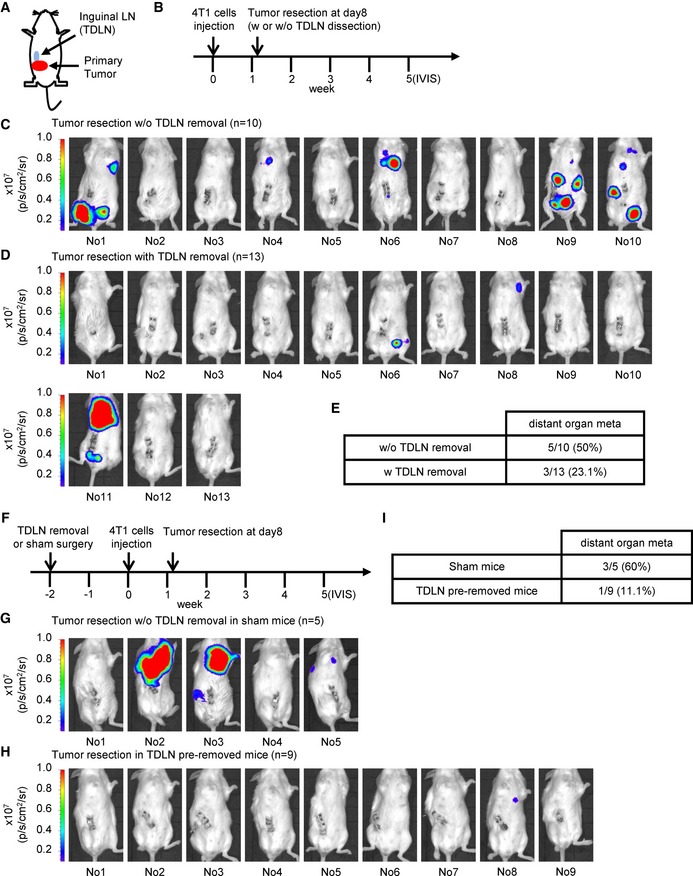
- A, B
Schematic diagram of tumor resection with or without tumor‐draining lymph node removal in 4T1 tumor‐bearing mice.
- C, D
Distant organ metastasis was examined by bioluminescent images of 4T1 tumor‐bearing mice after tumor resection with (n = 13 mice) or without (n = 10 mice) tumor‐draining lymph node dissection on week 5. The bioluminescent signal (pseudocolor) was recorded as photons per second per centimeter squared per steradian (p/s/cm2/sr), and the luminescent image was overlaid on the photographic image. For the additional details, see the Materials and Methods section.
- E
Summary table of distant organ metastasis derived from each surgery group in (C, D).
- F
Schematic diagram of tumor resection in inguinal lymph node pre‐removed or sham control 4T1 tumor‐bearing mice.
- G, H
Distant organ metastasis was examined by bioluminescent images of inguinal lymph node pre‐removed tumor‐bearing mice (n = 9 mice) or sham surgery tumor‐bearing mice (n = 5 mice) after tumor resection on week 5. The bioluminescent signal (pseudocolor) was recorded as photons per second per centimeter squared per steradian (p/s/cm2/sr), and the luminescent image was overlaid on the photographic image. For additional details, see the Materials and Methods section.
- I
Summary table of distant organ metastasis derived from each surgery group in (G, H).
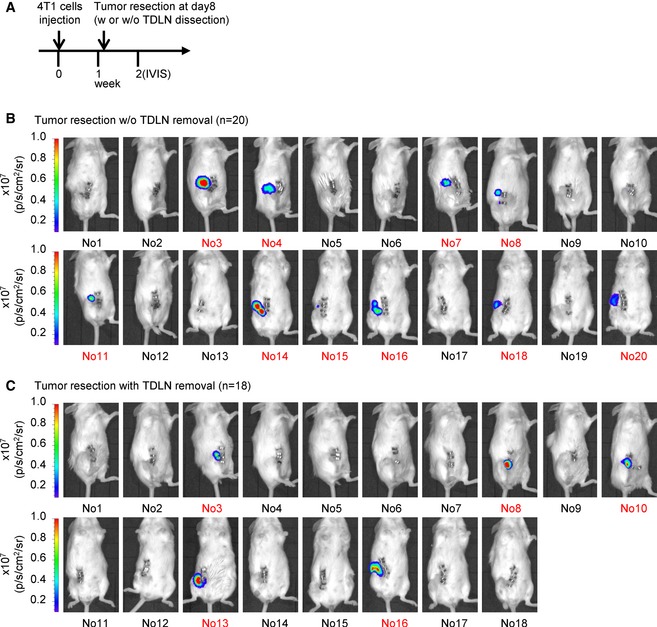
- A
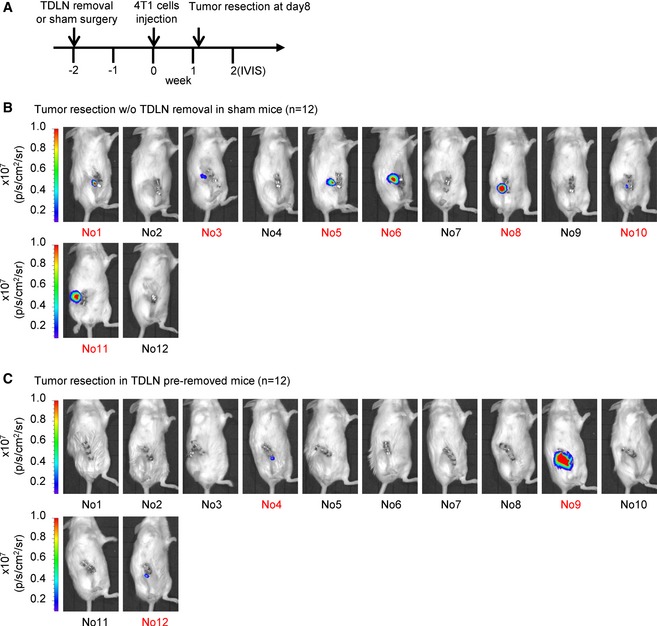
Schematic diagram of tumor resection with or without tumor‐draining lymph node removal in 4T1 tumor‐bearing mice.
- B, C
The recurrence of primary tumor was examined by bioluminescent images of tumor‐bearing mice after tumor resection on week 2. Ten control mice (surgical removal of a primary tumor) and five experimental mice (surgical removal of both primary tumor and inguinal LN) were excluded due to primary tumor recurrence at week 2. The excluded mice are labeled in red.
- A
Schematic diagram of tumor resection in inguinal lymph node pre‐removed 4T1 tumor‐bearing mice or sham surgery tumor‐bearing mice.
- B, C
The recurrence of primary tumor was examined by bioluminescent images of tumor‐bearing mice after tumor resection on week 2. Seven control mice (surgical removal of a primary tumor in sham control surgery mice) and three experimental mice (surgical removal of a primary tumor in lymph node‐removed mice) are excluded due to the primary tumor recurrence at week 2 and labeled in red.
- A
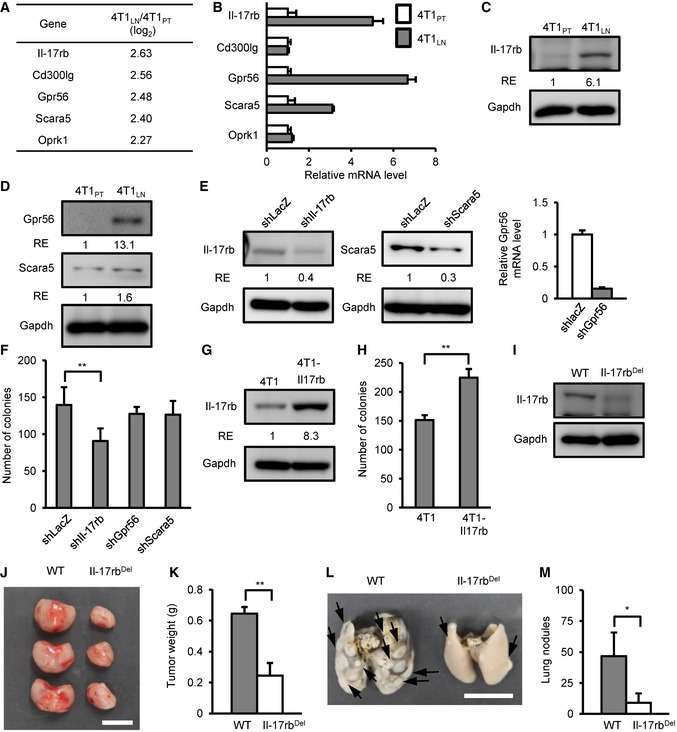
Gene expression profiles were shown at 4T1LN to 4T1PT cells. Five genes encoding cell surface proteins were identified among up‐regulated genes.
- B
mRNA expression of each candidate gene in 4T1PT and 4T1LN cells was determined by RT–qPCR. Gapdh was used as an internal control.
- C, D
Il‐17rb, Gpr56, and Scara5 expression in 4T1PT and 4T1LN cells were examined by Western blotting analysis.
- E
Western blotting and RT–qPCR analysis of Il‐17rb, Gpr56, and Scara5 expression in 4T1 cells transduced with Il‐17rb, Gpr56, Scara5, or control LacZ shRNA lentivirus, respectively.
- F
Soft‐agar colony‐forming activity was examined in lentivirus‐transduced shIl‐17rb, shGpr56, shScara5, or shLacZ 4T1 cells (5 × 10² cells/well, n = 6 wells per group).
- G
Western blotting analysis was used to detect ectopic expression of Il‐17rb in 4T1 cells infected with either lentiviruses carrying Il‐17rb cDNA or empty vector.
- H
Soft‐agar colony‐forming activity was examined using control or Il‐17rb over‐expressing 4T1 cells (5 × 10² cells/well, n = 6 wells per group).
- I
Western blotting analysis was used to examine Il‐17rb in a representative Il‐17rbDel 4T1 clone derived from Il‐17rb‐knockout 4T1 cells using a CRISPR/Cas9 system.
- J, K
Tumorigenesis assays were determined in BALB/c mice (n = 3 mice per group) orthotopically injected with 5 × 10² 4T1 cells from WT or Il‐17rbDel clone. Tumor mass (J) and weight (K) were measured on day 28. Scale bar: 1 cm.
- L, M
BALB/c mice (n = 3 mice per group) were injected with 5 × 10⁵ 4T1 cells from WT or Il‐17rbDel clone via tail vein. Lung colonization was examined by lung morphology (L) and the numbers of tumor nodule (M) on day 21. Scale bar: 1 cm. Black arrow: Lung nodule.
- A
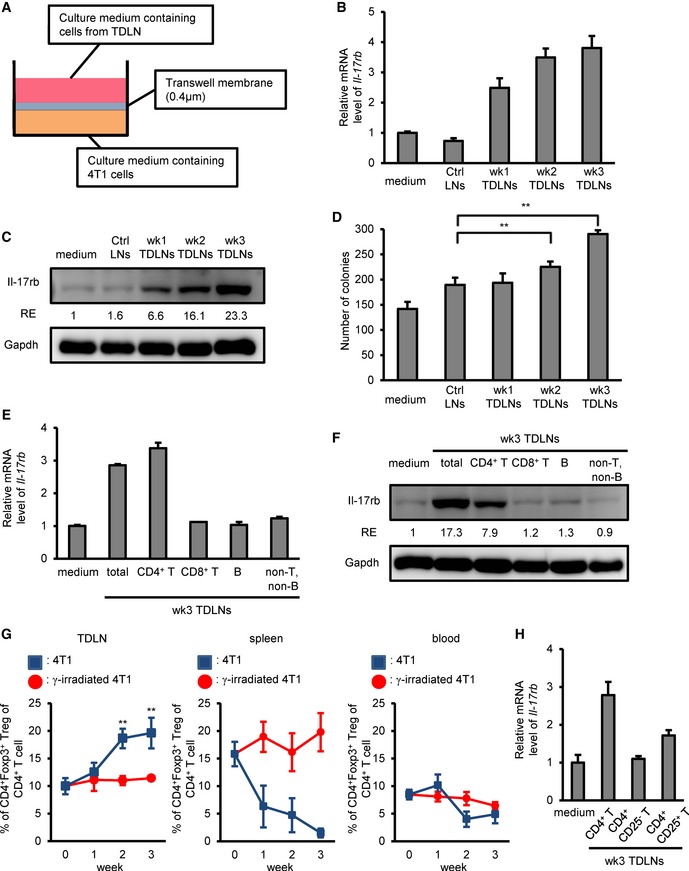
Schematic diagram of the in vitro co‐culture system using 4T1 cells and total cells isolated from tumor‐draining lymph nodes.
- B, C
4T1‐injected BALB/c mice were sacrificed at the indicated week after initial injection. Total cells isolated from inguinal lymph node tissues were transwell co‐cultured with 4T1 cells. Inguinal lymph node tissues came from un‐injection BALB/c mice as control. After 5‐day co‐culture, 4T1 cells at lower well were examined in the RT–qPCR (B) or Western blotting (C) analyses of Il‐17rb expression. Gapdh was used as an internal control or as a loading control.
- D
Soft‐agar colony‐forming activity was examined using co‐cultured 4T1 cells at lower well (5 × 10² cells/well, n = 4 wells per group).
- E, F
4T1‐injected BALB/c mice were sacrificed at 3 weeks postinitial injection. Each lymphocyte subsets isolated from inguinal lymph node tissues by FACS sorting were transwell co‐cultured with 4T1 cells. After 5‐day co‐culture, 4T1 cells at lower well were used for the RT–qPCR (E) or Western blotting (F) analyses of Il‐17rb expression. Gapdh was used as internal control or as a loading control.
- G
Percentage of CD4+Foxp3+ Tregs of total CD4+ cells in inguinal LN, spleen, and peripheral blood of BALB/c mice (n = 3 mice per group) injected with 4T1 (Blue) or γ‐irradiated 4T1 (Red) cancer cells was analyzed by FACS.
- H
4T1 cells co‐cultured with the indicated lymphocyte populations isolated from inguinal lymph node tissues of 4T1 tumor‐bearing mice by FACS sorting. After 5‐day co‐culture, 4T1 cells at lower well were analyzed for Il‐17rb expression by RT–qPCR analysis. Gapdh was used as internal control.
- A
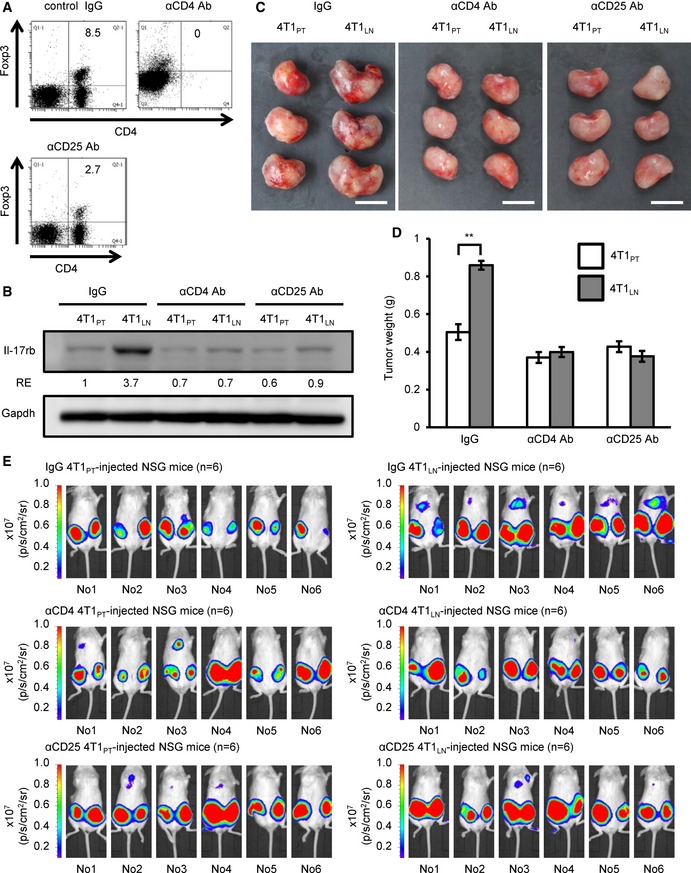
4T1‐injected BALB/c mice were treated with control IgG, anti‐CD4, or anti‐CD25 neutralizing antibody at the day 15 and day 18 after initial injection. Mice were sacrificed at 3 weeks after initial injection. Depletion of CD4+Foxp3+ Tregs in inguinal LNs was confirmed by FACS analysis.
- B
Western blotting analysis of Il‐17rb expression was performed in 4T1LN or 4T1PT cells collected from control IgG‐, anti‐CD4, or anti‐CD25 antibody‐treated 4T1 tumor‐bearing mice.
- C, D
BALB/c mice were orthotopically injected with 5 × 10² 4T1LN or 4T1PT cells collected from control IgG‐, anti‐CD4, or anti‐CD25 antibody‐treated 4T1 tumor‐bearing mice (n = 3 mice per group). Tumor mass (D) and tumor weight (E) were measured on day 28. Scale bar: 1 cm.
- E
NSG mice (n = 5 mice per group) were injected with 5 × 10² 4T1LN or 4T1PT cells collected from control IgG‐, anti‐CD4, or anti‐CD25 antibody‐treated 4T1 tumor‐bearing mice. Distant organ metastasis was examined by bioluminescent images on day 21. The bioluminescent signal (pseudocolor) was recorded as photons per second per centimeter squared per steradian (p/s/cm2/sr), and the luminescent image was overlaid on the photographic image.
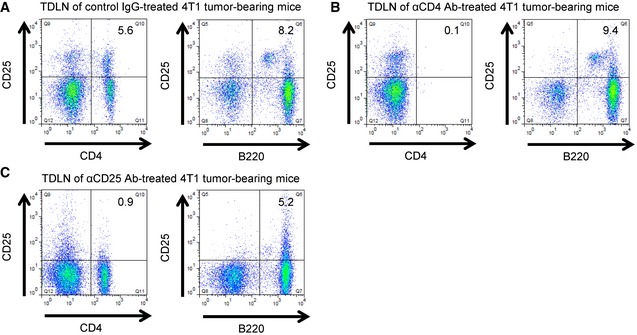
- A–C
4T1‐injected BALB/c mice were treated with control IgG (A), anti‐CD4 (B), or anti‐CD25 (C) neutralizing antibody at the day 15 and day 18 after initial 4T1 cells injection. Mice were sacrificed at 3 weeks after initial injection. The CD4+CD25+ Treg population (left panel), and B220+CD25+ Breg (right panel) population in inguinal LNs were confirmed by FACS analysis.
- A
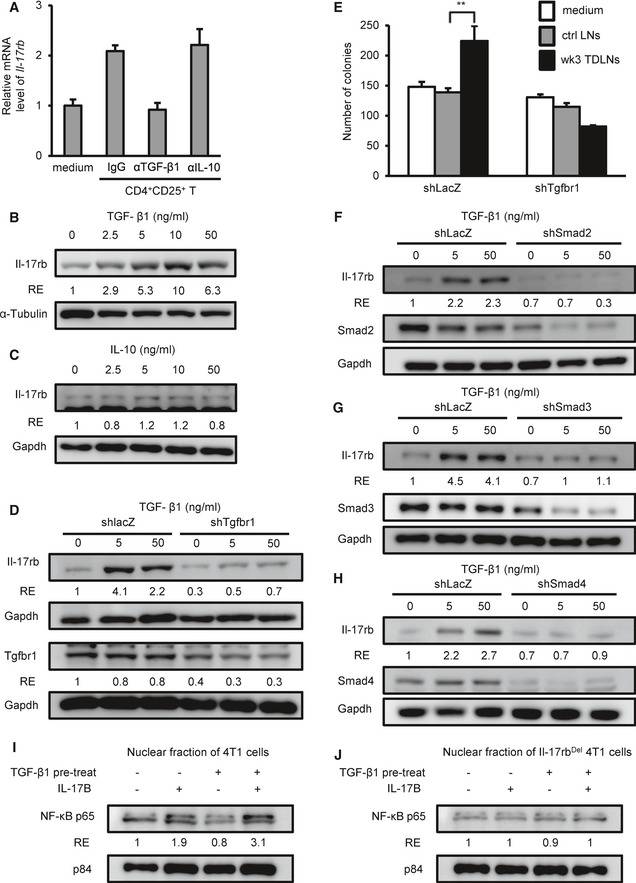
CD4+CD25+ Tregs were isolated from inguinal LN of BALB/c mice injected with 4T1 cells for 3 weeks and were transwell co‐cultured with 4T1 cells in the presence of control IgG or neutralizing antibodies against IL‐10 or TGF‐β1. After 5‐day co‐culture, 4T1 cells at lower well were analyzed for Il‐17rb expression by RT–qPCR analysis. Gapdh was used as internal control.
- B, C
Western blotting analyzed Il‐17rb in 4T1 cells treated with recombinant TGF‐β1 (B) or IL‐10 (C) proteins for 5 days.
- D
Western blotting analyzed Il‐17rb in shLacZ or shTgfbr1 4T1 cells treated with recombinant TGF‐β1 for 5 days.
- E
4T1‐injected BALB/c mice were sacrificed at 3 weeks postinitial injection. Total cells isolated from inguinal lymph node tissues were transwell co‐cultured with 4T1 cells. After 5‐day co‐culture, soft‐agar colony‐forming activity was determined in co‐cultured shLacZ or shTgfbr1 4T1 cells at lower well. (5 × 10² cells/well, n = 6 wells per group).
- F–H
Western blotting analyzed Il‐17rb in shLacZ, shSmad2 (F), shSmad3 (G), or shSmad4 (H) 4T1 cells treated with recombinant TGF‐β1 for 5 days.
- I, J
WT 4T1 (I) or Il‐17rbDel 4T1 (J) cells were treated with or without recombinant TGF‐β1 for 5 days. After treatment, nuclear translocation of NF‐κB p65 was assayed by Western blotting in cells treated with recombinant mouse IL‐17B for 2 h. Nuclear Matrix Protein p84 was used as a loading control of nuclear extracts.
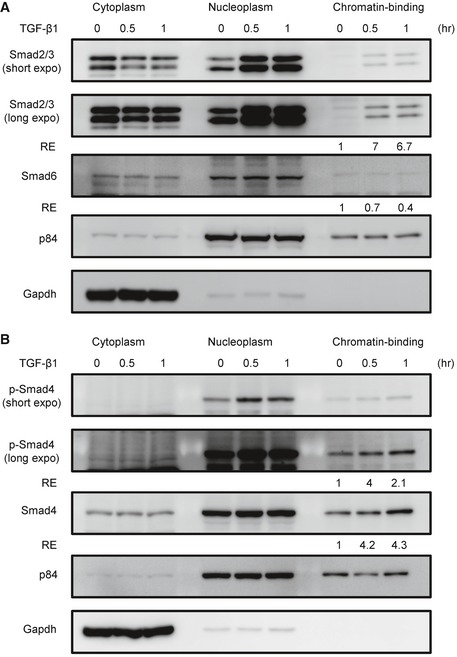
- A, B
Western blotting analyzed Smads in 4T1 cells treated with recombinant TGF‐β1 proteins. After treatment, the cytoplasm‐, nucleoplasm‐, and chromatin‐binding fractions of TGFβ‐treated 4T1 cells were isolated, respectively, by using commercial sub‐cellular protein fractionation kit for cultured cells (Thermo Scientific #78840). All experimental data were verified in at least two independent experiments. The intensity of each band was quantified using the ImageJ software. Gapdh or p84 was used as a loading control. Relative expression (RE) of protein levels in each sample to control untreated 4T1 cells is indicated.
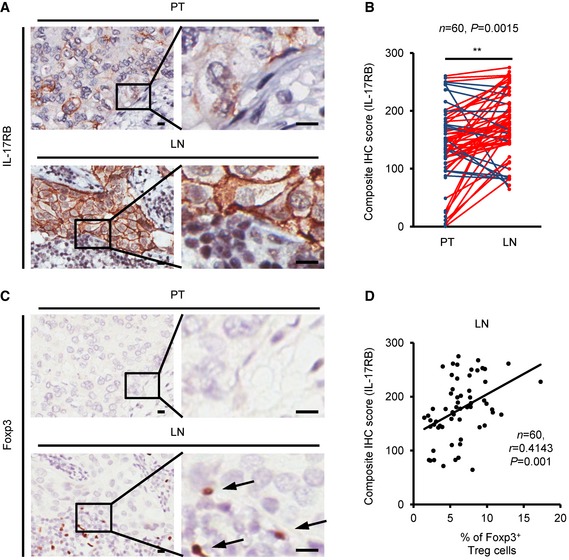
- A–C
(A, C) Representative IHC images of IL‐17RB (A) and Foxp3 (C) were taken in breast specimens from primary tumors and their paired LN metastasis specimens. Scale bar: 10 μm. (B) Dot plot showed the results of composite IHC score (staining intensity × percentage of positively stained cell) of IL‐17RB from primary tumors (PT; n = 60) and their paired LN metastasis (LN; n = 60) specimens. Black arrow: Foxp3+ Tregs cell.
- D
The correlation of IL‐17RB expression (composite IHC score) and Foxp3+ Tregs (percentage of total cells) in LN metastasis specimens (n = 60). Statistical analysis was performed with the Pearson correlation test.
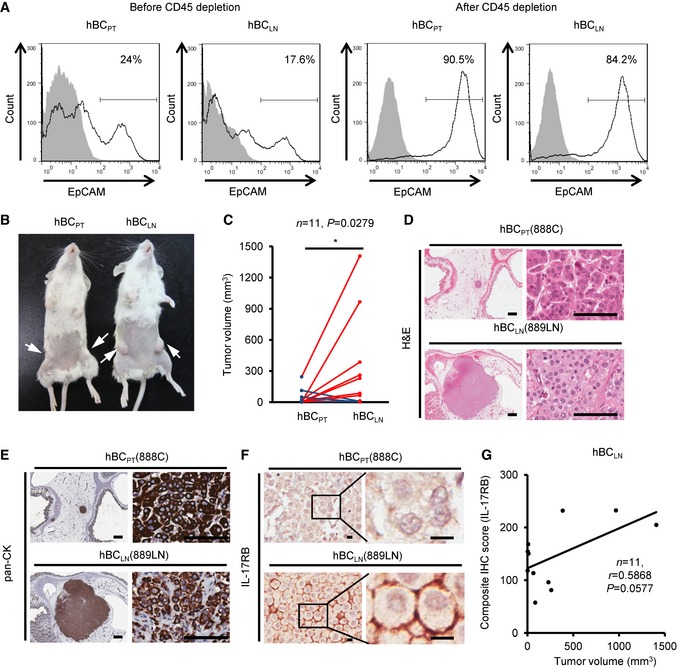
- A
Freshly collected human breast cancer (hBC) specimens (PT, primary tumors; LN, paired LN metastasis from the same breast cancer patient) were digested with collagenase‐containing buffer overnight. Depletion of hematopoietic cells by CD45 Dynabeads (Invitrogen) enriched the EpCAM+ cells for following xenografts. Percentages of EpCAM+ cells in human primary breast cancer cells were confirmed by FACS analysis (left two panels: before enrichment; right two panels: after enrichment). All of the histograms were shown that they were EpCAM expressing (black line), compared to isotype control (gray filled).
- B
Tumorigenesis assay was determined in NOD/SCID/IL2Rγnull mice orthotopically injected with hBCPT and hBCLN cells. Representative data on day 180 were shown. White arrow: Orthotopic injection site.
- C
Dot plot illustrated the tumor volumes of hBCPT and hBCLN cell‐injected NOD/SCID/IL2Rγnull mice on day 180 (n = 11). All tumors were confirmed by pan‐keratin IHC staining of fat pad sections.
- D, E
H&E stainings and IHC stainings of pan‐keratin were shown in the representative cases of fat pad sections from (B). Scale bar: 1 mm (left panels), 100 μm (right panels).
- F
IHC stainings of IL‐17RB were shown in the representative cases of fat pad sections from (B). Scale bar: 10 μm.
- G
The correlation of tumor volumes and IL‐17RB expression (composite IHC score) in hBCLN cell‐injected NOD/SCID/IL2Rγnull mice.
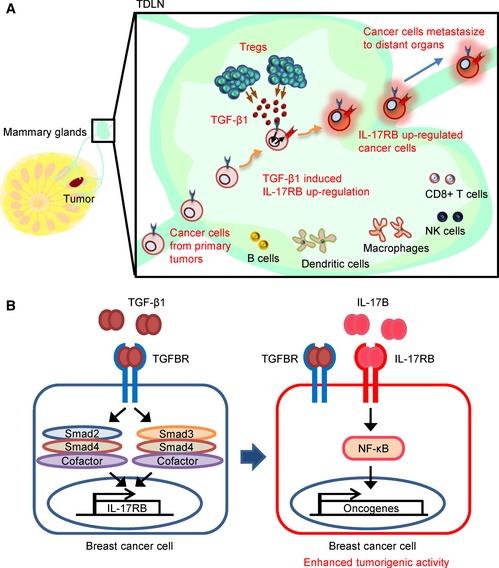
TDLNs play a pivotal role in promoting breast cancer cells for distant organ metastasis. Breast cancer cells move to TDLNs where Tregs are elevated and secreted TGF‐β1 to up‐regulate IL‐17RB expression in cancer cells.
Expression of IL‐17RB in turn activated NF‐κB pathway to promote malignancy for distant organ metastasis. Thus, the removal of TDLNs at early time point significantly reduces distant organ metastasis.
References
-
- Abner AL, Collins L, Peiro G, Recht A, Come S, Shulman LN, Silver B, Nixon A, Harris JR, Schnitt SJ et al (1998) Correlation of tumor size and axillary lymph node involvement with prognosis in patients with T1 breast carcinoma. Cancer 83: 2502–2508 - PubMed
-
- Aslakson CJ, Miller FR (1992) Selective events in the metastatic process defined by analysis of the sequential dissemination of subpopulations of a mouse mammary tumor. Cancer Res 52: 1399–1405 - PubMed
-
- Chamoto K, Wakita D, Narita Y, Zhang Y, Noguchi D, Ohnishi H, Iguchi T, Sakai T, Ikeda H, Nishimura T (2006) An essential role of antigen‐presenting cell/T‐helper type 1 cell‐cell interactions in draining lymph node during complete eradication of class II‐negative tumor tissue by T‐helper type 1 cell therapy. Cancer Res 66: 1809–1817 - PubMed
-
- Cox CE, Kiluk JV, Riker AI, Cox JM, Allred N, Ramos DC, Dupont EL, Vrcel V, Diaz N, Boulware D (2008) Significance of sentinel lymph node micrometastases in human breast cancer. J Am Coll Surg 206: 261–268 - PubMed
MeSH terms
Substances
LinkOut - more resources
Full Text Sources
Other Literature Sources
Medical
Molecular Biology Databases
Research Materials
